| Param | Original file | Final file |
|---|---|---|
| Filename | modeM0/AS1A04_043T01_9000002156_14632cztM0_level2.evt | modeM0/AS1A04_043T01_9000002156_14632cztM0_level2_quad_clean.evt |
| Size (bytes) | 272,655,360 | 52,260,480 |
| Size | 260.0 MB | 49.8 MB |
| Events in quadrant A | 1,864,716 | 342,409 |
| Events in quadrant B | 1,734,517 | 345,271 |
| Events in quadrant C | 2,639,463 | 338,304 |
| Events in quadrant D | 1,810,488 | 339,172 |
| Mode M9 | |||
|---|---|---|---|
| Quadrant | BADHDUFLAG | Total packets | Discarded packets |
| A | 0 | 13 | 0 |
| B | 0 | 13 | 0 |
| C | 0 | 13 | 0 |
| D | 0 | 13 | 0 |
| Mode M0 | |||
|---|---|---|---|
| Quadrant | BADHDUFLAG | Total packets | Discarded packets |
| A | 0 | 7610 | 2 |
| B | 0 | 7319 | 1 |
| C | 0 | 10145 | 1 |
| D | 0 | 7559 | 1 |
| Mode SS | |||
|---|---|---|---|
| Quadrant | BADHDUFLAG | Total packets | Discarded packets |
| A | 0 | 64 | 0 |
| B | 0 | 64 | 0 |
| C | 0 | 64 | 0 |
| D | 0 | 64 | 0 |
| Quadrant | Total seconds | Saturated seconds | Saturation percentage |
|---|---|---|---|
| A | 3045 | 138 | 4.532020% |
| B | 3045 | 82 | 2.692939% |
| C | 3045 | 91 | 2.988506% |
| D | 3045 | 76 | 2.495895% |
Noise dominated data is calculated using 1-second bins in cleaned event files. If a bin has >2000 counts, and if more than 50% of those come from <1% of pixels, then it is considered to be noise-dominated and hence unusable.
| Quadrant | # 1 sec bins | Bins with >0 counts | Bins with >2000 counts | High rate bins dominated by noise | Noise dominated (total time) | Noise dominated (detector-on time) | Marked lightcurve |
|---|---|---|---|---|---|---|---|
| A | 4326 | 3046 | 58 | 58 | 1.34% | 1.90% | 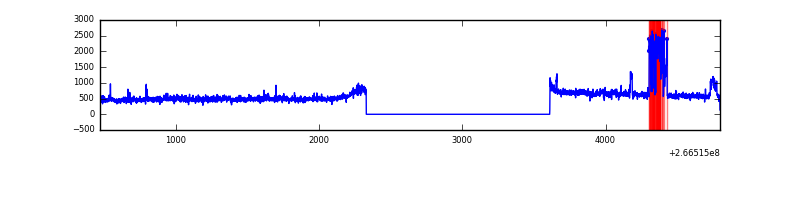 |
| B | 4326 | 3046 | 2 | 2 | 0.05% | 0.07% | 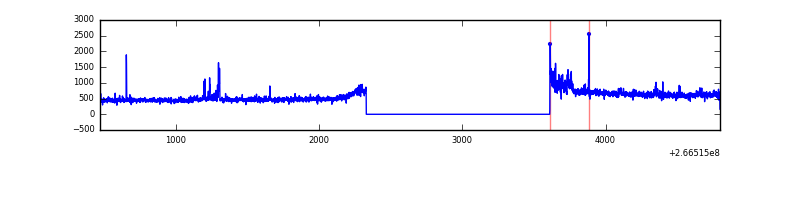 |
| C | 4326 | 3046 | 3 | 3 | 0.07% | 0.10% | 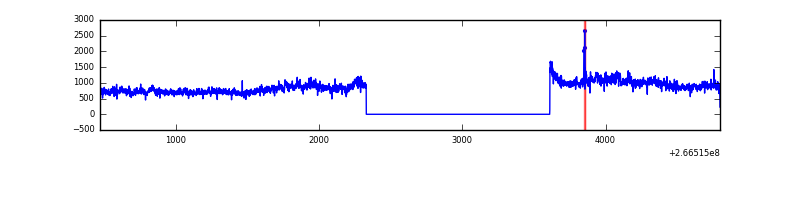 |
| D | 4326 | 3046 | 10 | 10 | 0.23% | 0.33% |  |
Top three noisy pixels from each quadrant. If the there are fewer than three noisy pixels in the level2.evt file, extra rows are filled as -1
| Pixel properties | Quadrant properties | ||||||
|---|---|---|---|---|---|---|---|
| Quadrant | DetID | PixID | Counts | Sigma | Mean | Median | Sigma |
| A | 0 | 23 | 176543 | 2134.96 | 407 | 399 | 82.5 |
| A | 1 | 162 | 38017 | 455.95 | 407 | 399 | 82.5 |
| A | 8 | 15 | 31157 | 372.8 | 407 | 399 | 82.5 |
| B | 0 | 189 | 59843 | 762.66 | 408 | 398 | 77.9 |
| B | 0 | 219 | 20829 | 262.12 | 408 | 398 | 77.9 |
| B | 4 | 173 | 13661 | 170.16 | 408 | 398 | 77.9 |
| C | 3 | 233 | 1073362 | 11685.22 | 398 | 401 | 91.8 |
| C | 0 | 207 | 8238 | 85.35 | 398 | 401 | 91.8 |
| C | 3 | 234 | 4750 | 47.36 | 398 | 401 | 91.8 |
| D | 12 | 110 | 140770 | 1469.31 | 400 | 390 | 95.5 |
| D | 10 | 199 | 58196 | 605.04 | 400 | 390 | 95.5 |
| D | 2 | 152 | 28539 | 294.63 | 400 | 390 | 95.5 |
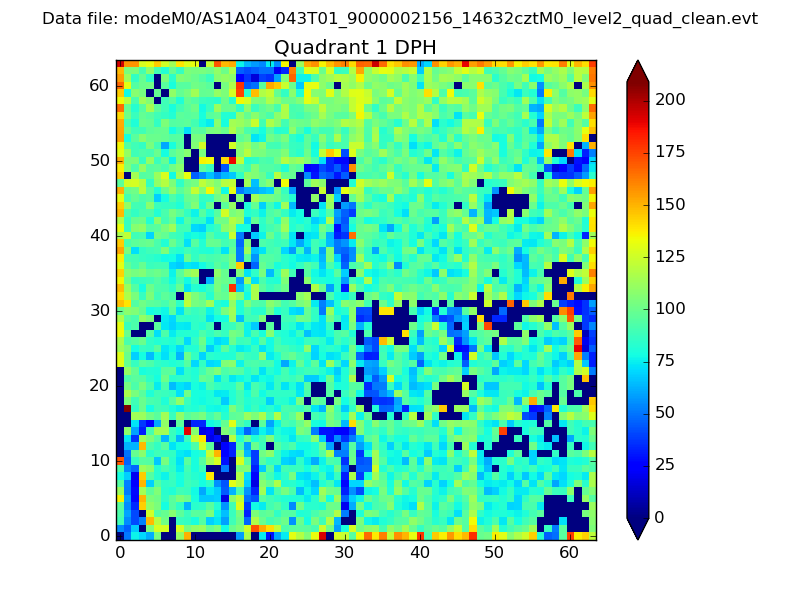
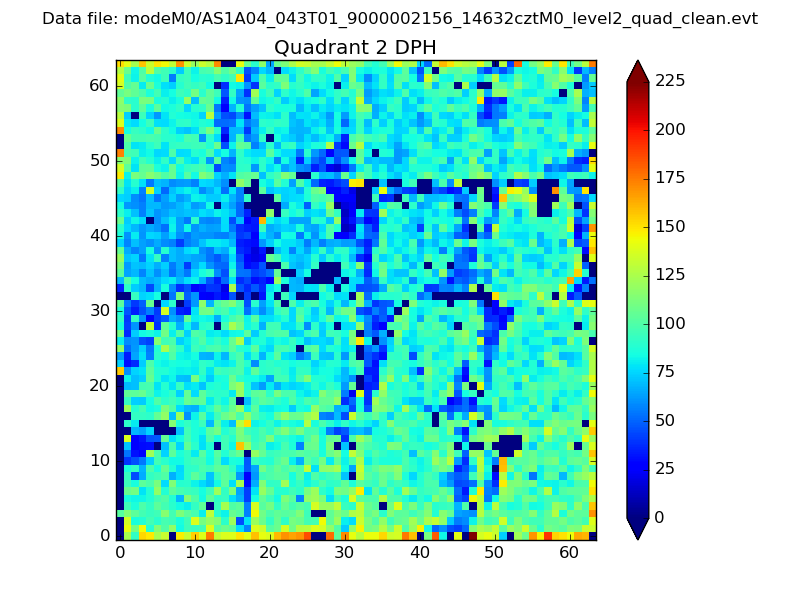
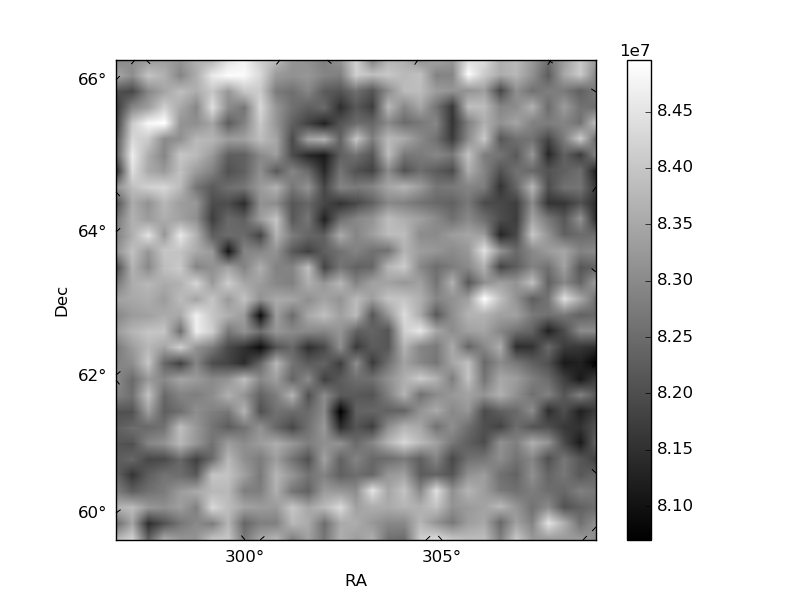
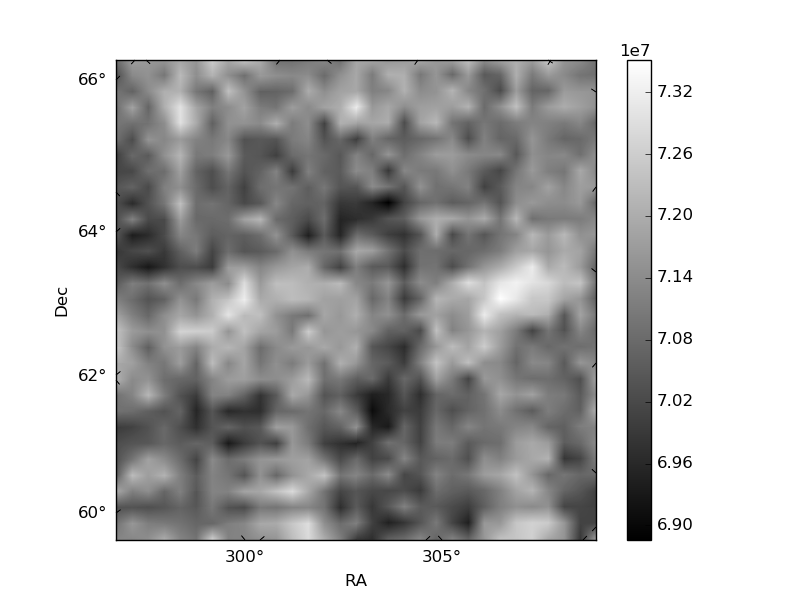
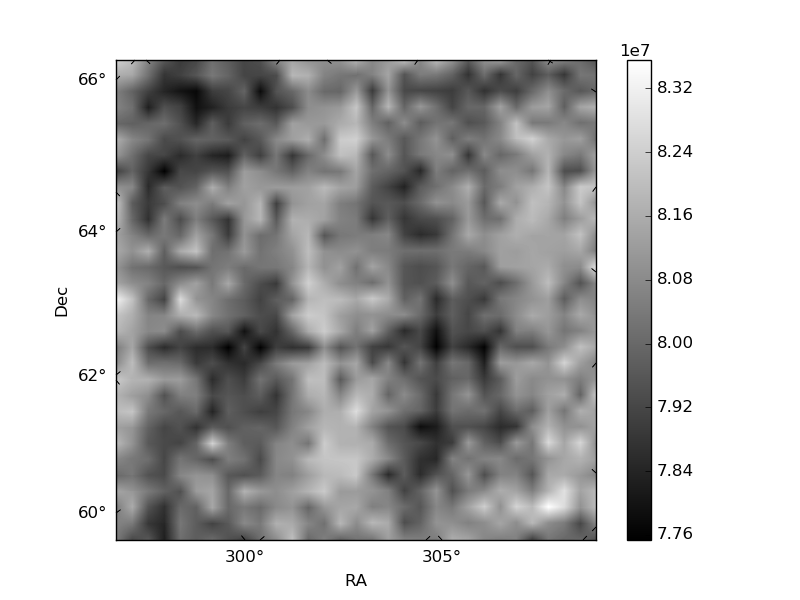
Histogram calculated using DETX and DETY for each event in the final _common_clean file
| Quadrant A | 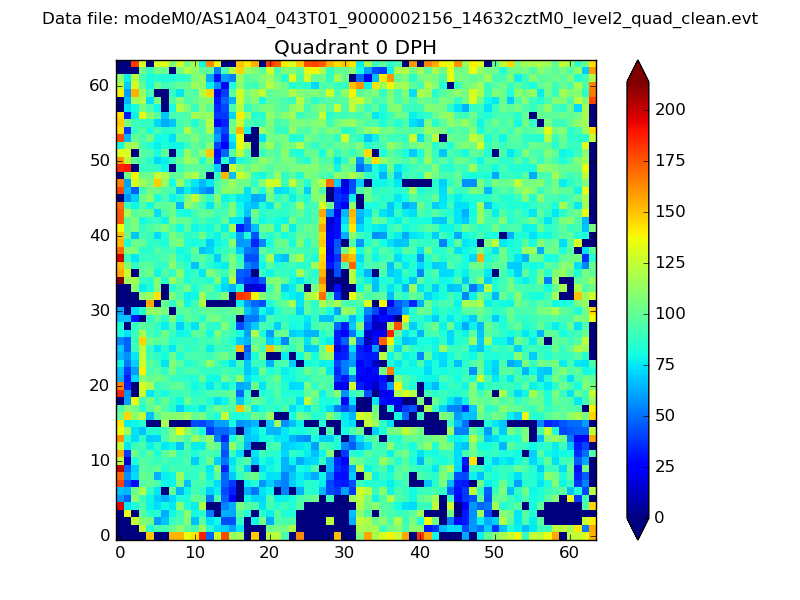 |
 |
Quadrant B |
|---|---|---|---|
| Quadrant D | 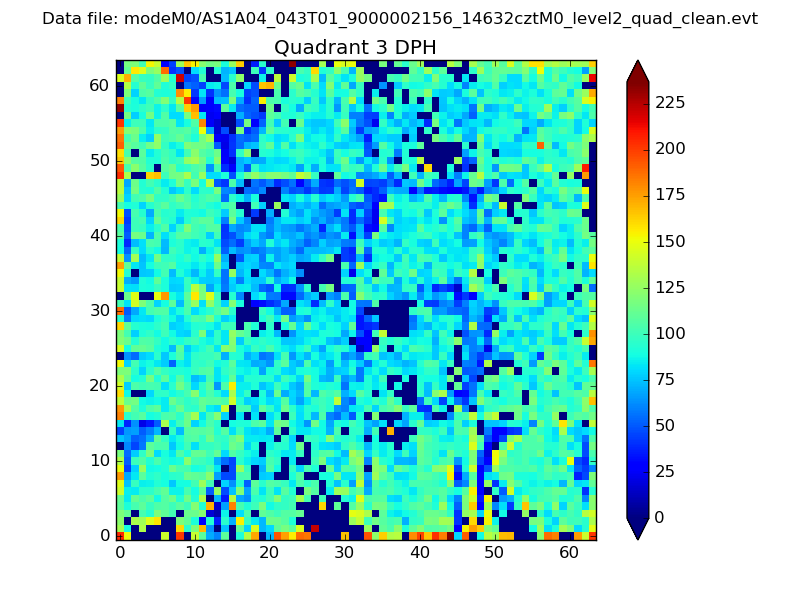 |
 |
Quadrant C |
| Plot type | Count rate plots | Images |
|---|---|---|
| Comparison with Poisson distribution Blue bars denote a histogram of data divided into 1 sec bins. Red curve is a Poisson curve with rate = median count rate of data. |
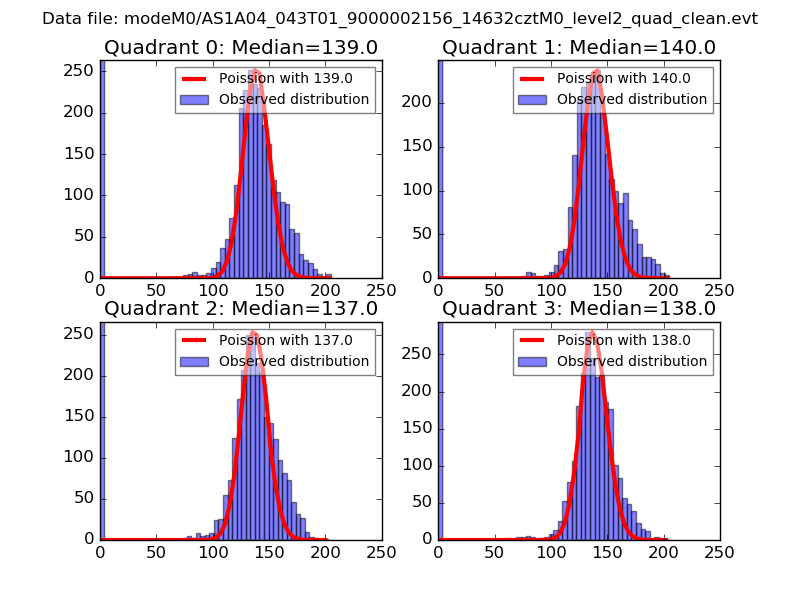 |
 |
| Quadrant-wise count rates Data is divided into 100 sec bins |
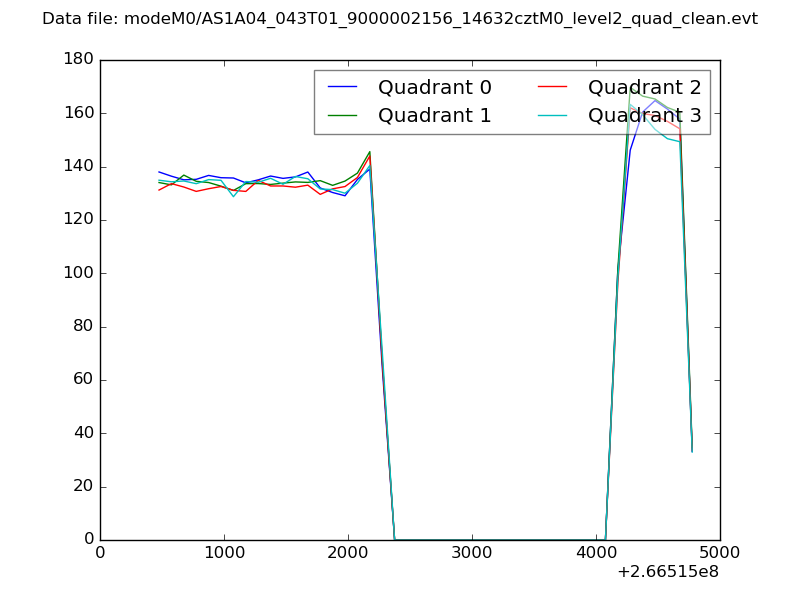 |
|
| Module-wise count rates for Quadrant A Data is divided into 100 sec bins |
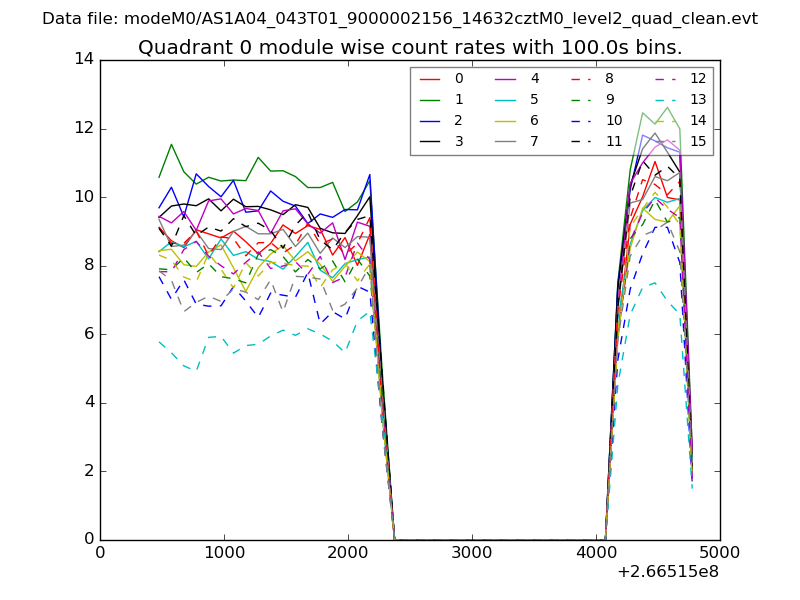 |
 |
| Module-wise count rates for Quadrant B Data is divided into 100 sec bins |
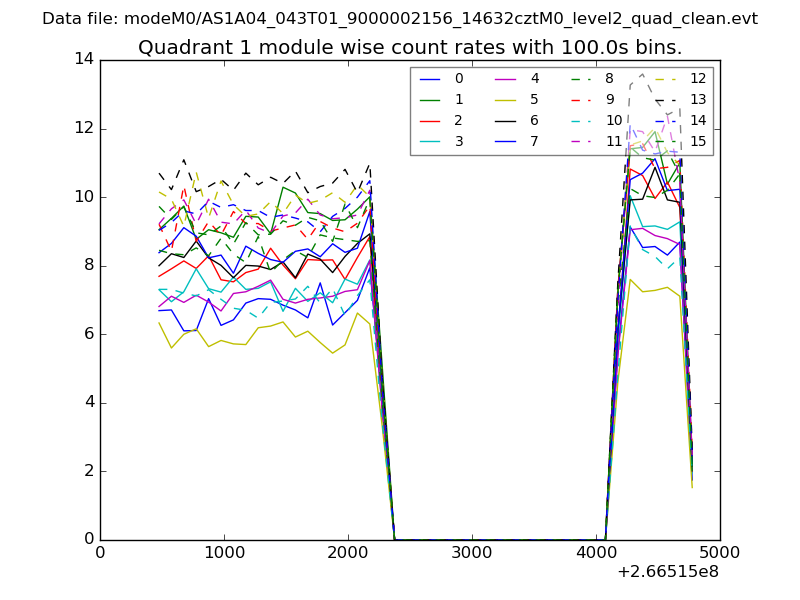 |
 |
| Module-wise count rates for Quadrant C Data is divided into 100 sec bins |
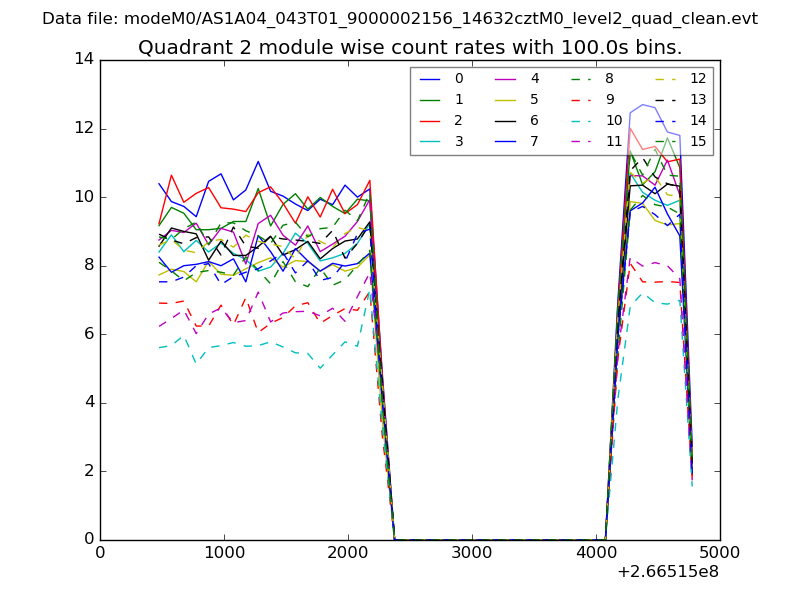 |
 |
| Module-wise count rates for Quadrant D Data is divided into 100 sec bins |
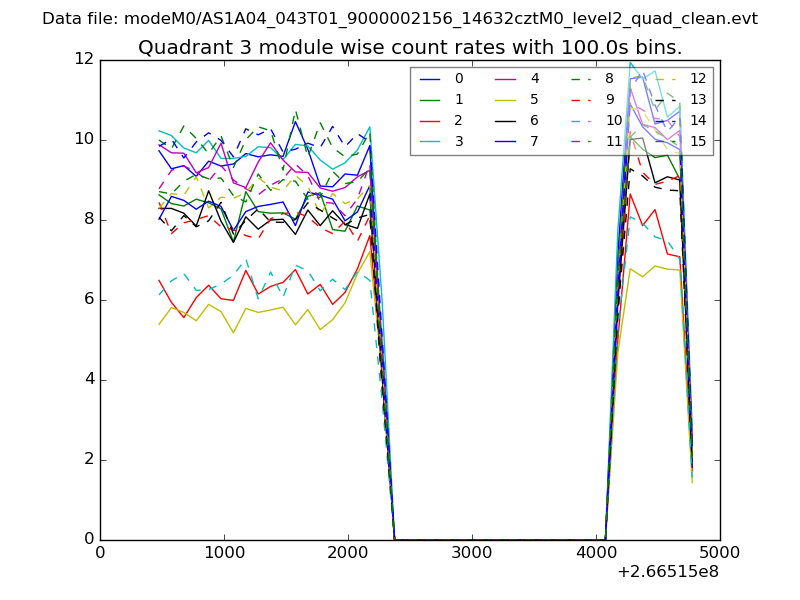 |
 |
| Parameter | Plot |
|---|---|
| CZT HV Monitor | 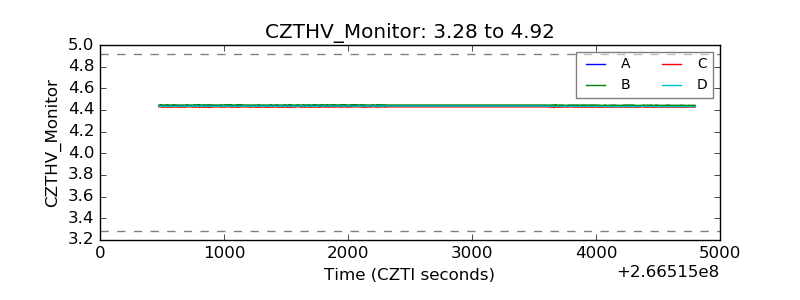 |
| D_VDD | 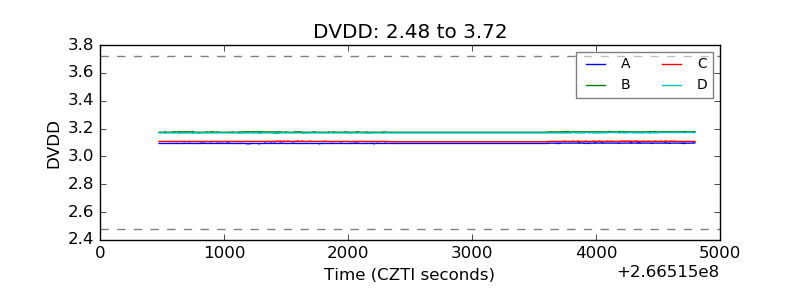 |
| Temperature 1 | 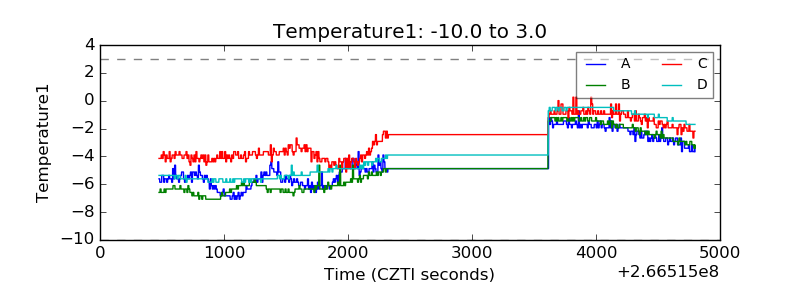 |
| Veto HV Monitor | 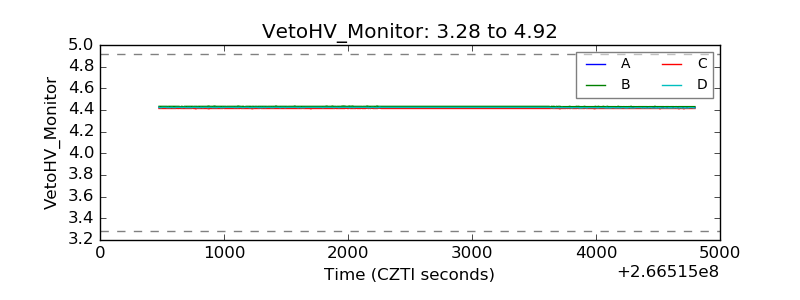 |
| Veto LLD | 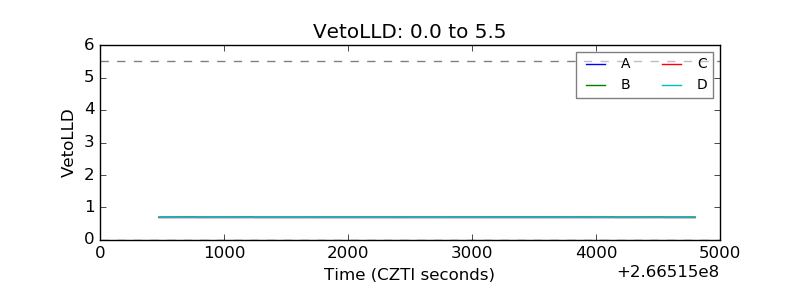 |
| Alpha Counter | 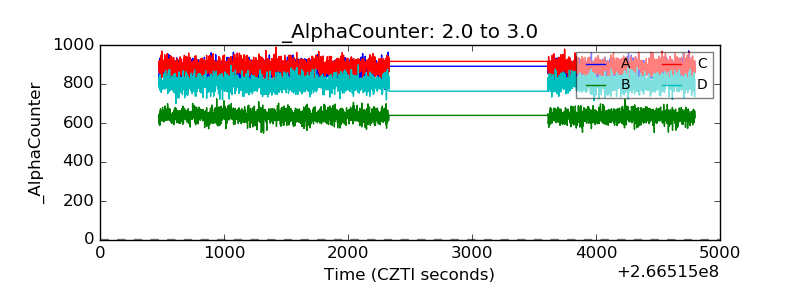 |
| _CPM_Rate | 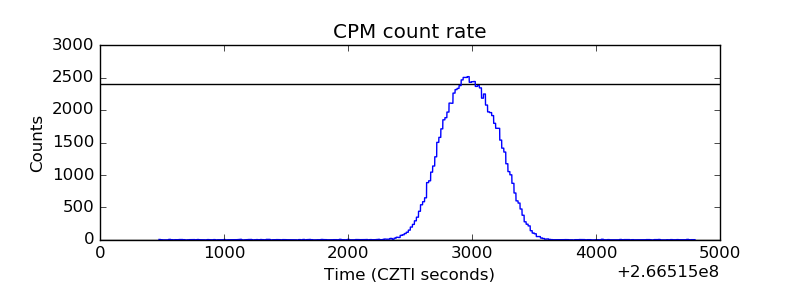 |
| CZT Counter | 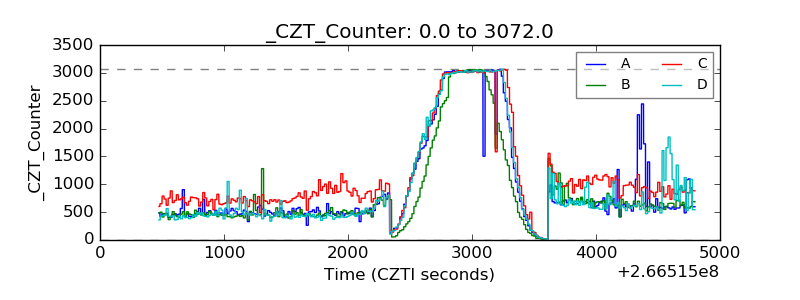 |
| +2.5 Volts monitor |  |
| +5 Volts monitor |  |
| _ROLL_ROT | 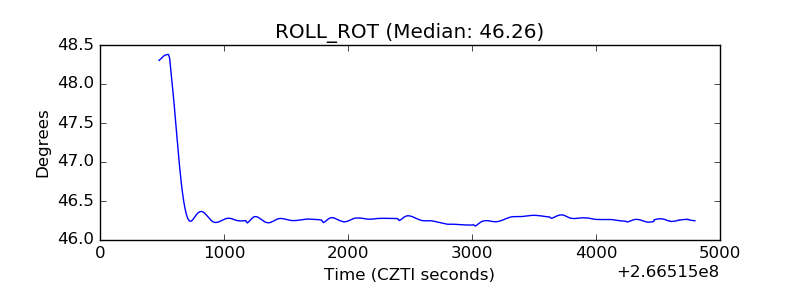 |
| _Roll_DEC | 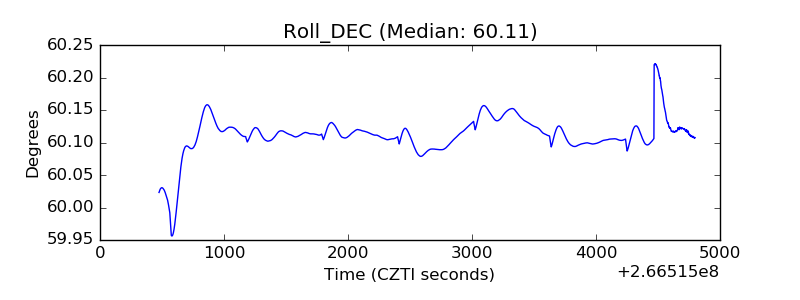 |
| _Roll_RA |  |
| Veto Counter | 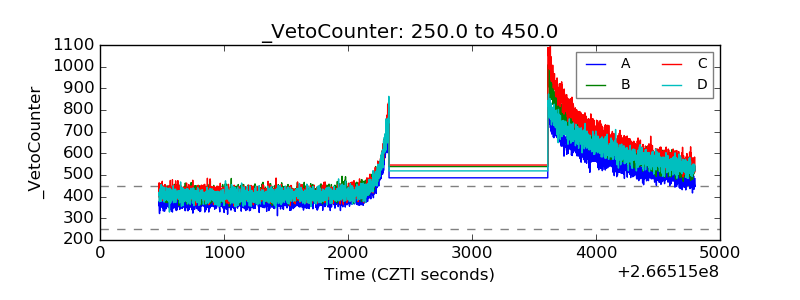 |