| Param | Original file | Final file |
|---|---|---|
| Filename | modeM0/AS1A04_043T01_9000002156_14633cztM0_level2.evt | modeM0/AS1A04_043T01_9000002156_14633cztM0_level2_quad_clean.evt |
| Size (bytes) | 609,304,320 | 110,427,840 |
| Size | 581.1 MB | 105.3 MB |
| Events in quadrant A | 3,657,547 | 742,884 |
| Events in quadrant B | 3,678,311 | 746,527 |
| Events in quadrant C | 5,404,542 | 731,543 |
| Events in quadrant D | 5,298,272 | 695,514 |
| Mode M9 | |||
|---|---|---|---|
| Quadrant | BADHDUFLAG | Total packets | Discarded packets |
| A | 0 | 24 | 0 |
| B | 0 | 24 | 0 |
| C | 0 | 24 | 0 |
| D | 0 | 25 | 0 |
| Mode M0 | |||
|---|---|---|---|
| Quadrant | BADHDUFLAG | Total packets | Discarded packets |
| A | 0 | 15045 | 3 |
| B | 0 | 15214 | 2 |
| C | 0 | 20612 | 2 |
| D | 0 | 19964 | 2 |
| Mode SS | |||
|---|---|---|---|
| Quadrant | BADHDUFLAG | Total packets | Discarded packets |
| A | 0 | 124 | 0 |
| B | 0 | 124 | 0 |
| C | 0 | 124 | 0 |
| D | 0 | 124 | 0 |
| Quadrant | Total seconds | Saturated seconds | Saturation percentage |
|---|---|---|---|
| A | 6130 | 132 | 2.153344% |
| B | 6130 | 130 | 2.120718% |
| C | 6130 | 135 | 2.202284% |
| D | 6130 | 629 | 10.261011% |
Noise dominated data is calculated using 1-second bins in cleaned event files. If a bin has >2000 counts, and if more than 50% of those come from <1% of pixels, then it is considered to be noise-dominated and hence unusable.
| Quadrant | # 1 sec bins | Bins with >0 counts | Bins with >2000 counts | High rate bins dominated by noise | Noise dominated (total time) | Noise dominated (detector-on time) | Marked lightcurve |
|---|---|---|---|---|---|---|---|
| A | 7456 | 6132 | 58 | 58 | 0.78% | 0.95% | 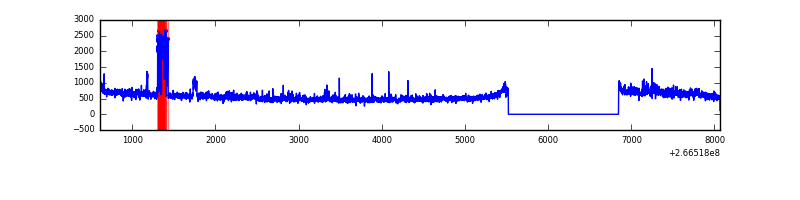 |
| B | 7456 | 6131 | 19 | 19 | 0.25% | 0.31% | 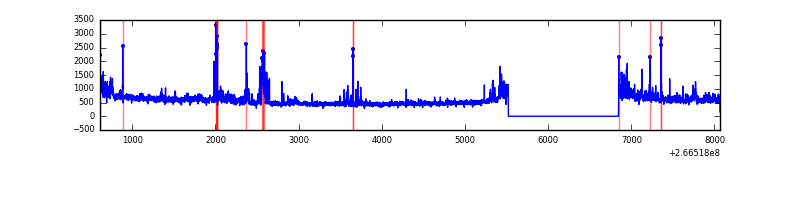 |
| C | 7456 | 6131 | 4 | 4 | 0.05% | 0.07% | 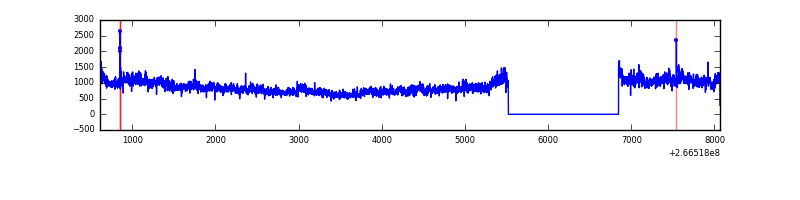 |
| D | 7456 | 6131 | 619 | 619 | 8.30% | 10.10% | 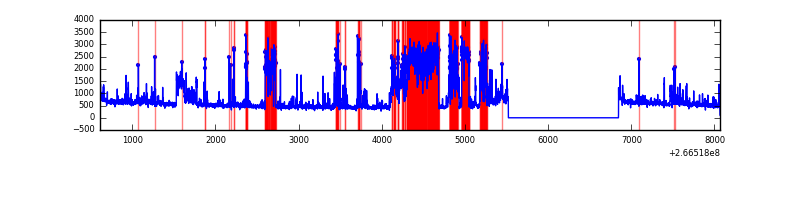 |
Top three noisy pixels from each quadrant. If the there are fewer than three noisy pixels in the level2.evt file, extra rows are filled as -1
| Pixel properties | Quadrant properties | ||||||
|---|---|---|---|---|---|---|---|
| Quadrant | DetID | PixID | Counts | Sigma | Mean | Median | Sigma |
| A | 0 | 23 | 192759 | 1198.53 | 809 | 793 | 160.2 |
| A | 1 | 162 | 106228 | 658.28 | 809 | 793 | 160.2 |
| A | 8 | 15 | 102652 | 635.95 | 809 | 793 | 160.2 |
| B | 0 | 189 | 225729 | 1512.17 | 810 | 790 | 148.8 |
| B | 0 | 228 | 90995 | 606.41 | 810 | 790 | 148.8 |
| B | 0 | 219 | 30799 | 201.74 | 810 | 790 | 148.8 |
| C | 3 | 233 | 2282596 | 12696.13 | 795 | 800 | 179.7 |
| C | 0 | 207 | 10306 | 52.89 | 795 | 800 | 179.7 |
| C | 3 | 234 | 9328 | 47.45 | 795 | 800 | 179.7 |
| D | 13 | 122 | 1209988 | 6483.51 | 777 | 760 | 186.5 |
| D | 12 | 110 | 379439 | 2030.36 | 777 | 760 | 186.5 |
| D | 10 | 70 | 329881 | 1764.65 | 777 | 760 | 186.5 |
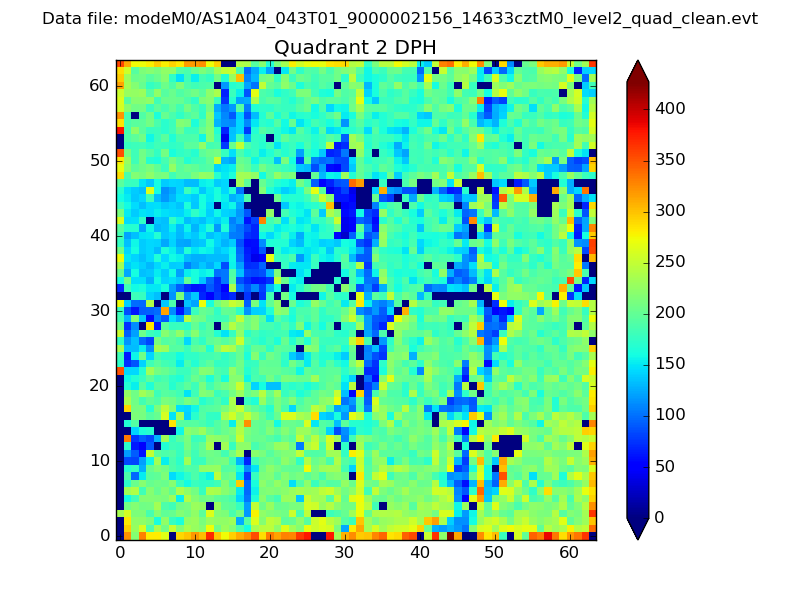
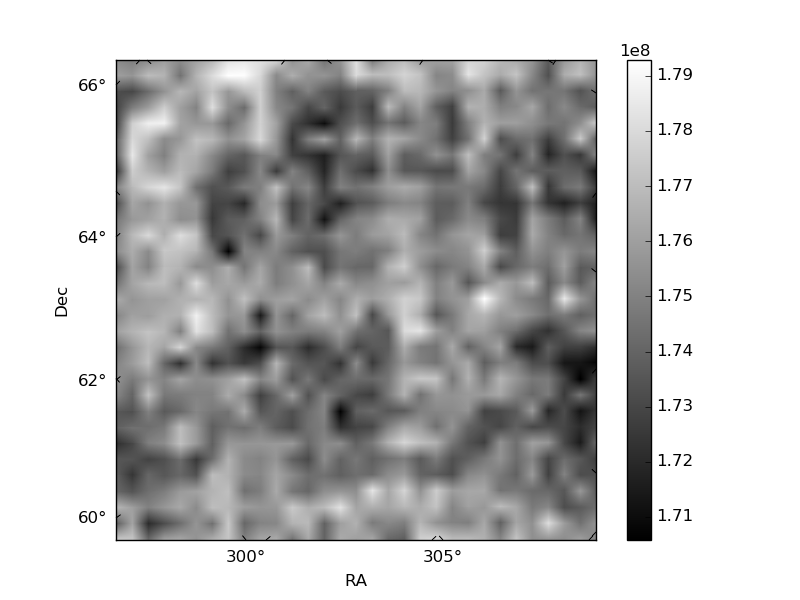
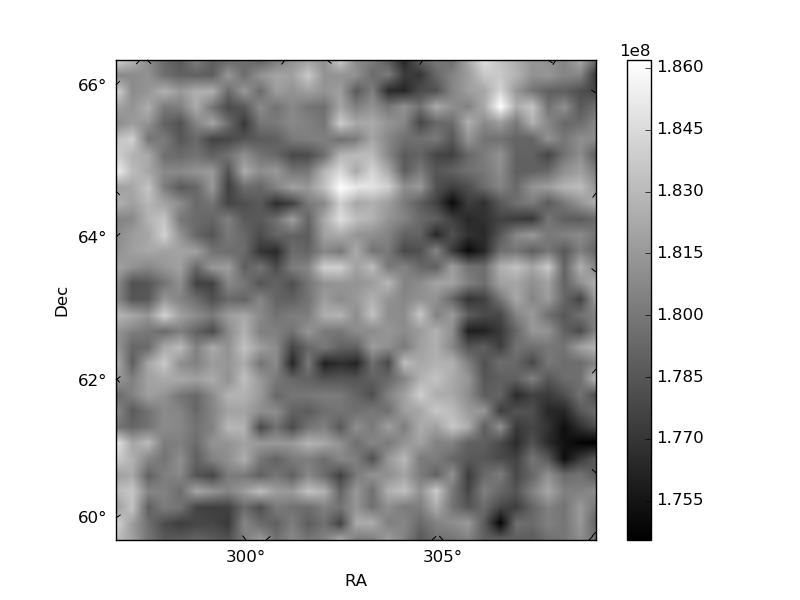
Histogram calculated using DETX and DETY for each event in the final _common_clean file
| Quadrant A | 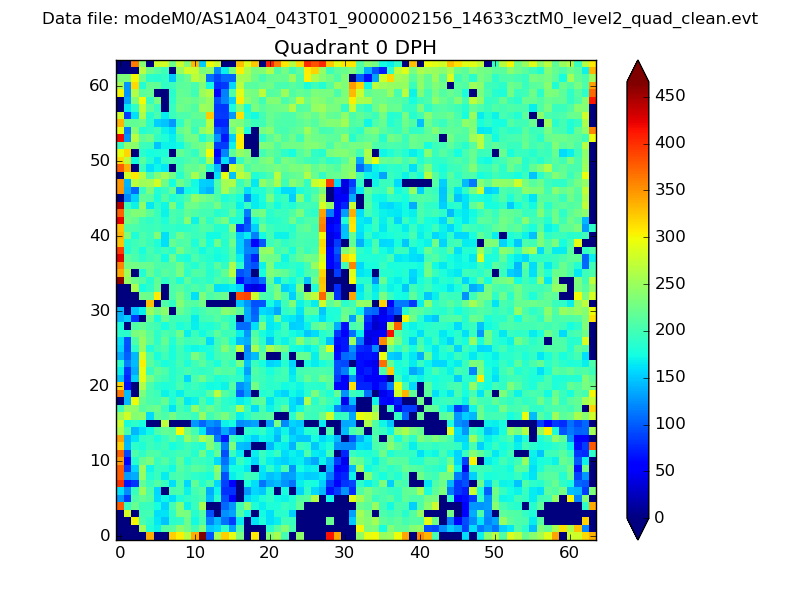 |
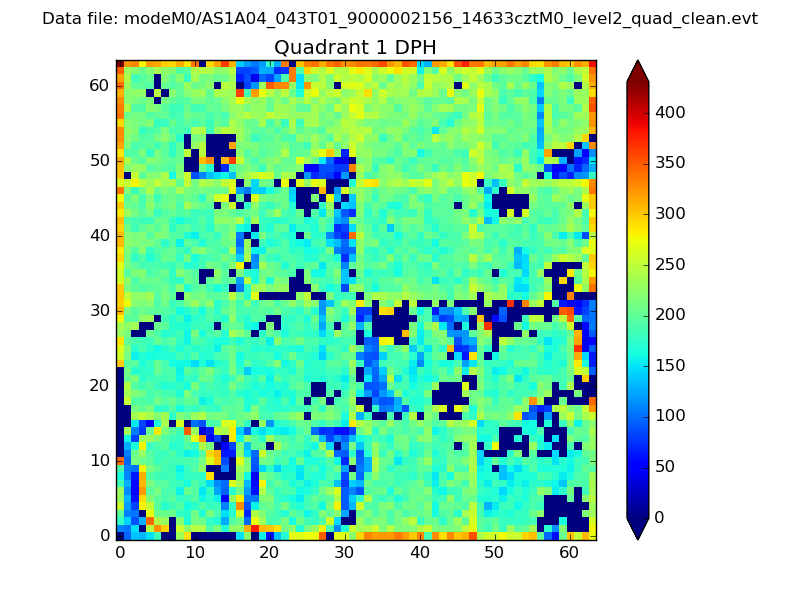 |
Quadrant B |
|---|---|---|---|
| Quadrant D | 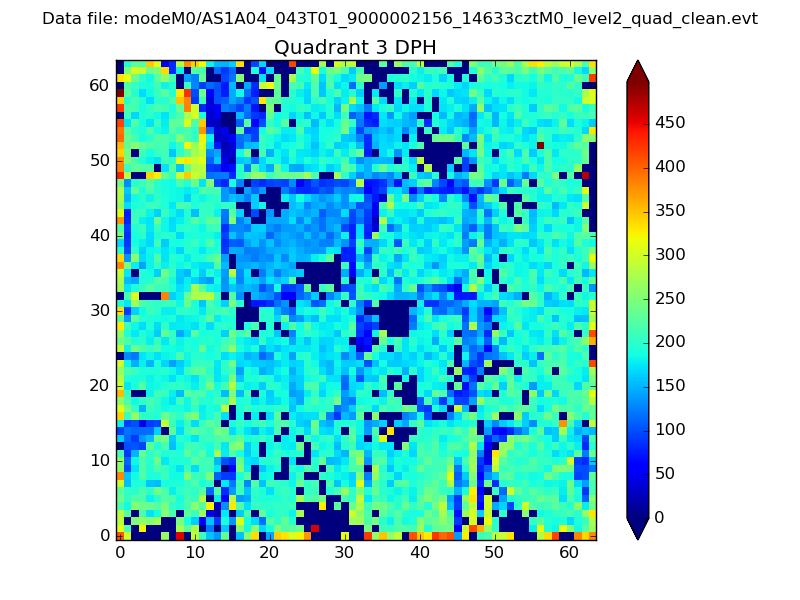 |
 |
Quadrant C |
| Plot type | Count rate plots | Images |
|---|---|---|
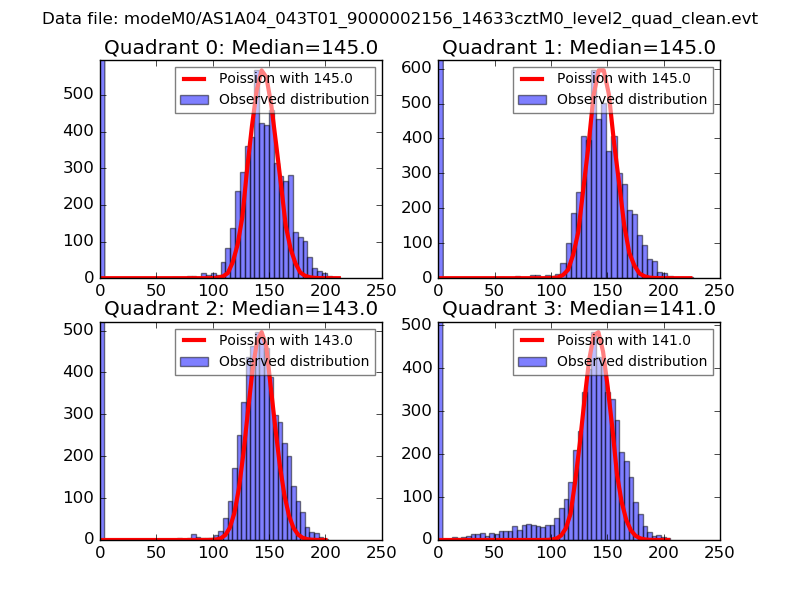
| Comparison with Poisson distribution Blue bars denote a histogram of data divided into 1 sec bins. Red curve is a Poisson curve with rate = median count rate of data. |
 |
 |
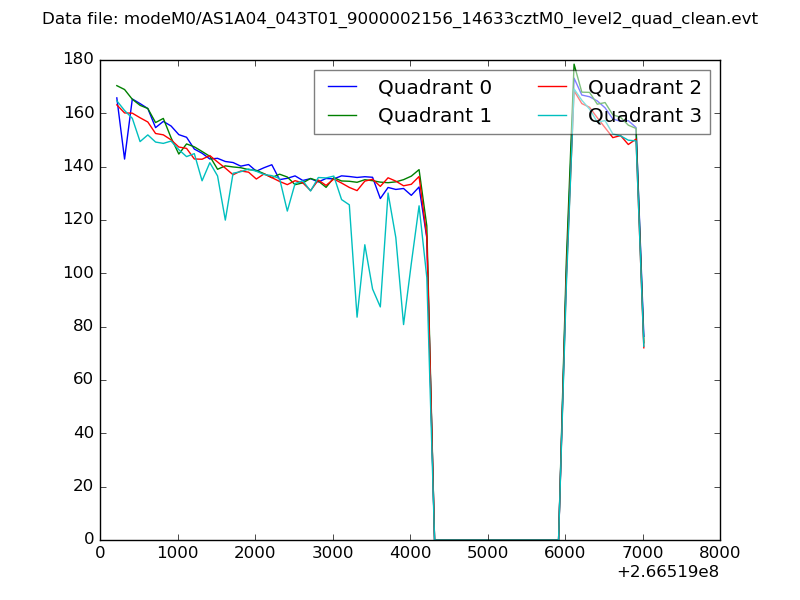
| Quadrant-wise count rates Data is divided into 100 sec bins |
 |
|
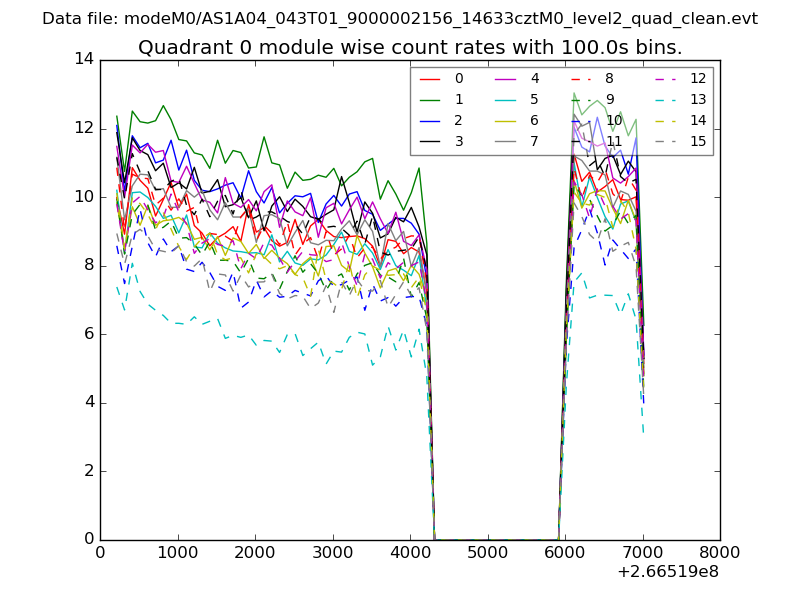
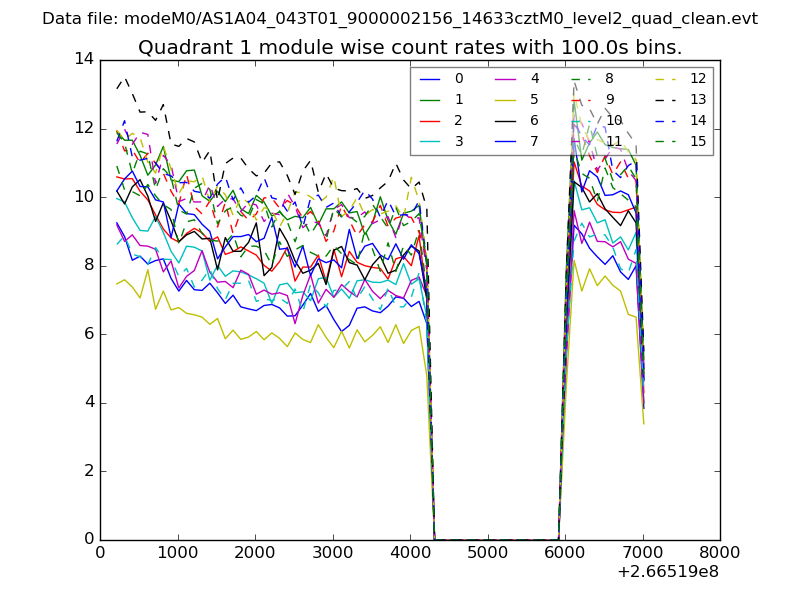
| Module-wise count rates for Quadrant A Data is divided into 100 sec bins |
 |
 |
| Module-wise count rates for Quadrant B Data is divided into 100 sec bins |
 |
 |
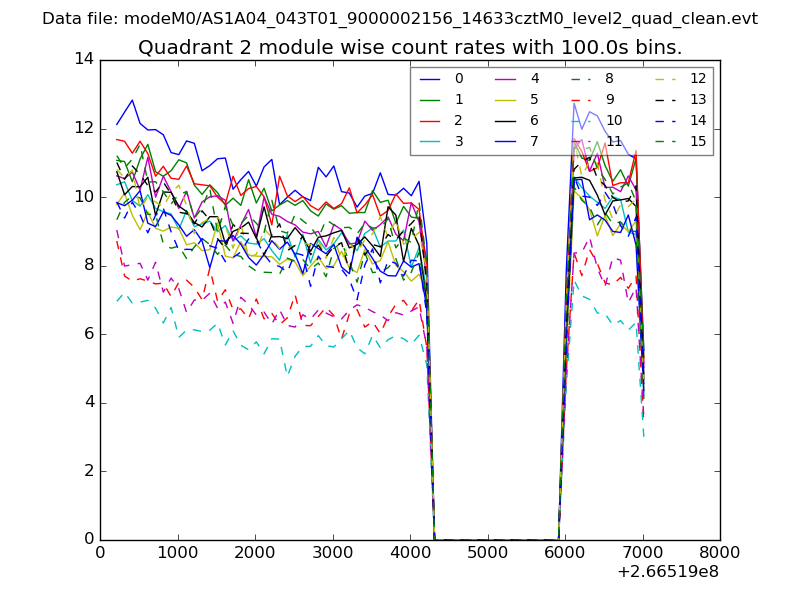
| Module-wise count rates for Quadrant C Data is divided into 100 sec bins |
 |
 |
| Module-wise count rates for Quadrant D Data is divided into 100 sec bins |
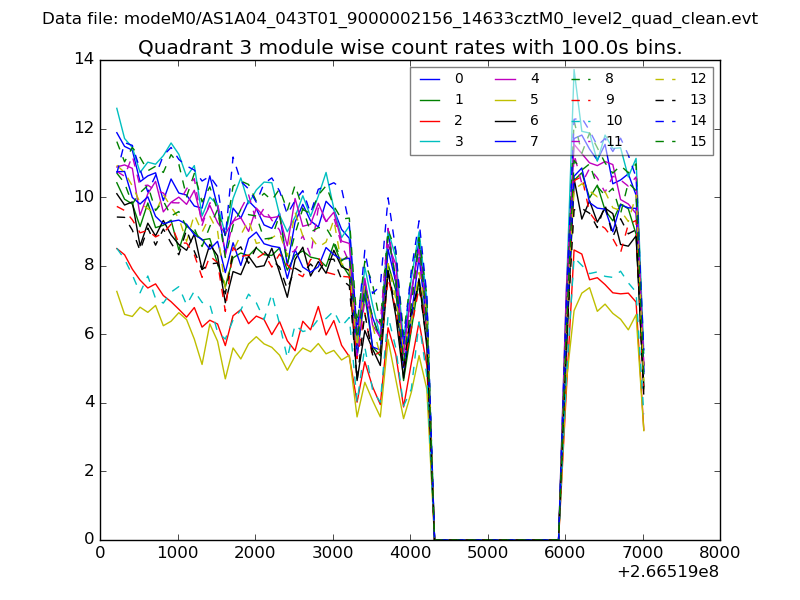 |
 |
| Parameter | Plot |
|---|---|
| CZT HV Monitor | 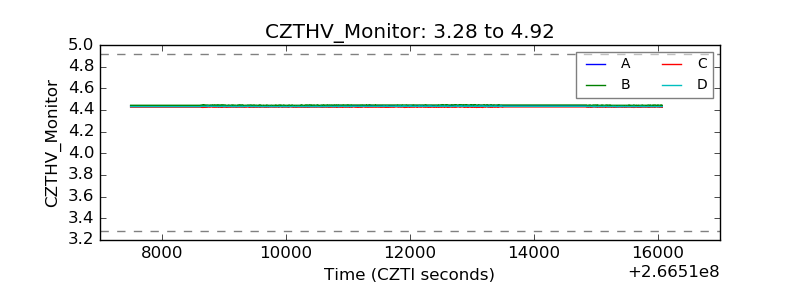 |
| D_VDD | 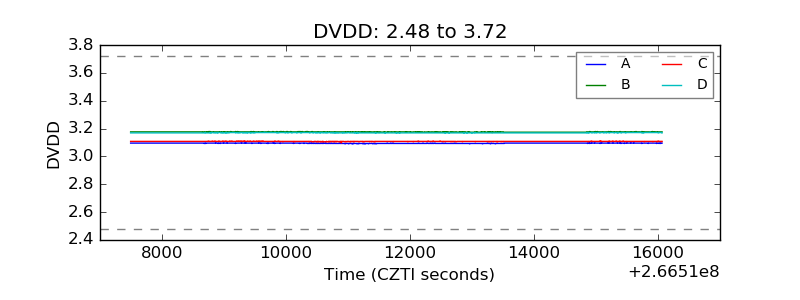 |
| Temperature 1 | 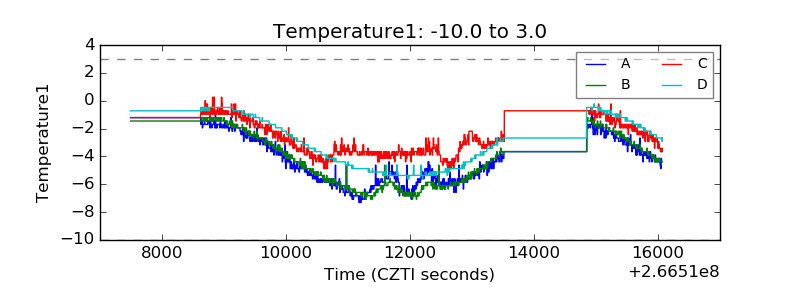 |
| Veto HV Monitor |  |
| Veto LLD | 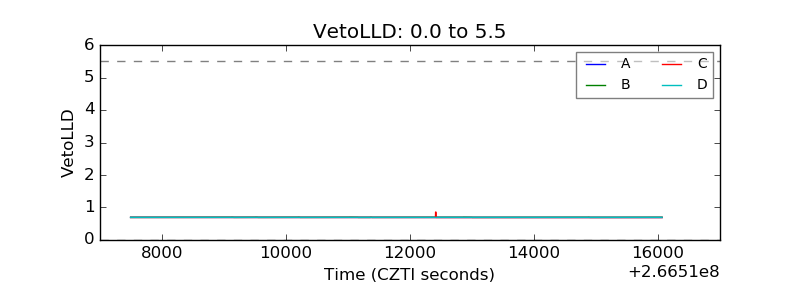 |
| Alpha Counter | 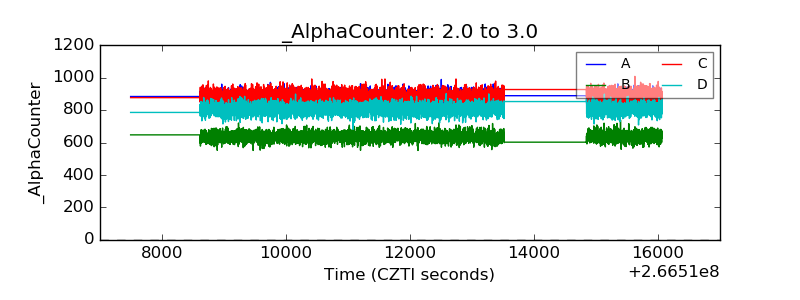 |
| _CPM_Rate | 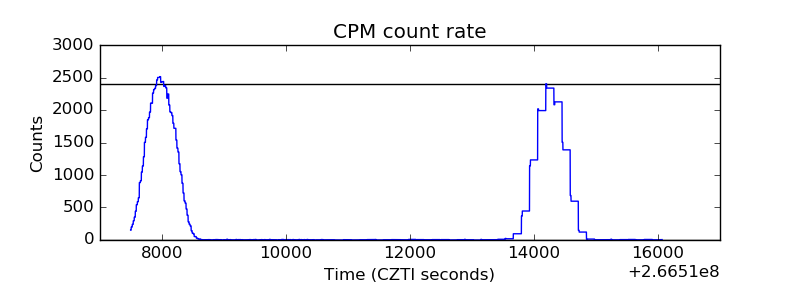 |
| CZT Counter | 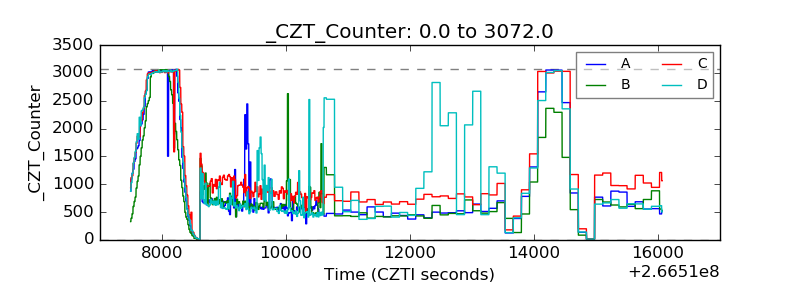 |
| +2.5 Volts monitor |  |
| +5 Volts monitor |  |
| _ROLL_ROT | 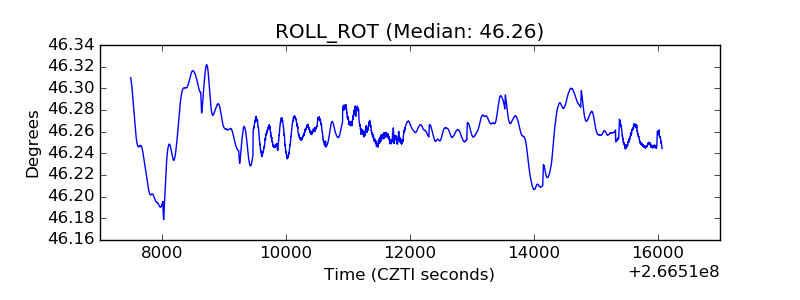 |
| _Roll_DEC | 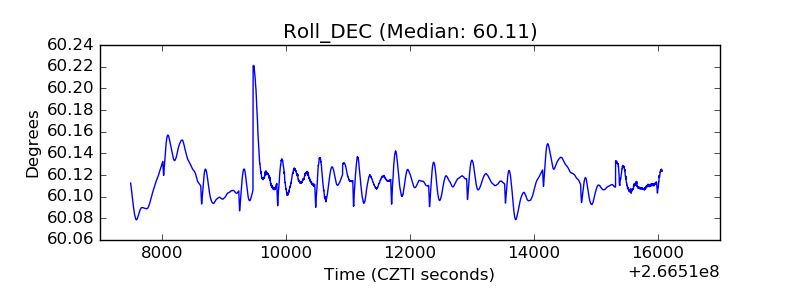 |
| _Roll_RA | 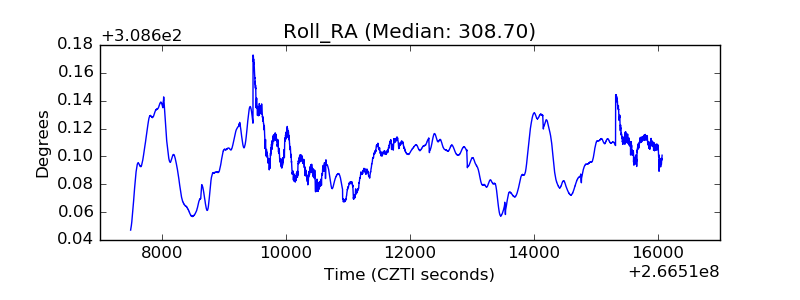 |
| Veto Counter | 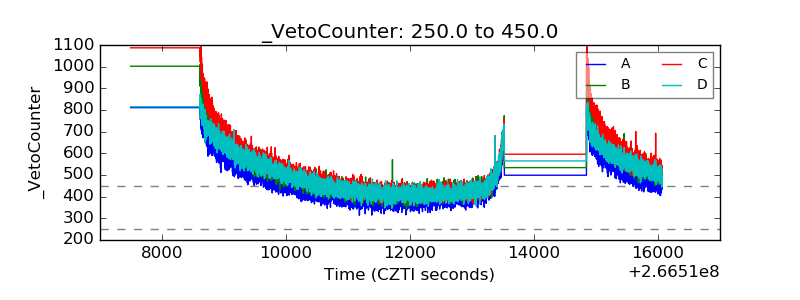 |