| Param | Original file | Final file |
|---|---|---|
| Filename | modeM0/AS1A04_043T01_9000002156_14634cztM0_level2.evt | modeM0/AS1A04_043T01_9000002156_14634cztM0_level2_quad_clean.evt |
| Size (bytes) | 607,662,720 | 114,606,720 |
| Size | 579.5 MB | 109.3 MB |
| Events in quadrant A | 3,641,909 | 770,121 |
| Events in quadrant B | 3,683,877 | 773,357 |
| Events in quadrant C | 6,214,396 | 753,604 |
| Events in quadrant D | 4,431,670 | 728,853 |
| Mode M9 | |||
|---|---|---|---|
| Quadrant | BADHDUFLAG | Total packets | Discarded packets |
| A | 0 | 27 | 0 |
| B | 0 | 27 | 0 |
| C | 0 | 27 | 0 |
| D | 0 | 27 | 0 |
| Mode M0 | |||
|---|---|---|---|
| Quadrant | BADHDUFLAG | Total packets | Discarded packets |
| A | 0 | 15124 | 3 |
| B | 0 | 15257 | 2 |
| C | 0 | 22976 | 2 |
| D | 0 | 17649 | 2 |
| Mode SS | |||
|---|---|---|---|
| Quadrant | BADHDUFLAG | Total packets | Discarded packets |
| A | 0 | 130 | 0 |
| B | 0 | 130 | 0 |
| C | 0 | 130 | 0 |
| D | 0 | 130 | 0 |
| Quadrant | Total seconds | Saturated seconds | Saturation percentage |
|---|---|---|---|
| A | 6381 | 108 | 1.692525% |
| B | 6381 | 174 | 2.726845% |
| C | 6381 | 229 | 3.588779% |
| D | 6381 | 669 | 10.484250% |
Noise dominated data is calculated using 1-second bins in cleaned event files. If a bin has >2000 counts, and if more than 50% of those come from <1% of pixels, then it is considered to be noise-dominated and hence unusable.
| Quadrant | # 1 sec bins | Bins with >0 counts | Bins with >2000 counts | High rate bins dominated by noise | Noise dominated (total time) | Noise dominated (detector-on time) | Marked lightcurve |
|---|---|---|---|---|---|---|---|
| A | 9032 | 6384 | 4 | 4 | 0.04% | 0.06% | 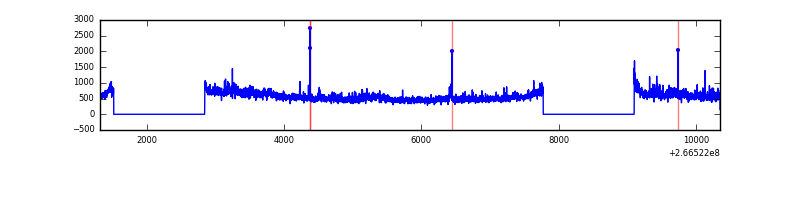 |
| B | 9032 | 6383 | 17 | 17 | 0.19% | 0.27% | 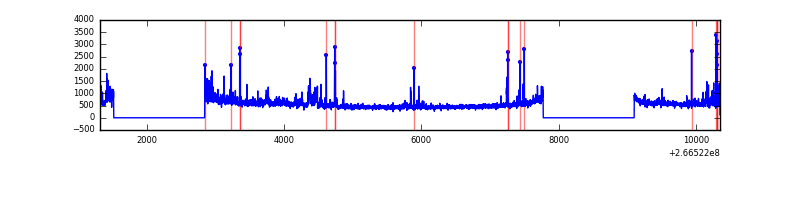 |
| C | 9032 | 6383 | 6 | 6 | 0.07% | 0.09% | 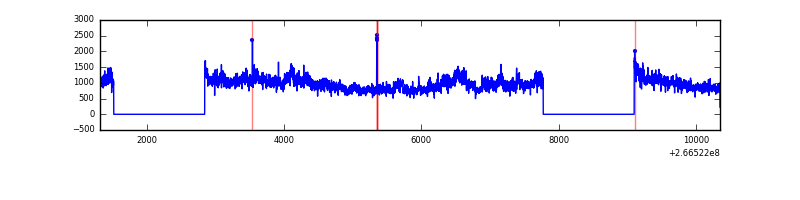 |
| D | 9031 | 6382 | 87 | 87 | 0.96% | 1.36% | 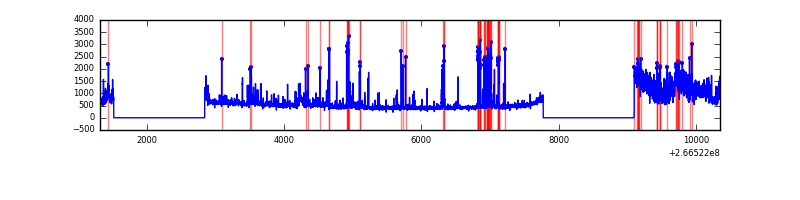 |
Top three noisy pixels from each quadrant. If the there are fewer than three noisy pixels in the level2.evt file, extra rows are filled as -1
| Pixel properties | Quadrant properties | ||||||
|---|---|---|---|---|---|---|---|
| Quadrant | DetID | PixID | Counts | Sigma | Mean | Median | Sigma |
| A | 8 | 15 | 123609 | 744.14 | 824 | 807 | 165.0 |
| A | 1 | 162 | 117340 | 706.15 | 824 | 807 | 165.0 |
| A | 0 | 23 | 54973 | 328.23 | 824 | 807 | 165.0 |
| B | 0 | 189 | 163469 | 1066.56 | 825 | 805 | 152.5 |
| B | 0 | 230 | 114525 | 745.64 | 825 | 805 | 152.5 |
| B | 0 | 229 | 35147 | 225.17 | 825 | 805 | 152.5 |
| C | 3 | 233 | 3037077 | 16565.41 | 807 | 814 | 183.3 |
| C | 3 | 234 | 12091 | 61.53 | 807 | 814 | 183.3 |
| C | 14 | 234 | 9958 | 49.89 | 807 | 814 | 183.3 |
| D | 13 | 122 | 811932 | 4058.69 | 791 | 773 | 199.9 |
| D | 10 | 199 | 203095 | 1012.33 | 791 | 773 | 199.9 |
| D | 12 | 110 | 106194 | 527.48 | 791 | 773 | 199.9 |
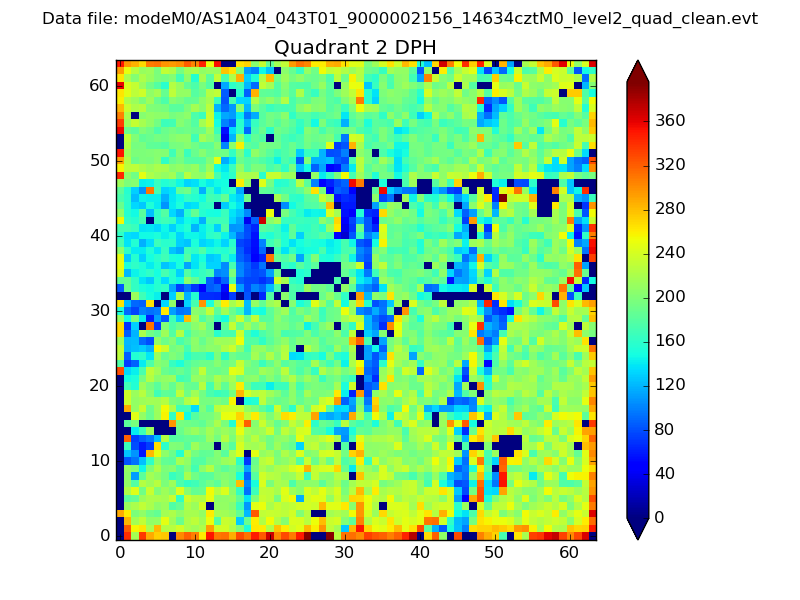
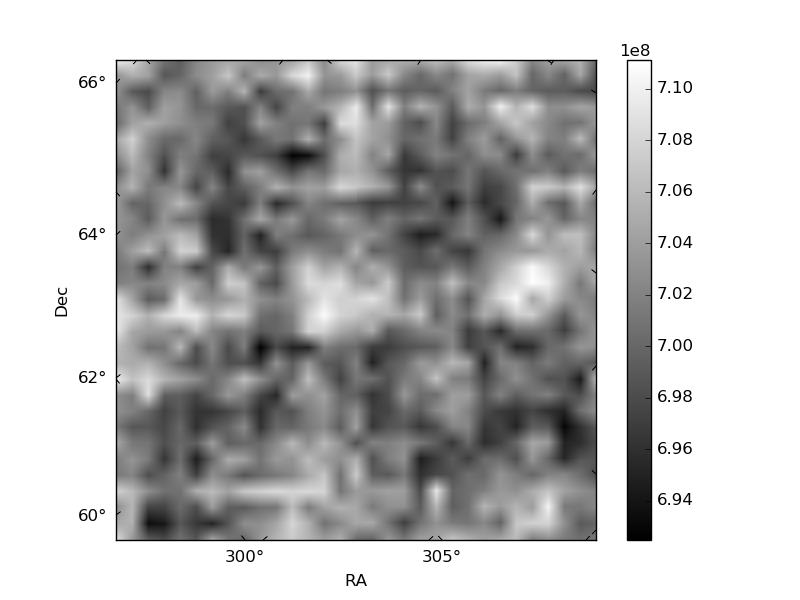
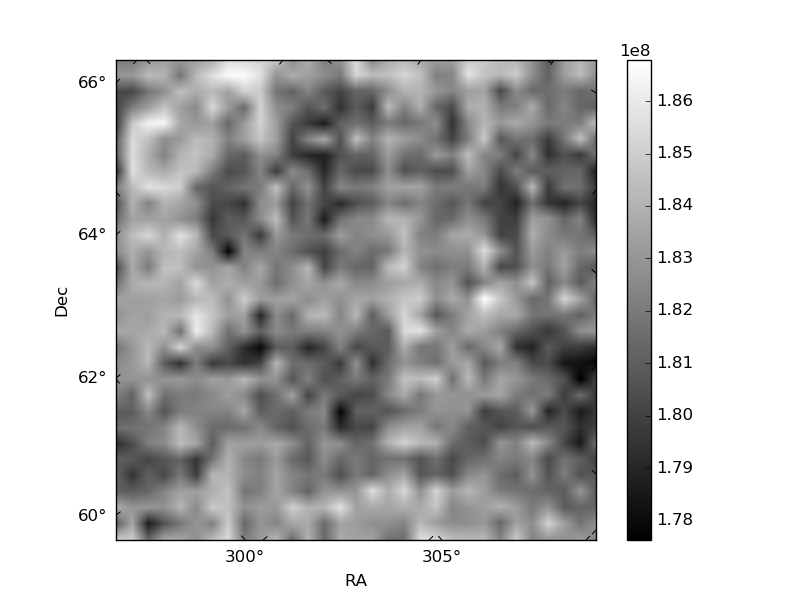
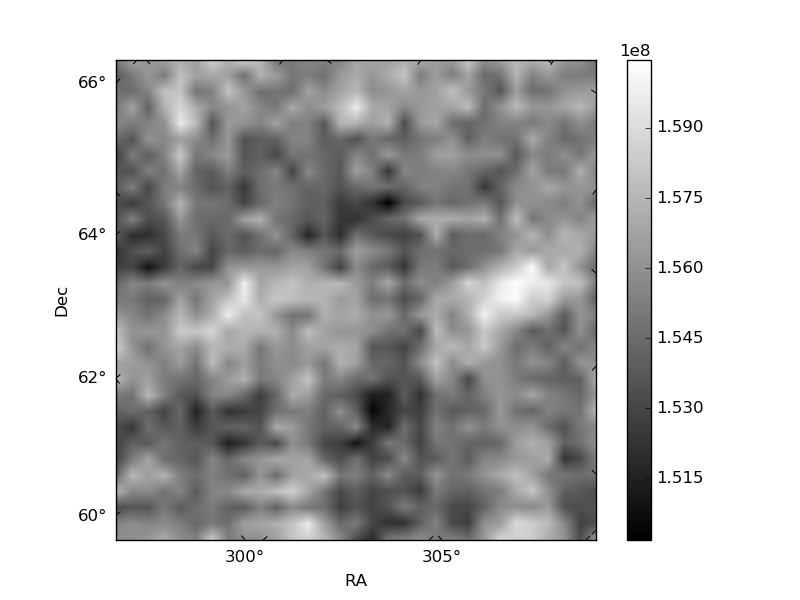
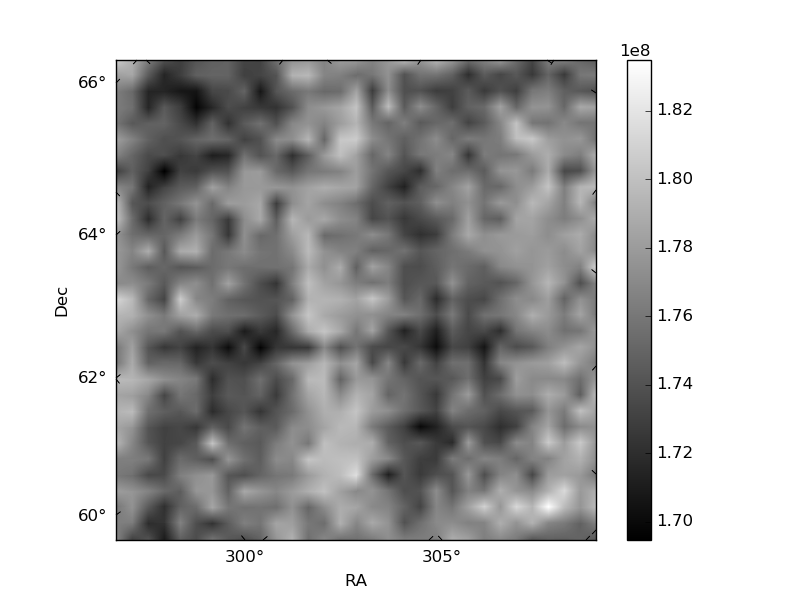
Histogram calculated using DETX and DETY for each event in the final _common_clean file
| Quadrant A | 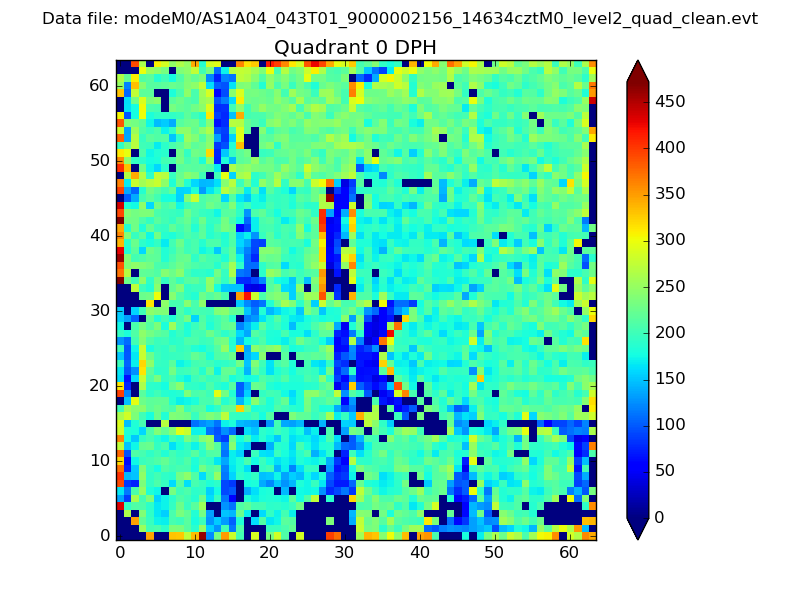 |
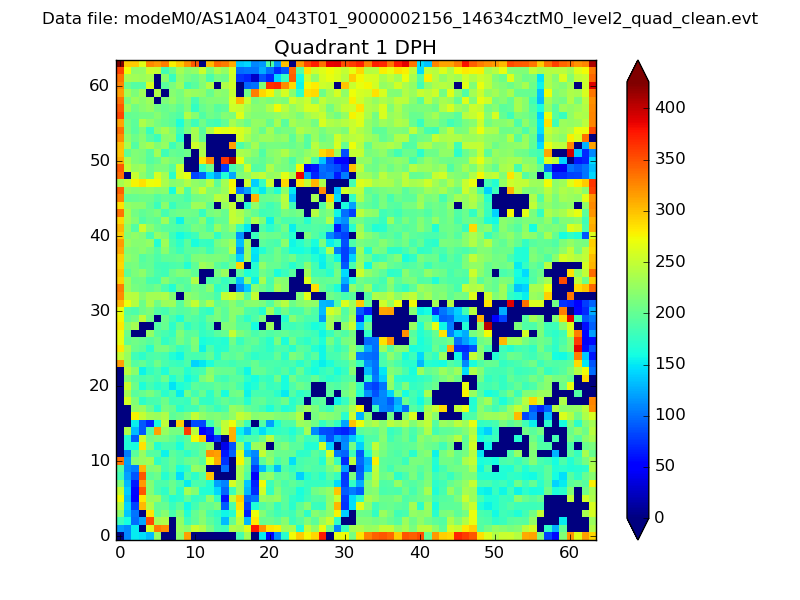 |
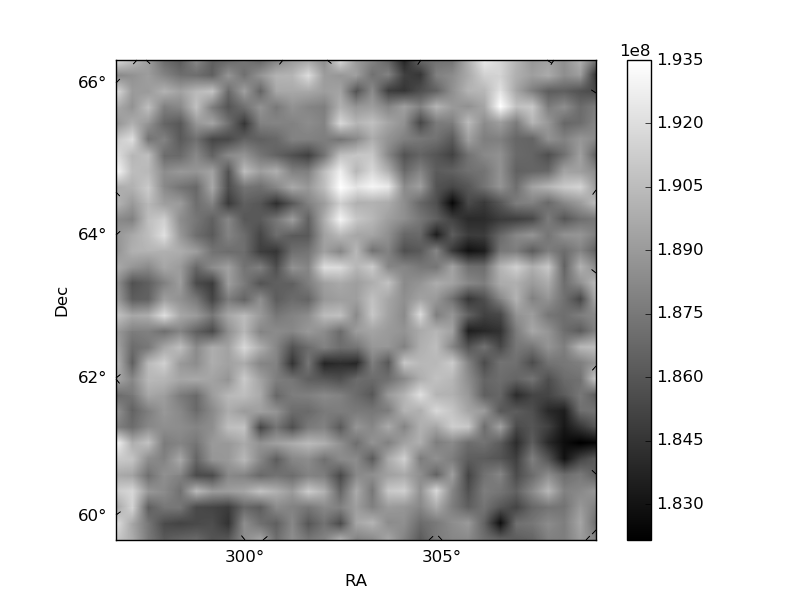
Quadrant B |
|---|---|---|---|
| Quadrant D | 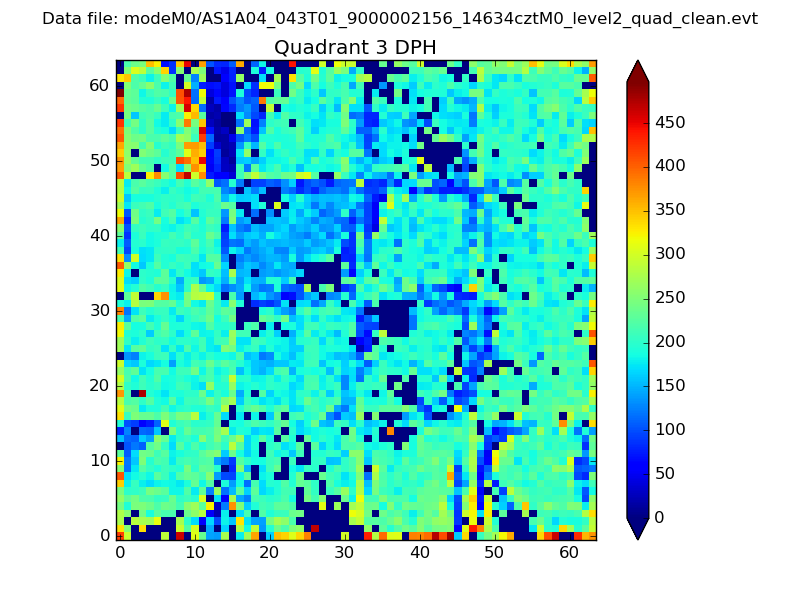 |
 |
Quadrant C |
| Plot type | Count rate plots | Images |
|---|---|---|
| Comparison with Poisson distribution Blue bars denote a histogram of data divided into 1 sec bins. Red curve is a Poisson curve with rate = median count rate of data. |
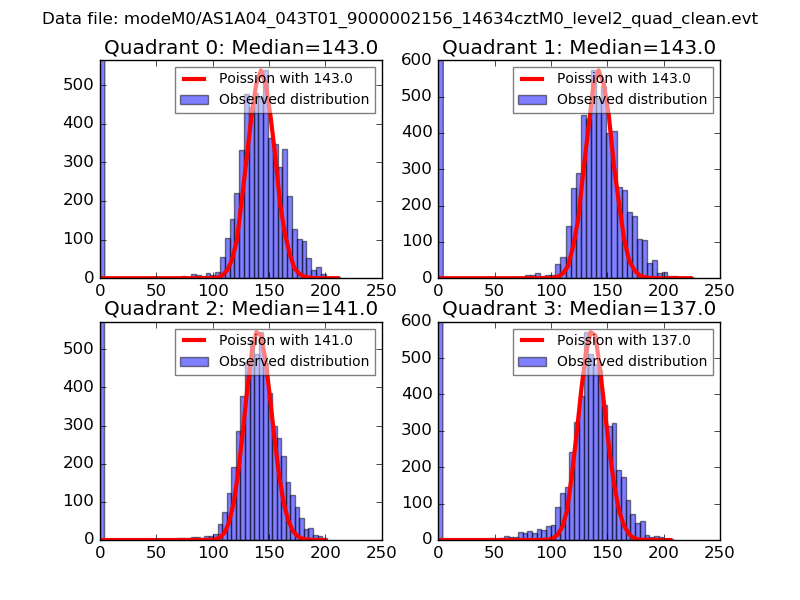 |
 |
| Quadrant-wise count rates Data is divided into 100 sec bins |
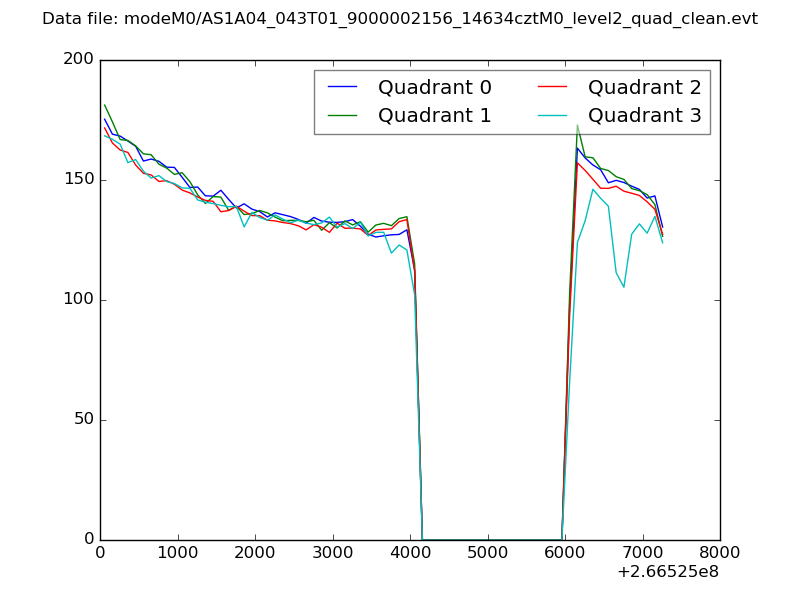 |
|
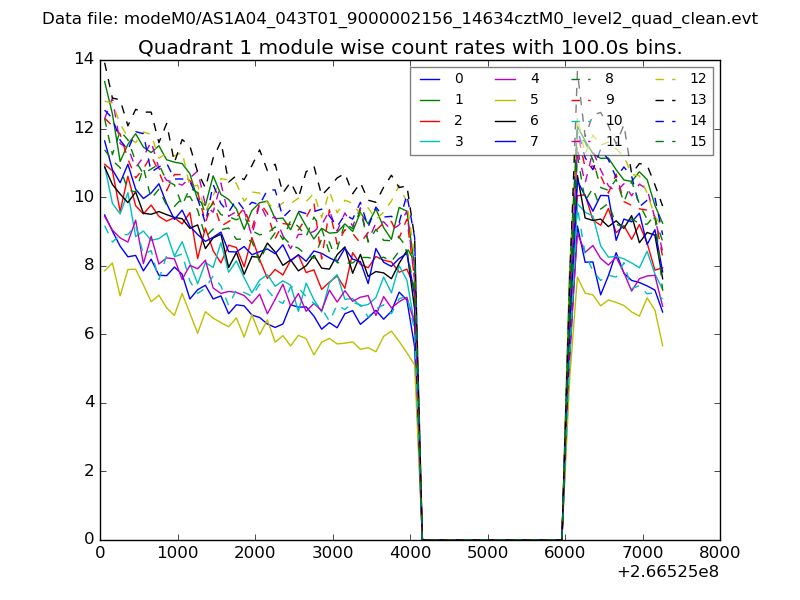
| Module-wise count rates for Quadrant A Data is divided into 100 sec bins |
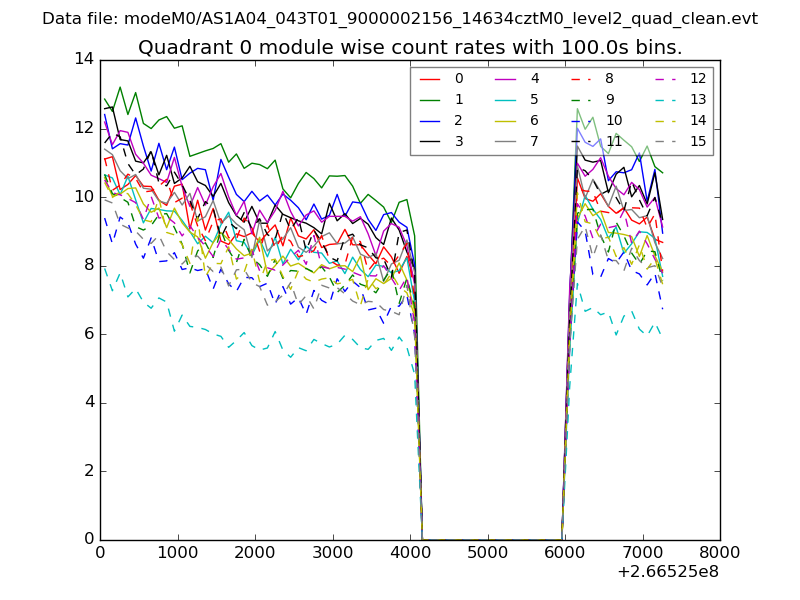 |
 |
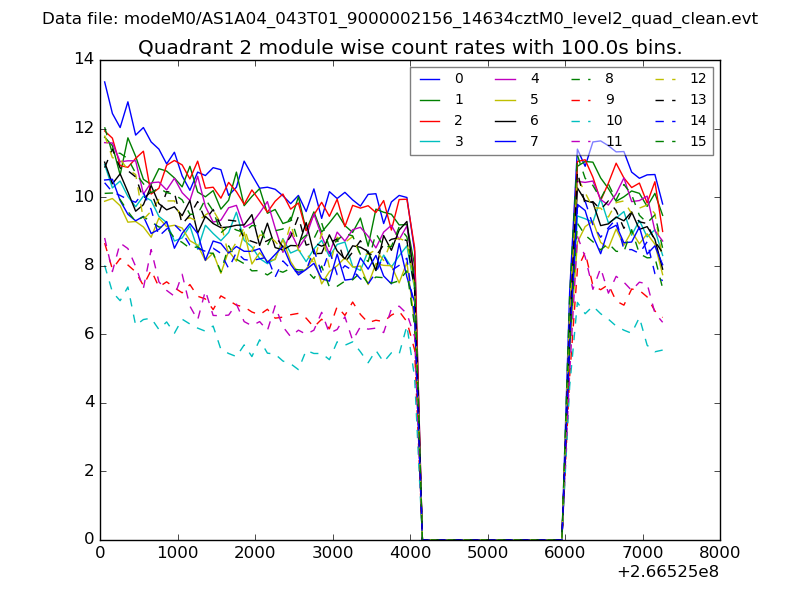
| Module-wise count rates for Quadrant B Data is divided into 100 sec bins |
 |
 |
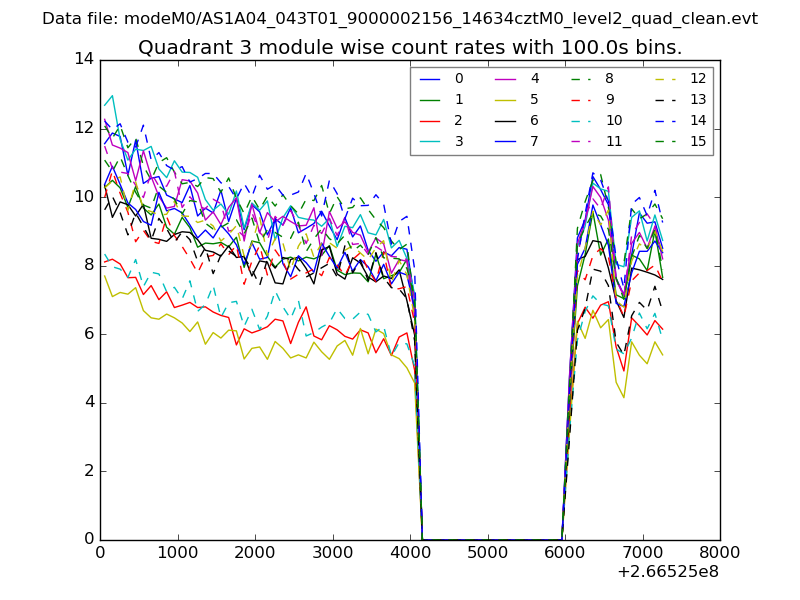
| Module-wise count rates for Quadrant C Data is divided into 100 sec bins |
 |
 |
| Module-wise count rates for Quadrant D Data is divided into 100 sec bins |
 |
 |
| Parameter | Plot |
|---|---|
| CZT HV Monitor | 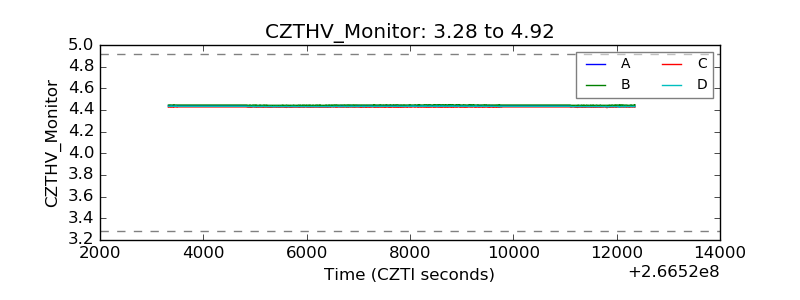 |
| D_VDD | 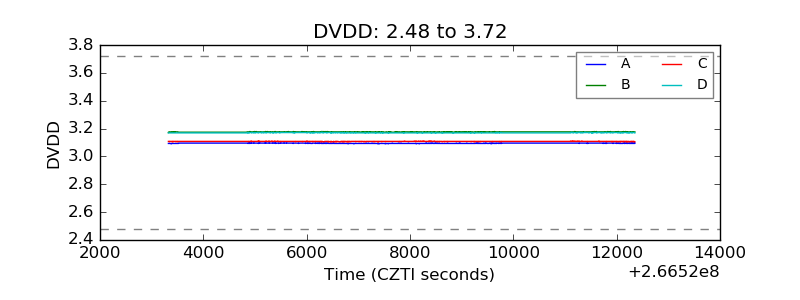 |
| Temperature 1 |  |
| Veto HV Monitor | 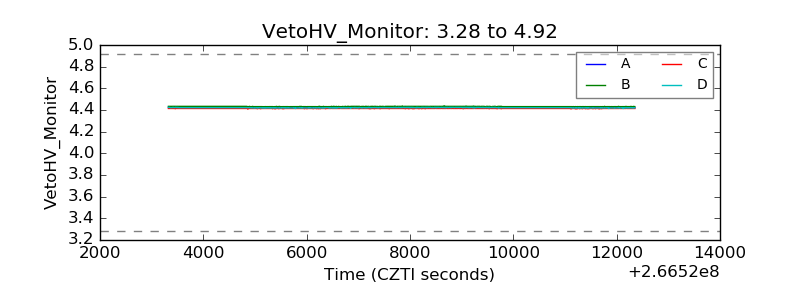 |
| Veto LLD | 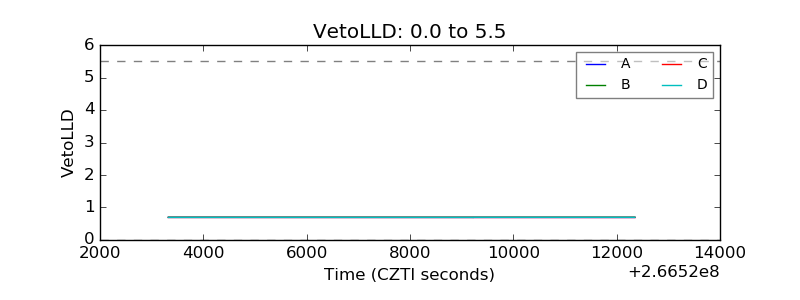 |
| Alpha Counter | 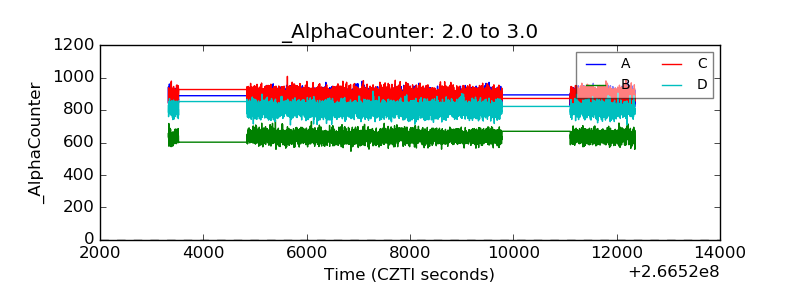 |
| _CPM_Rate | 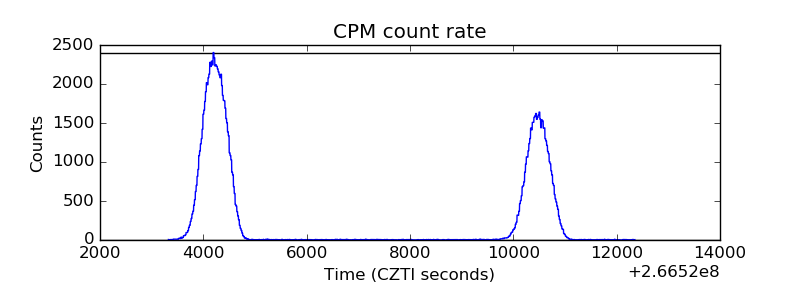 |
| CZT Counter | 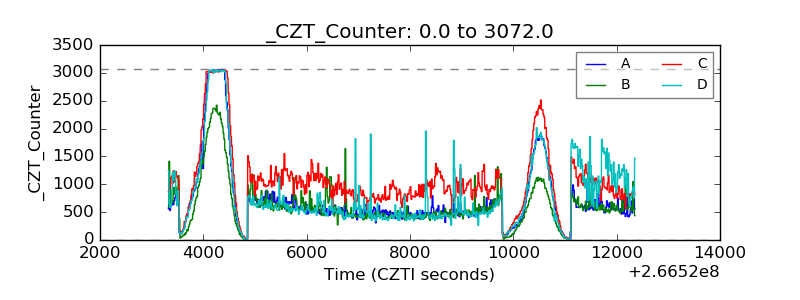 |
| +2.5 Volts monitor |  |
| +5 Volts monitor |  |
| _ROLL_ROT | 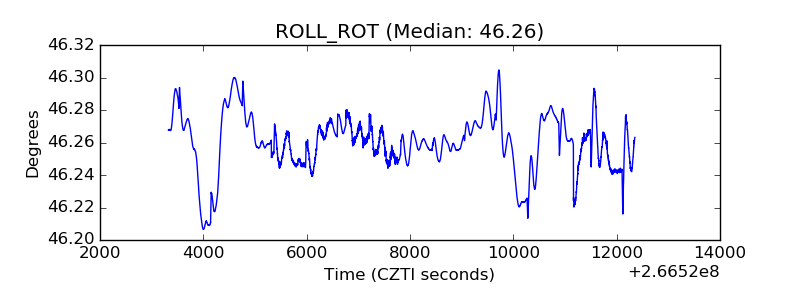 |
| _Roll_DEC |  |
| _Roll_RA | 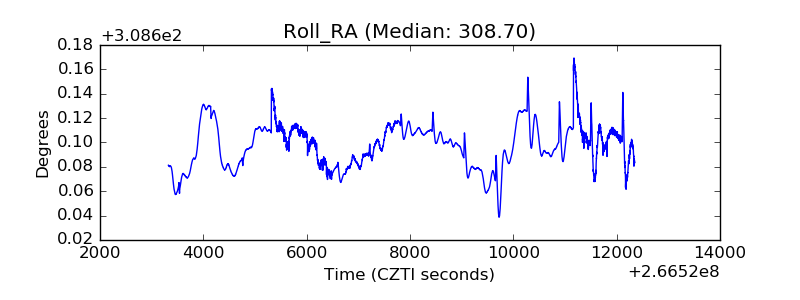 |
| Veto Counter | 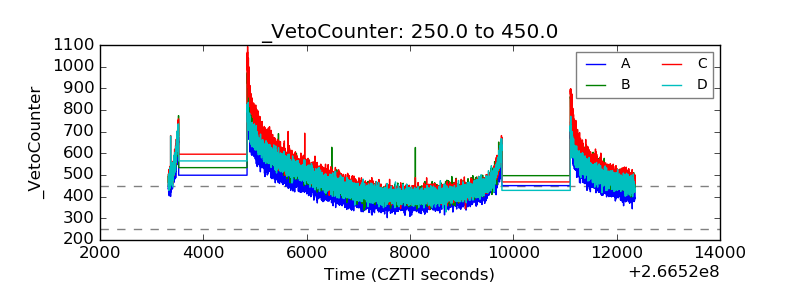 |