| Param | Original file | Final file |
|---|---|---|
| Filename | modeM0/AS1A04_043T01_9000002156_14637cztM0_level2.evt | modeM0/AS1A04_043T01_9000002156_14637cztM0_level2_quad_clean.evt |
| Size (bytes) | 567,043,200 | 107,395,200 |
| Size | 540.8 MB | 102.4 MB |
| Events in quadrant A | 3,690,047 | 696,692 |
| Events in quadrant B | 3,569,495 | 694,966 |
| Events in quadrant C | 5,793,466 | 676,202 |
| Events in quadrant D | 3,628,280 | 679,360 |
| Mode M9 | |||
|---|---|---|---|
| Quadrant | BADHDUFLAG | Total packets | Discarded packets |
| A | 0 | 9 | 0 |
| B | 0 | 9 | 0 |
| C | 0 | 9 | 0 |
| D | 0 | 10 | 0 |
| Mode M0 | |||
|---|---|---|---|
| Quadrant | BADHDUFLAG | Total packets | Discarded packets |
| A | 0 | 15950 | 2 |
| B | 0 | 15534 | 1 |
| C | 0 | 22568 | 1 |
| D | 0 | 16012 | 1 |
| Mode SS | |||
|---|---|---|---|
| Quadrant | BADHDUFLAG | Total packets | Discarded packets |
| A | 0 | 146 | 0 |
| B | 0 | 146 | 0 |
| C | 0 | 146 | 0 |
| D | 0 | 146 | 0 |
| Quadrant | Total seconds | Saturated seconds | Saturation percentage |
|---|---|---|---|
| A | 7262 | 28 | 0.385569% |
| B | 7262 | 49 | 0.674745% |
| C | 7262 | 88 | 1.211787% |
| D | 7262 | 60 | 0.826219% |
Noise dominated data is calculated using 1-second bins in cleaned event files. If a bin has >2000 counts, and if more than 50% of those come from <1% of pixels, then it is considered to be noise-dominated and hence unusable.
| Quadrant | # 1 sec bins | Bins with >0 counts | Bins with >2000 counts | High rate bins dominated by noise | Noise dominated (total time) | Noise dominated (detector-on time) | Marked lightcurve |
|---|---|---|---|---|---|---|---|
| A | 7708 | 7264 | 0 | 0 | 0.00% | 0.00% | 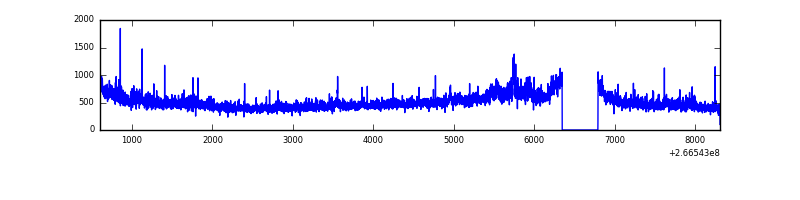 |
| B | 7708 | 7264 | 4 | 4 | 0.05% | 0.06% | 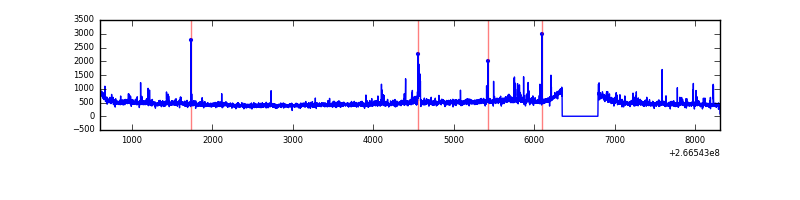 |
| C | 7708 | 7264 | 7 | 7 | 0.09% | 0.10% | 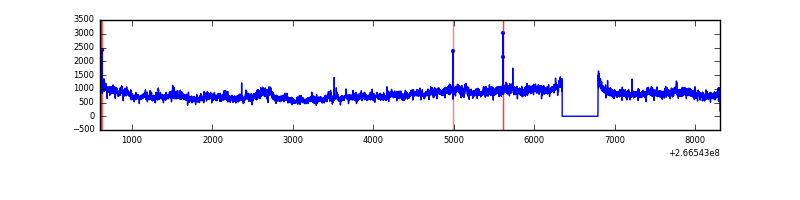 |
| D | 7708 | 7264 | 44 | 44 | 0.57% | 0.61% | 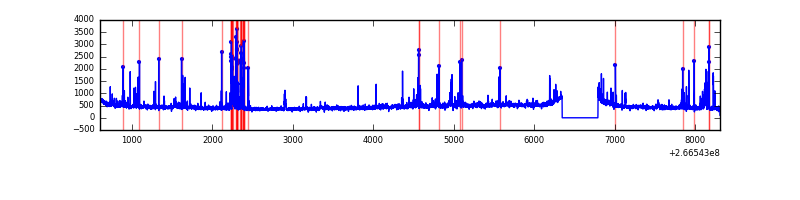 |
Top three noisy pixels from each quadrant. If the there are fewer than three noisy pixels in the level2.evt file, extra rows are filled as -1
| Pixel properties | Quadrant properties | ||||||
|---|---|---|---|---|---|---|---|
| Quadrant | DetID | PixID | Counts | Sigma | Mean | Median | Sigma |
| A | 1 | 162 | 127642 | 732.37 | 851 | 832 | 173.1 |
| A | 0 | 23 | 74927 | 427.92 | 851 | 832 | 173.1 |
| A | 1 | 178 | 54879 | 312.14 | 851 | 832 | 173.1 |
| B | 0 | 189 | 72645 | 441.5 | 853 | 830 | 162.7 |
| B | 0 | 230 | 33713 | 202.15 | 853 | 830 | 162.7 |
| B | 0 | 214 | 23557 | 139.72 | 853 | 830 | 162.7 |
| C | 3 | 233 | 2545097 | 13270.76 | 826 | 829 | 191.7 |
| C | 3 | 234 | 10532 | 50.61 | 826 | 829 | 191.7 |
| C | 0 | 207 | 10244 | 49.11 | 826 | 829 | 191.7 |
| D | 10 | 199 | 213041 | 984.25 | 827 | 807 | 215.6 |
| D | 10 | 70 | 92576 | 425.58 | 827 | 807 | 215.6 |
| D | 2 | 120 | 39562 | 179.73 | 827 | 807 | 215.6 |
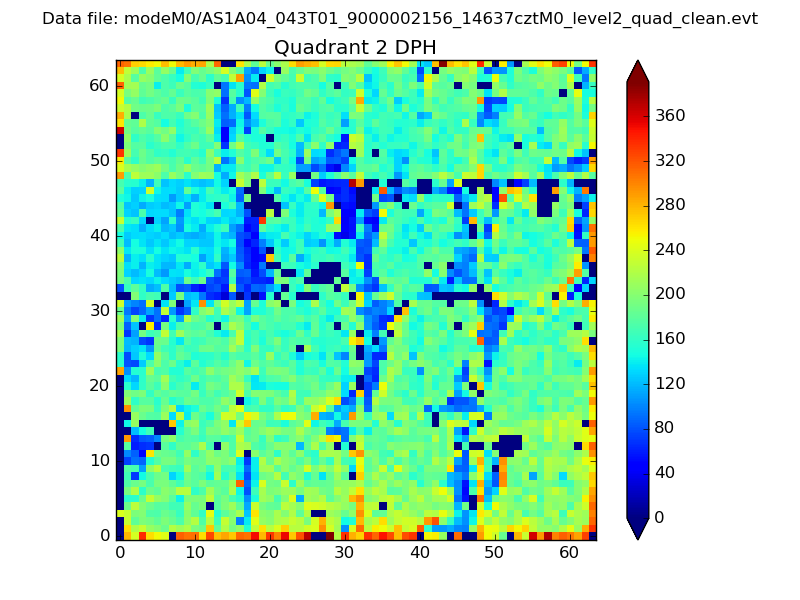
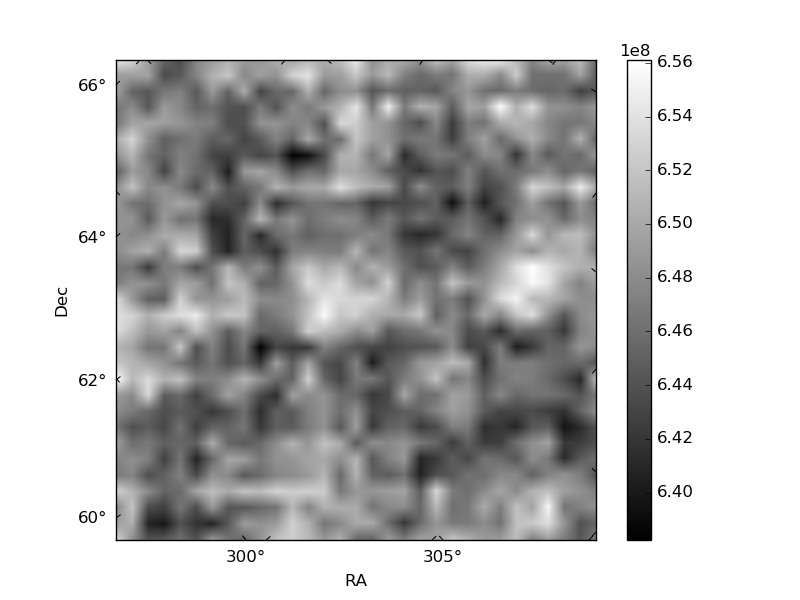
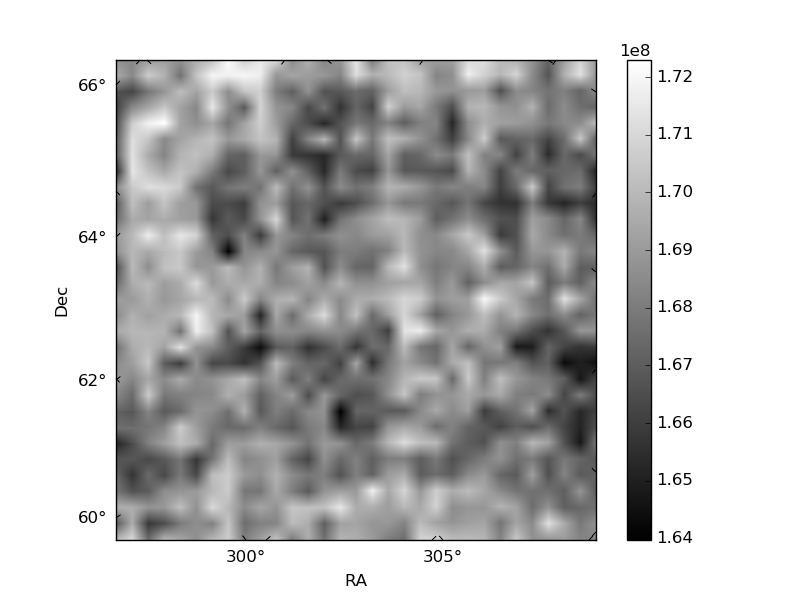
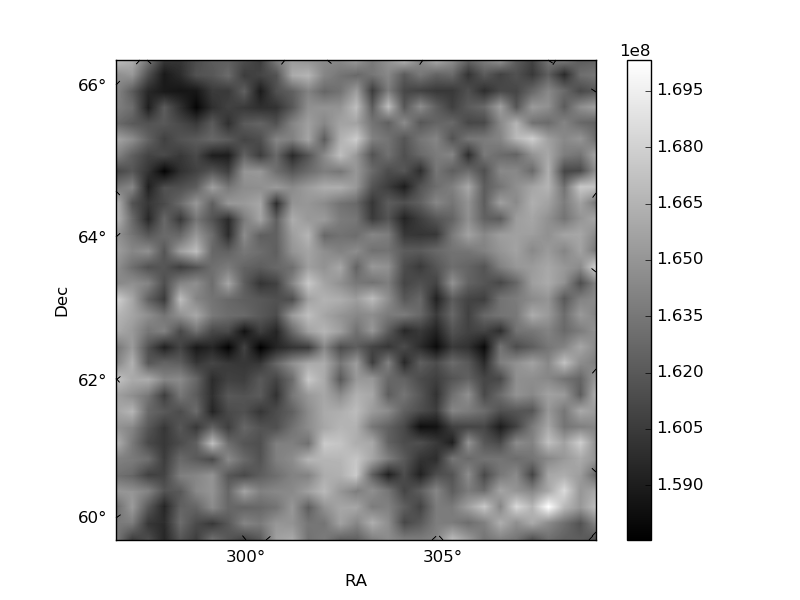
Histogram calculated using DETX and DETY for each event in the final _common_clean file
| Quadrant A | 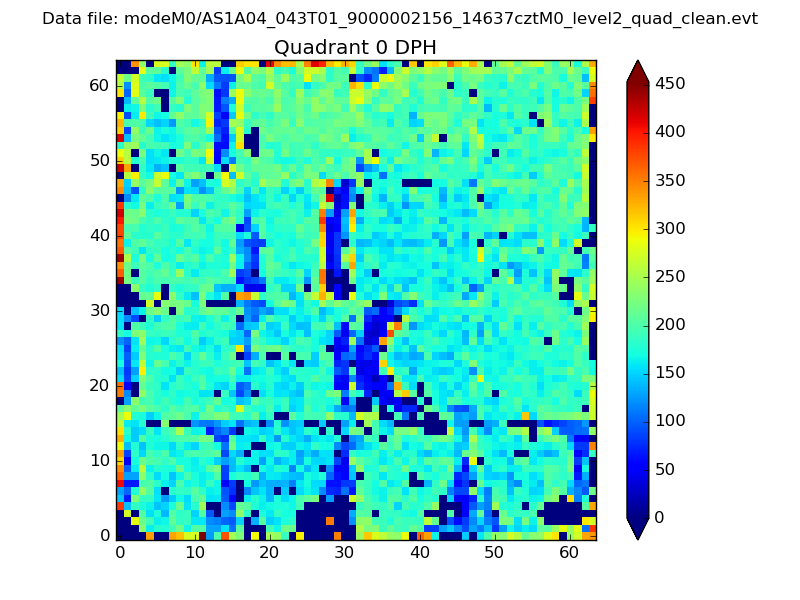 |
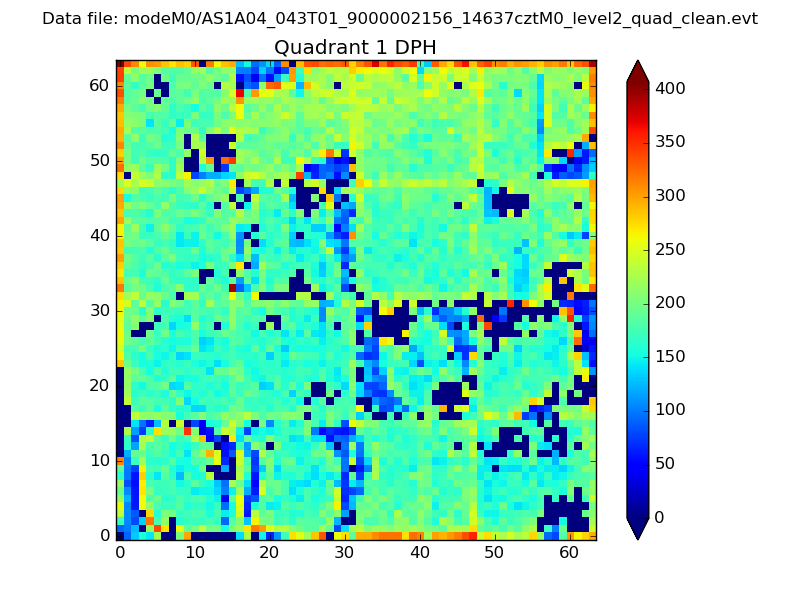 |
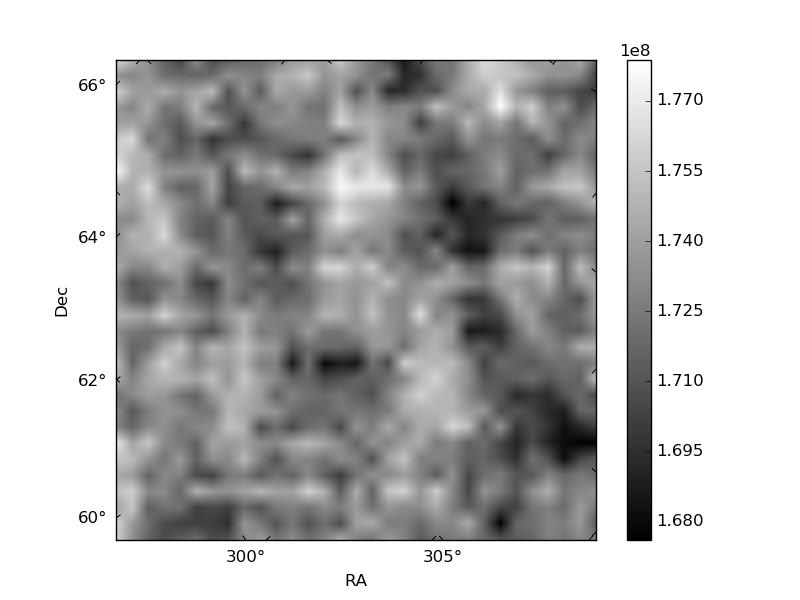
Quadrant B |
|---|---|---|---|
| Quadrant D | 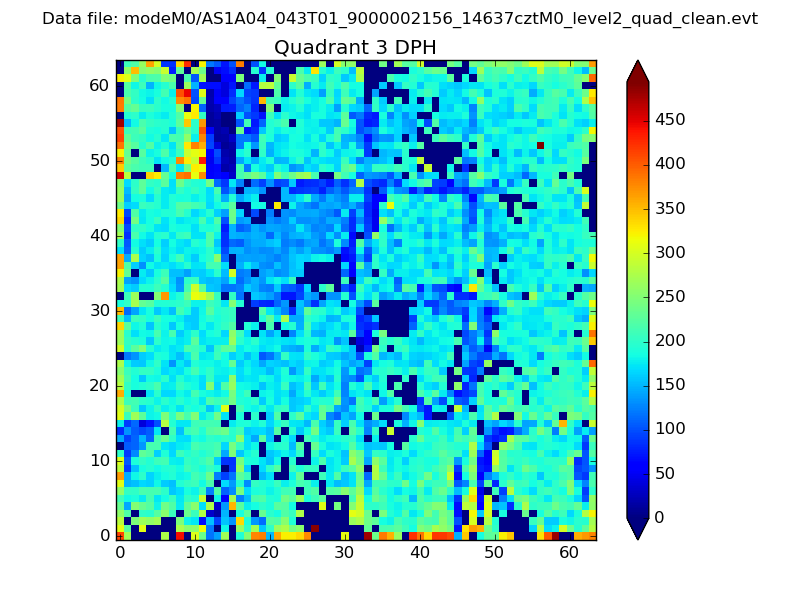 |
 |
Quadrant C |
| Plot type | Count rate plots | Images |
|---|---|---|
| Comparison with Poisson distribution Blue bars denote a histogram of data divided into 1 sec bins. Red curve is a Poisson curve with rate = median count rate of data. |
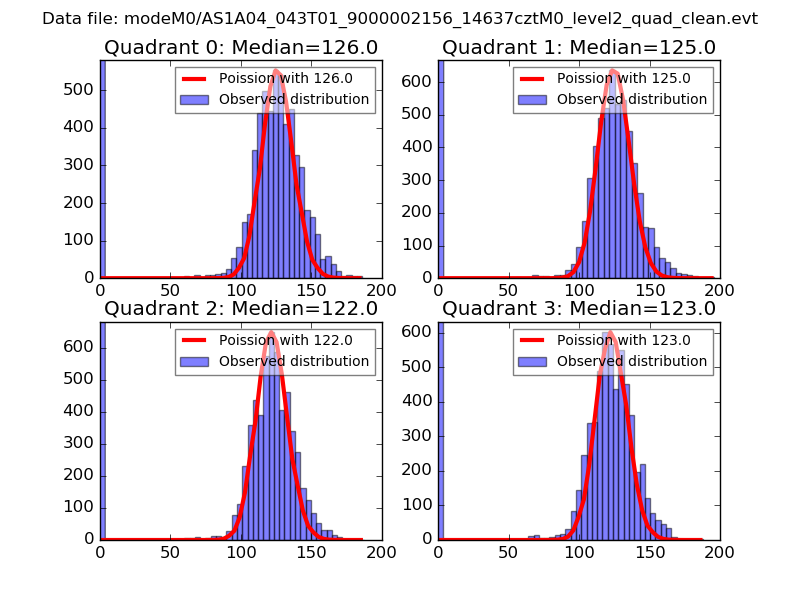 |
 |
| Quadrant-wise count rates Data is divided into 100 sec bins |
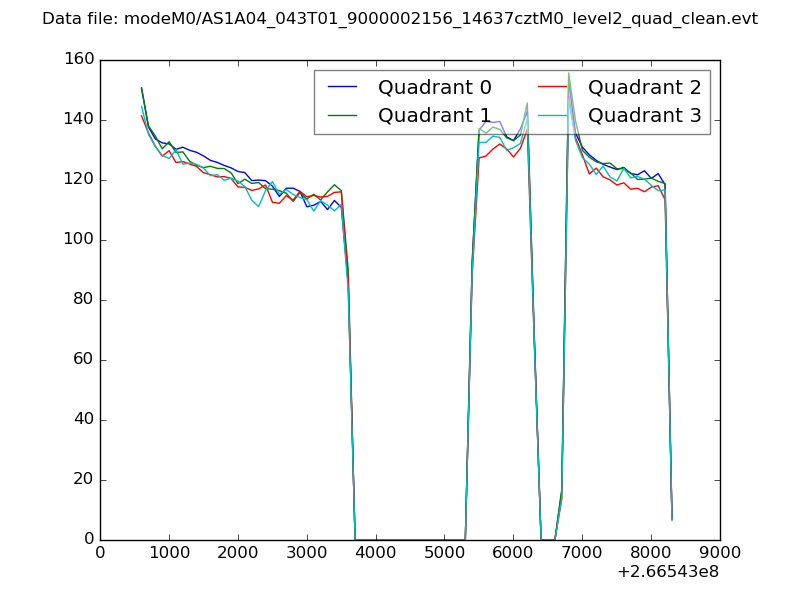 |
|
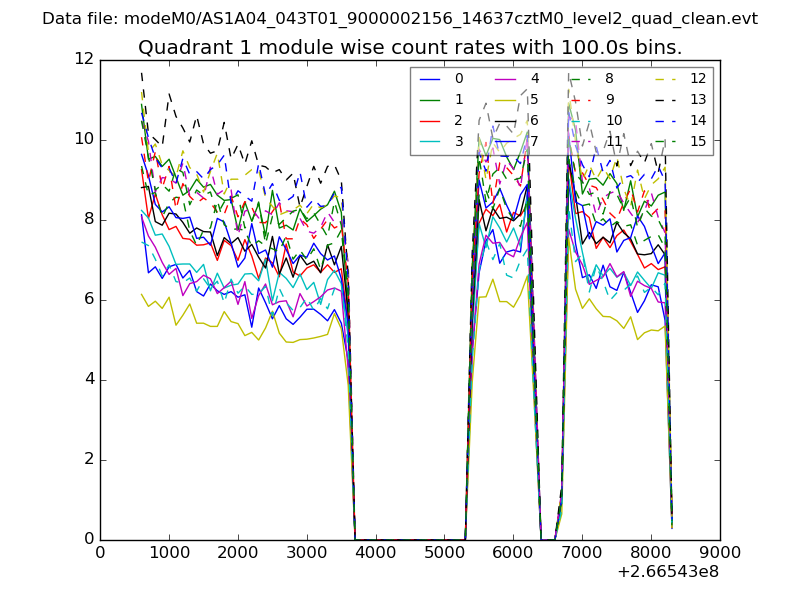
| Module-wise count rates for Quadrant A Data is divided into 100 sec bins |
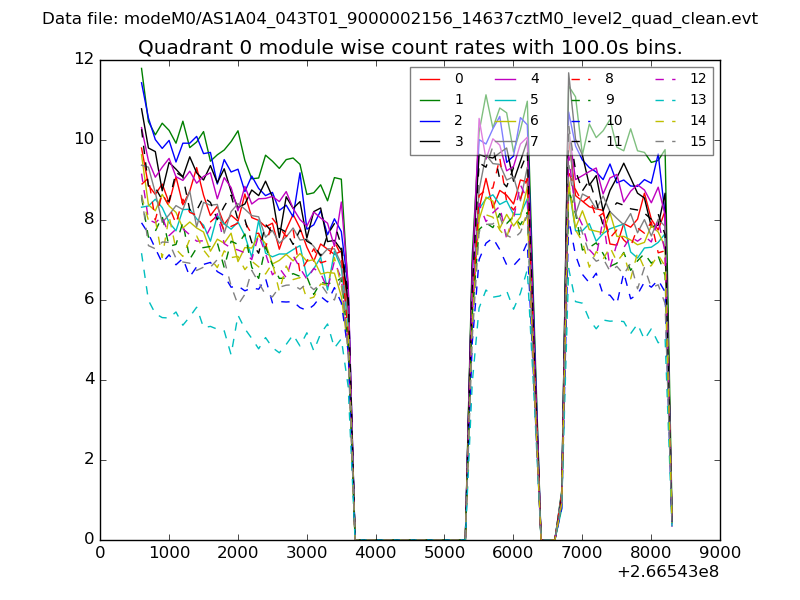 |
 |
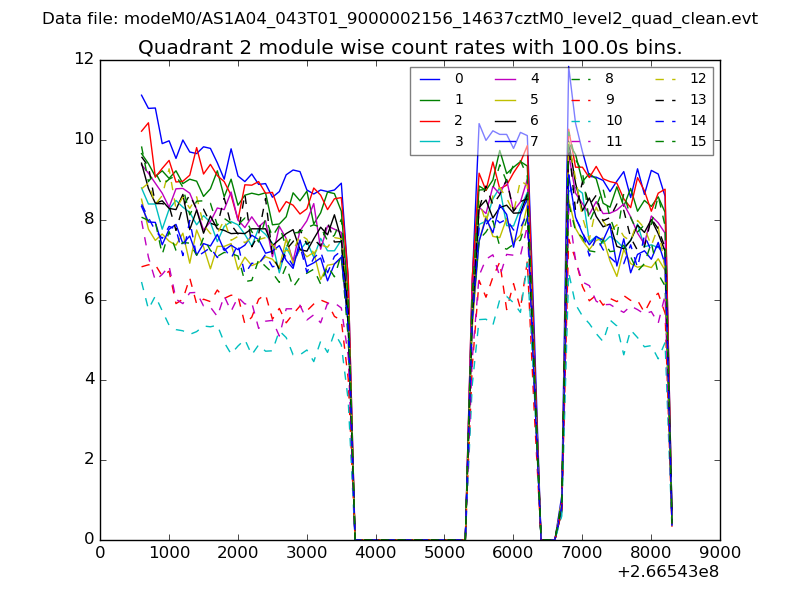
| Module-wise count rates for Quadrant B Data is divided into 100 sec bins |
 |
 |
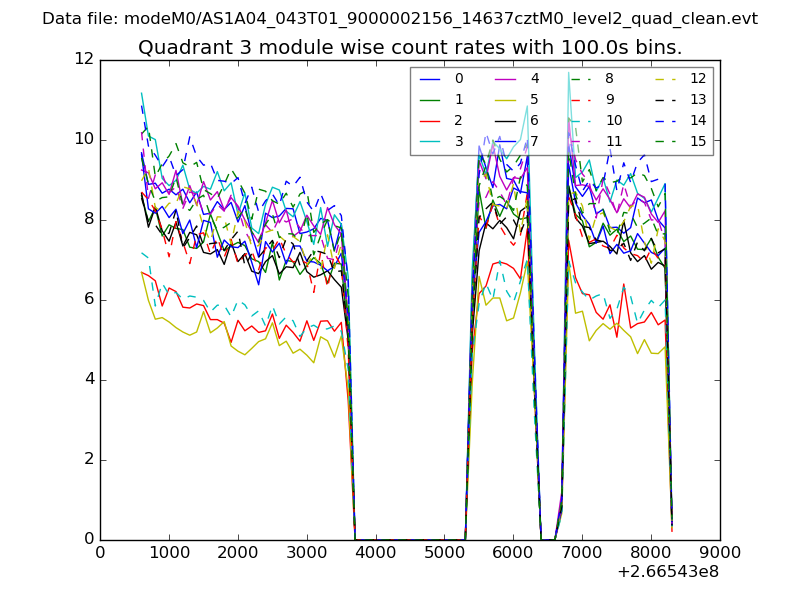
| Module-wise count rates for Quadrant C Data is divided into 100 sec bins |
 |
 |
| Module-wise count rates for Quadrant D Data is divided into 100 sec bins |
 |
 |
| Parameter | Plot |
|---|---|
| CZT HV Monitor | 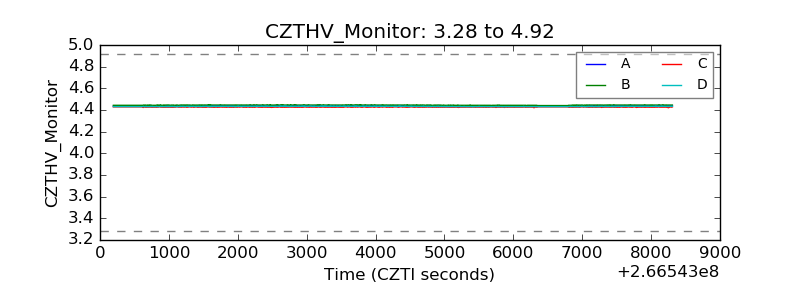 |
| D_VDD | 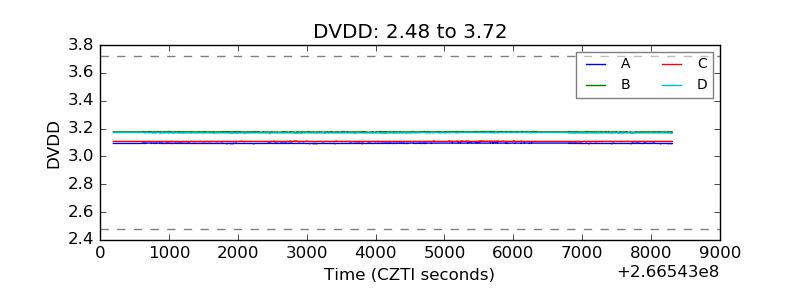 |
| Temperature 1 |  |
| Veto HV Monitor | 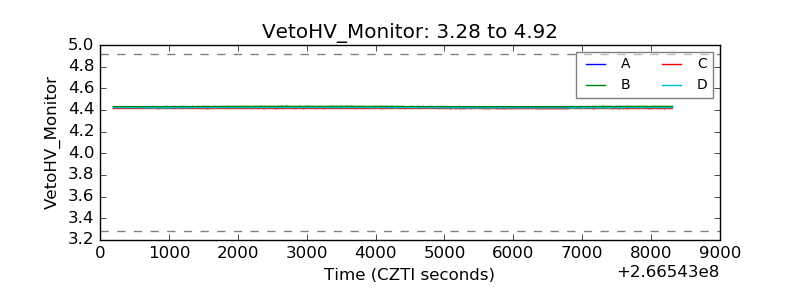 |
| Veto LLD | 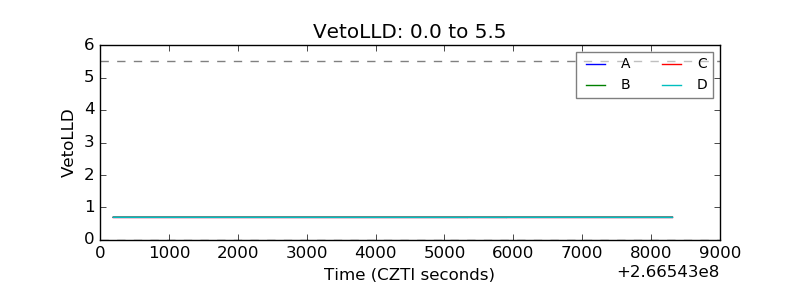 |
| Alpha Counter | 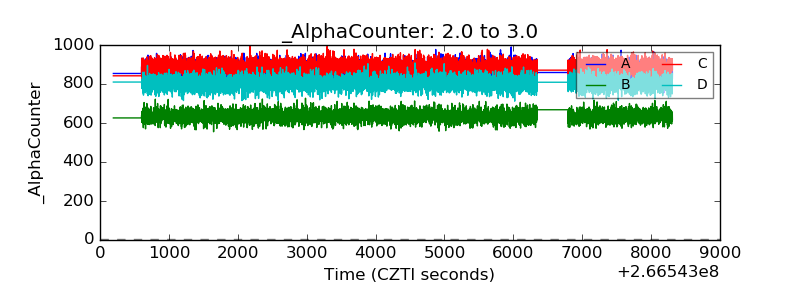 |
| _CPM_Rate | 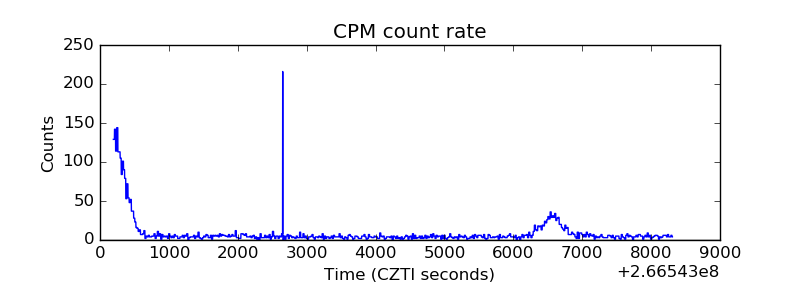 |
| CZT Counter | 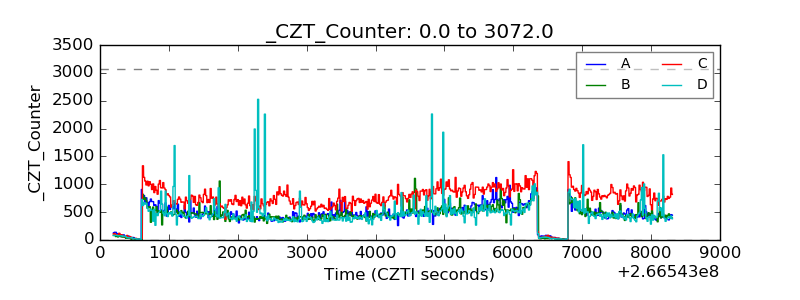 |
| +2.5 Volts monitor |  |
| +5 Volts monitor |  |
| _ROLL_ROT | 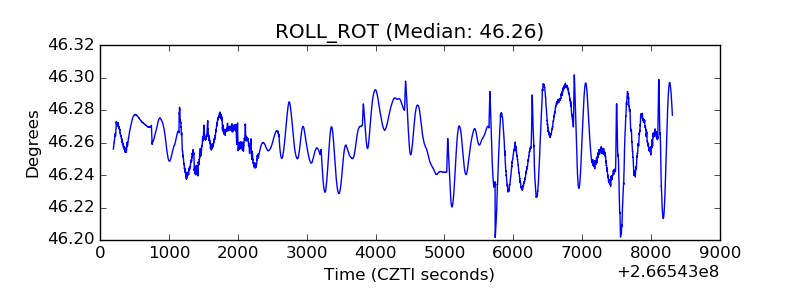 |
| _Roll_DEC | 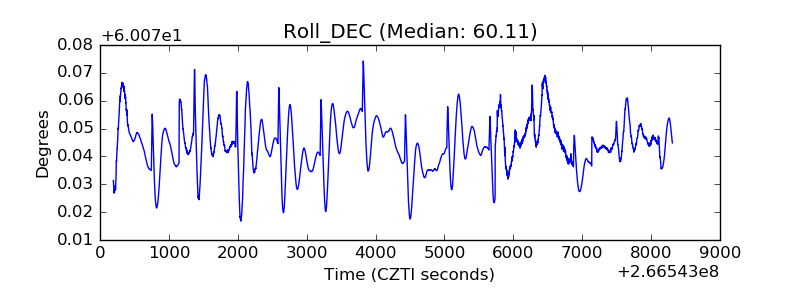 |
| _Roll_RA | 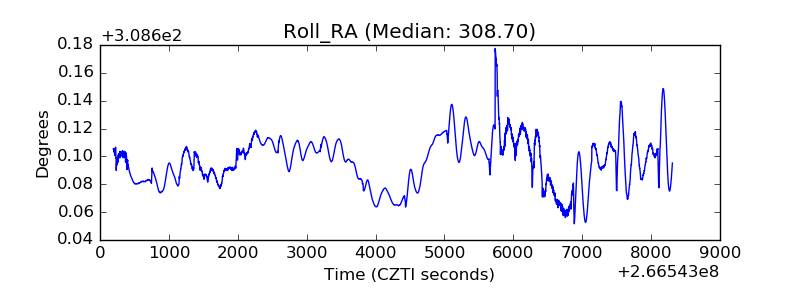 |
| Veto Counter | 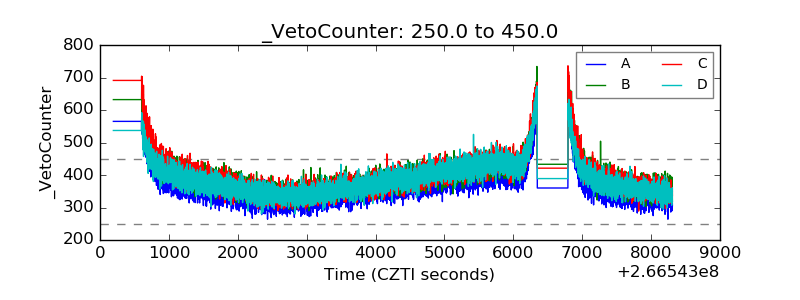 |