| Param | Original file | Final file |
|---|---|---|
| Filename | modeM0/AS1A04_043T01_9000002156_14638cztM0_level2.evt | modeM0/AS1A04_043T01_9000002156_14638cztM0_level2_quad_clean.evt |
| Size (bytes) | 637,257,600 | 115,041,600 |
| Size | 607.7 MB | 109.7 MB |
| Events in quadrant A | 4,010,311 | 749,849 |
| Events in quadrant B | 4,640,276 | 743,331 |
| Events in quadrant C | 6,251,977 | 728,126 |
| Events in quadrant D | 3,876,502 | 727,816 |
| Mode M9 | |||
|---|---|---|---|
| Quadrant | BADHDUFLAG | Total packets | Discarded packets |
| A | 0 | 8 | 0 |
| B | 0 | 8 | 0 |
| C | 0 | 8 | 0 |
| D | 0 | 8 | 0 |
| Mode M0 | |||
|---|---|---|---|
| Quadrant | BADHDUFLAG | Total packets | Discarded packets |
| A | 0 | 17222 | 2 |
| B | 0 | 19026 | 1 |
| C | 0 | 24042 | 1 |
| D | 0 | 17234 | 1 |
| Mode SS | |||
|---|---|---|---|
| Quadrant | BADHDUFLAG | Total packets | Discarded packets |
| A | 0 | 156 | 0 |
| B | 0 | 156 | 0 |
| C | 0 | 156 | 0 |
| D | 0 | 156 | 0 |
| Quadrant | Total seconds | Saturated seconds | Saturation percentage |
|---|---|---|---|
| A | 7699 | 53 | 0.688401% |
| B | 7699 | 250 | 3.247175% |
| C | 7699 | 79 | 1.026107% |
| D | 7699 | 92 | 1.194960% |
Noise dominated data is calculated using 1-second bins in cleaned event files. If a bin has >2000 counts, and if more than 50% of those come from <1% of pixels, then it is considered to be noise-dominated and hence unusable.
| Quadrant | # 1 sec bins | Bins with >0 counts | Bins with >2000 counts | High rate bins dominated by noise | Noise dominated (total time) | Noise dominated (detector-on time) | Marked lightcurve |
|---|---|---|---|---|---|---|---|
| A | 8440 | 7702 | 0 | 0 | 0.00% | 0.00% | 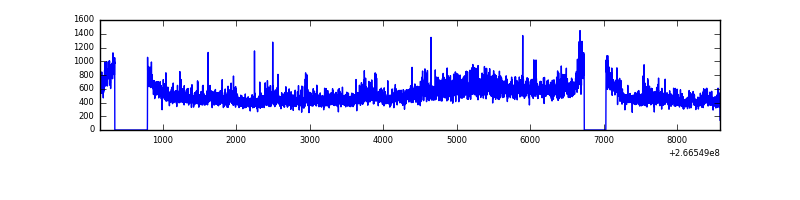 |
| B | 8440 | 7702 | 125 | 125 | 1.48% | 1.62% | 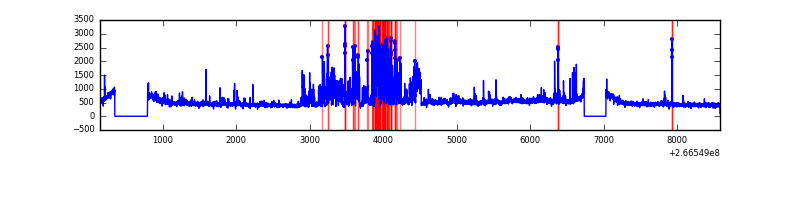 |
| C | 8440 | 7702 | 0 | 0 | 0.00% | 0.00% | 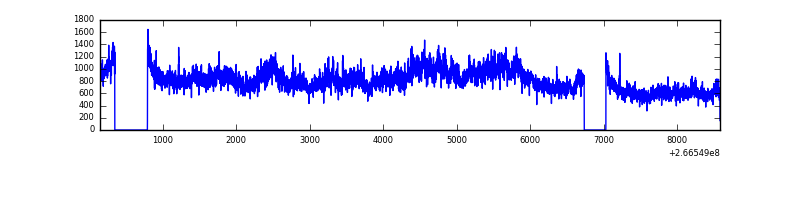 |
| D | 8440 | 7701 | 27 | 27 | 0.32% | 0.35% | 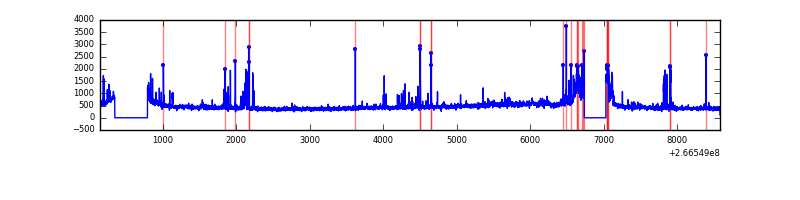 |
Top three noisy pixels from each quadrant. If the there are fewer than three noisy pixels in the level2.evt file, extra rows are filled as -1
| Pixel properties | Quadrant properties | ||||||
|---|---|---|---|---|---|---|---|
| Quadrant | DetID | PixID | Counts | Sigma | Mean | Median | Sigma |
| A | 1 | 162 | 183012 | 994.61 | 906 | 886 | 183.1 |
| A | 1 | 178 | 80299 | 433.68 | 906 | 886 | 183.1 |
| A | 1 | 161 | 69257 | 373.38 | 906 | 886 | 183.1 |
| B | 10 | 16 | 798194 | 4598.34 | 904 | 879 | 173.4 |
| B | 0 | 189 | 139007 | 796.62 | 904 | 879 | 173.4 |
| B | 4 | 173 | 46070 | 260.63 | 904 | 879 | 173.4 |
| C | 3 | 233 | 2803355 | 13766.68 | 879 | 882 | 203.6 |
| C | 3 | 234 | 15913 | 73.84 | 879 | 882 | 203.6 |
| C | 3 | 232 | 7849 | 34.22 | 879 | 882 | 203.6 |
| D | 13 | 122 | 143657 | 660.03 | 876 | 854 | 216.4 |
| D | 10 | 70 | 120638 | 553.63 | 876 | 854 | 216.4 |
| D | 10 | 199 | 91540 | 419.14 | 876 | 854 | 216.4 |
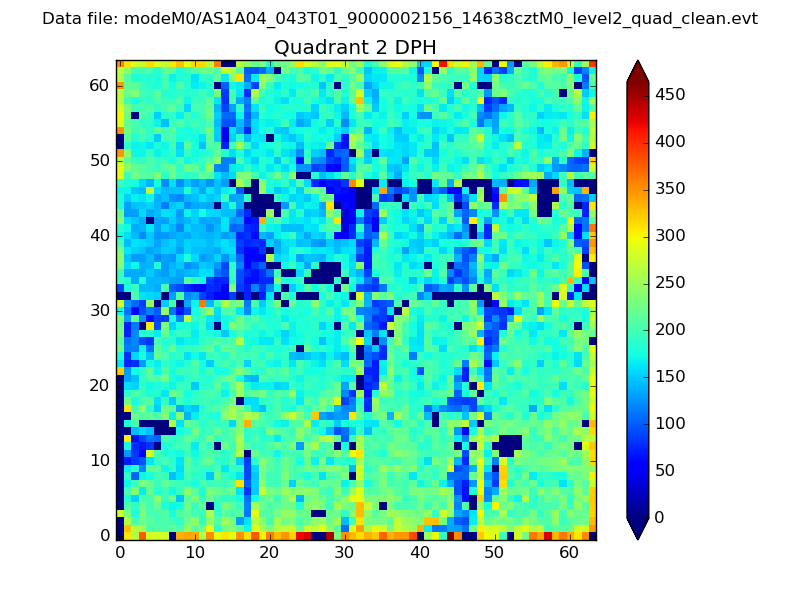
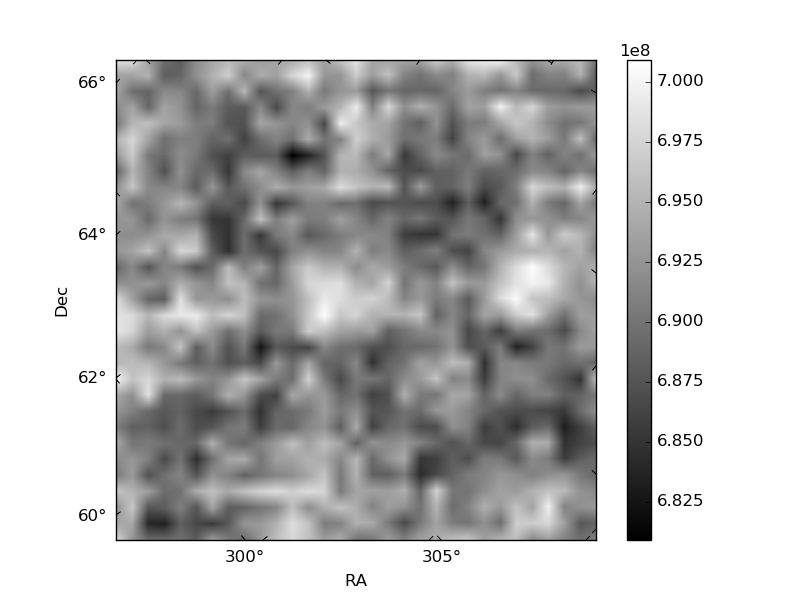
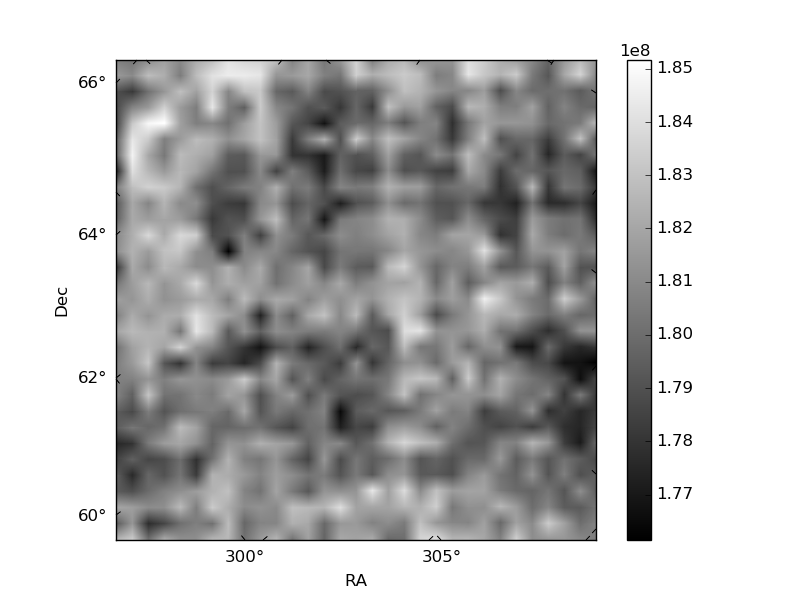
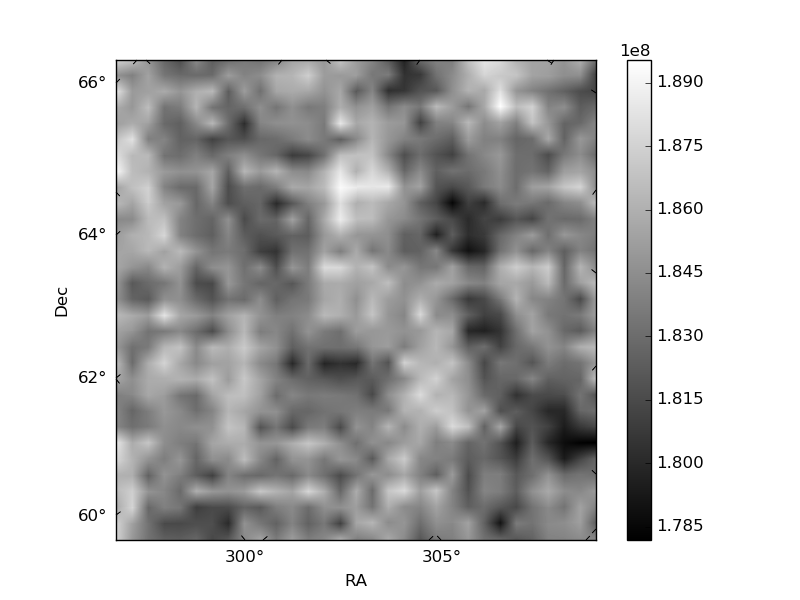
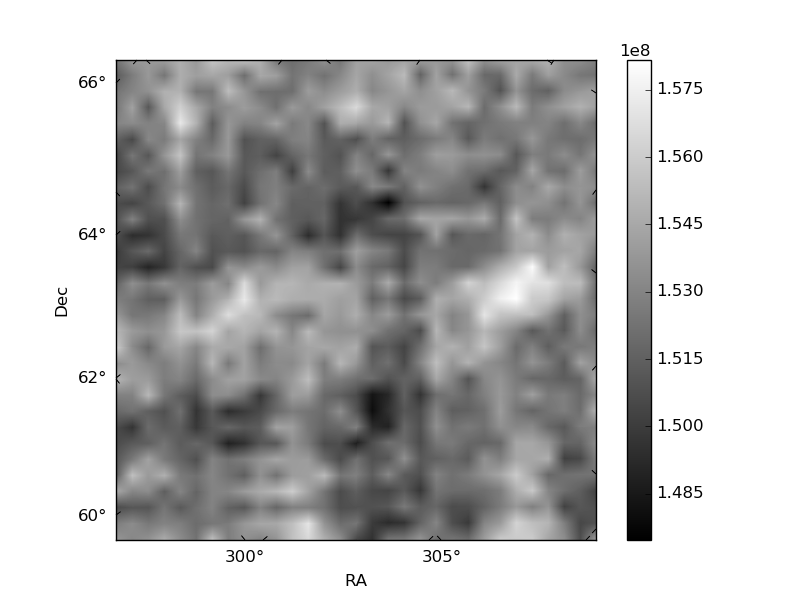
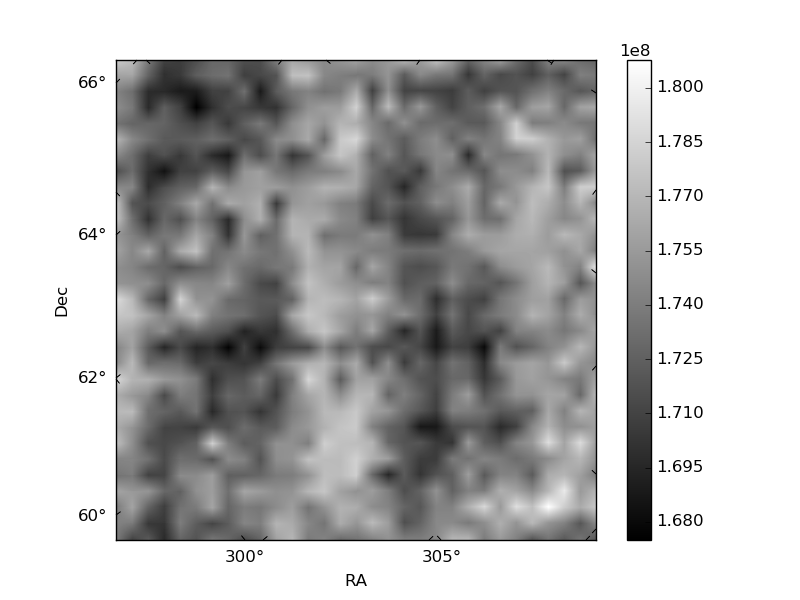
Histogram calculated using DETX and DETY for each event in the final _common_clean file
| Quadrant A | 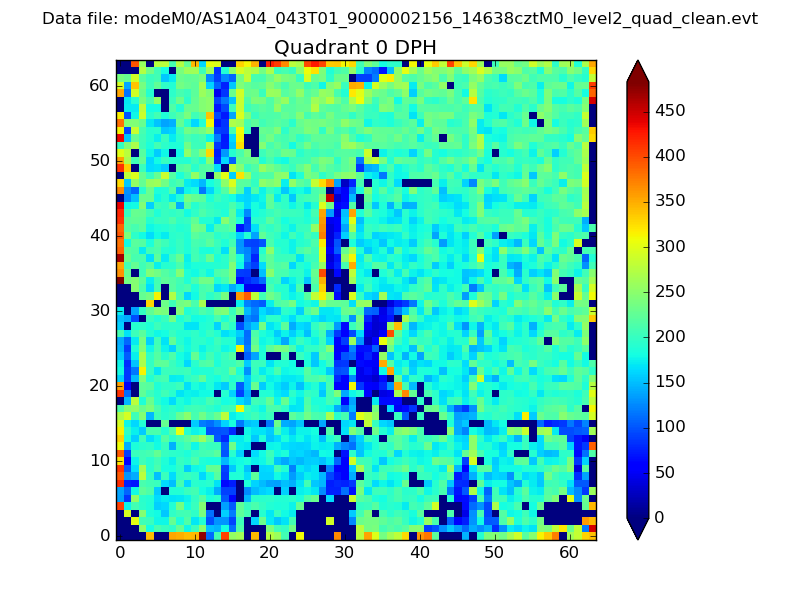 |
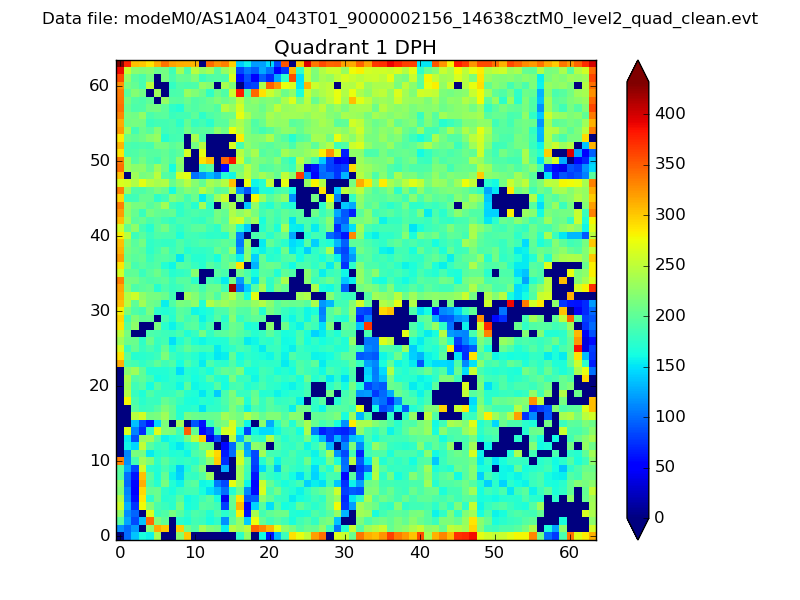 |
Quadrant B |
|---|---|---|---|
| Quadrant D | 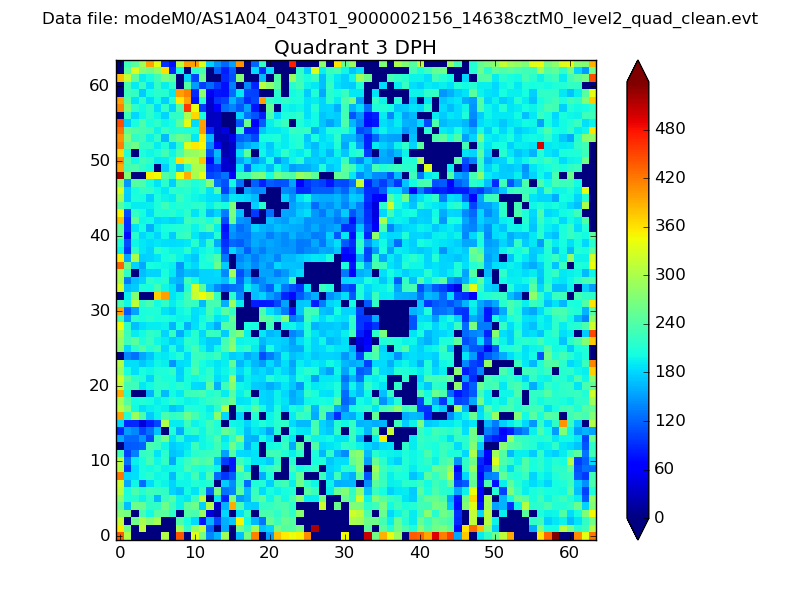 |
 |
Quadrant C |
| Plot type | Count rate plots | Images |
|---|---|---|
| Comparison with Poisson distribution Blue bars denote a histogram of data divided into 1 sec bins. Red curve is a Poisson curve with rate = median count rate of data. |
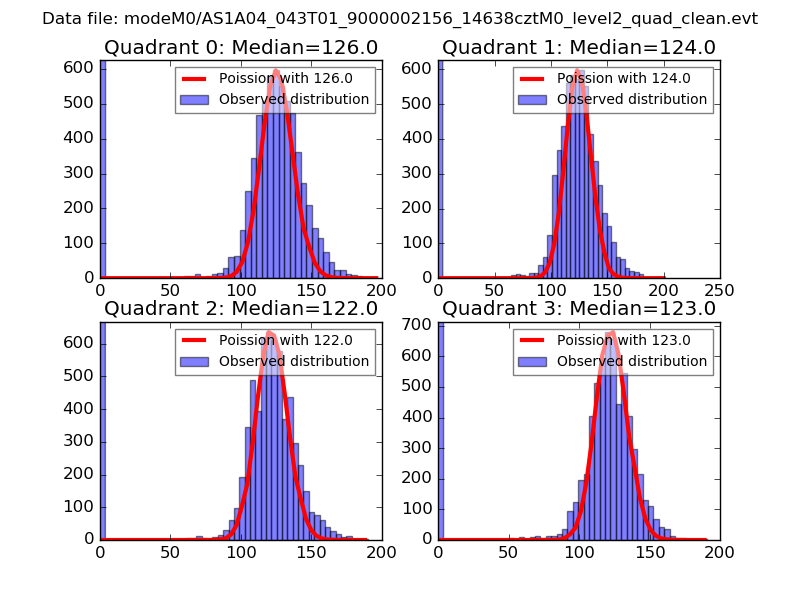 |
 |
| Quadrant-wise count rates Data is divided into 100 sec bins |
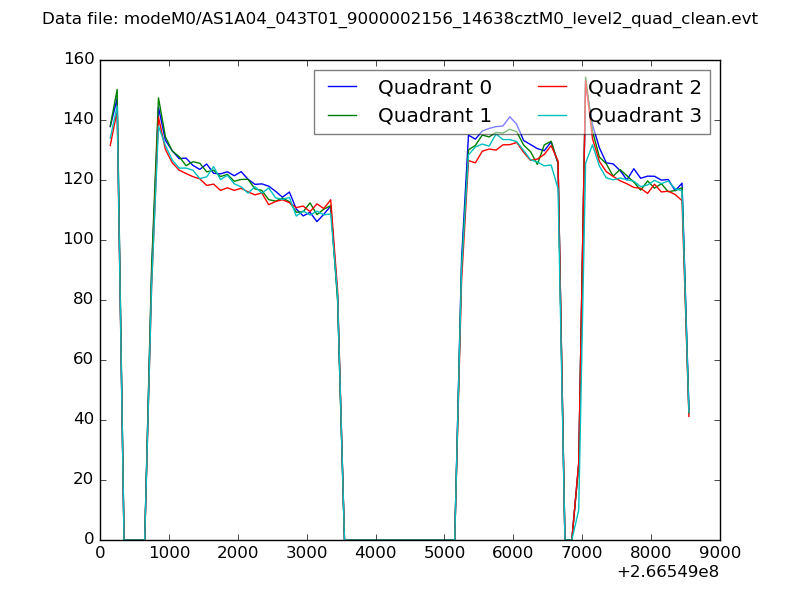 |
|
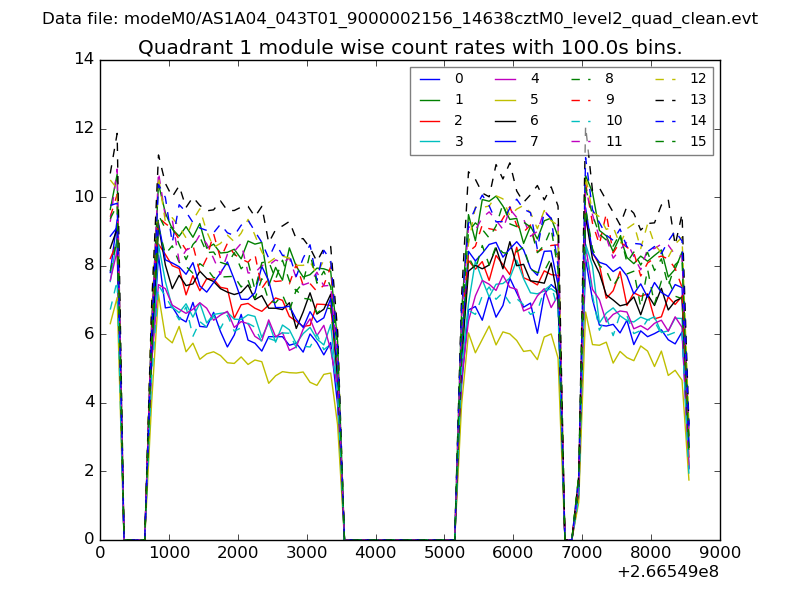
| Module-wise count rates for Quadrant A Data is divided into 100 sec bins |
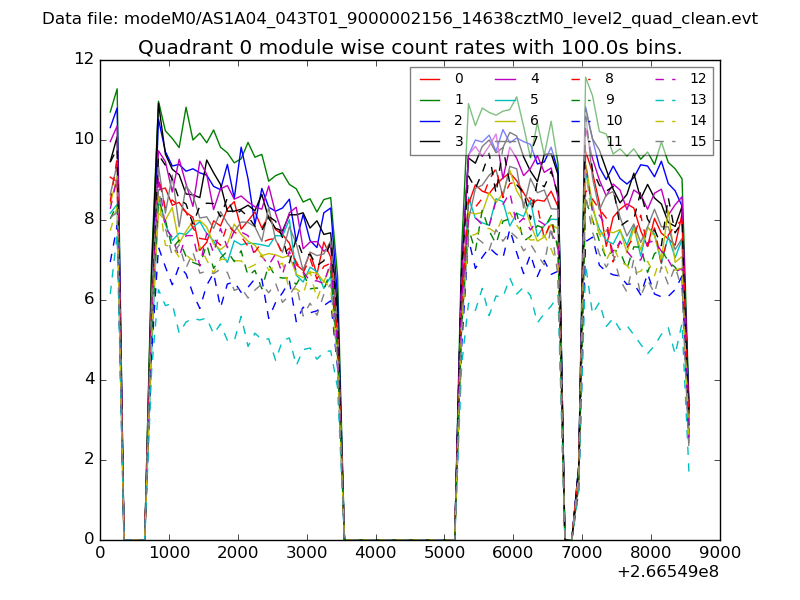 |
 |
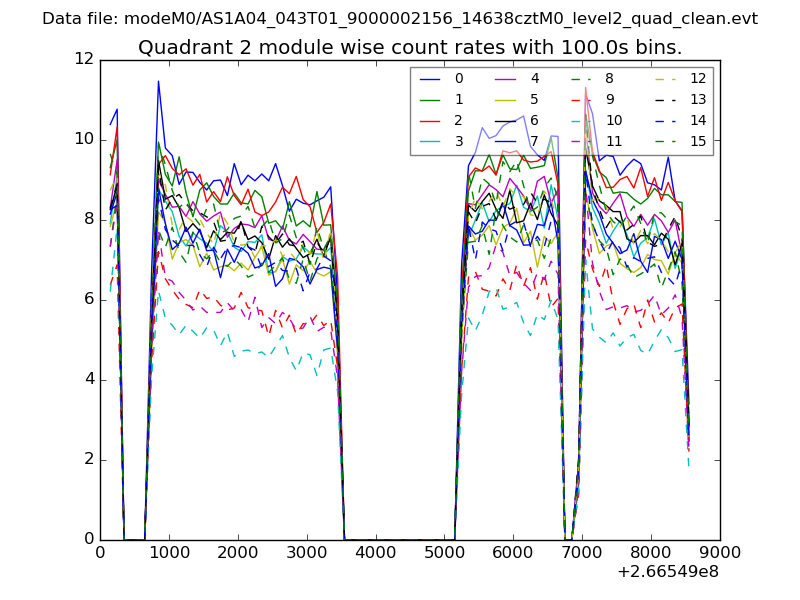
| Module-wise count rates for Quadrant B Data is divided into 100 sec bins |
 |
 |
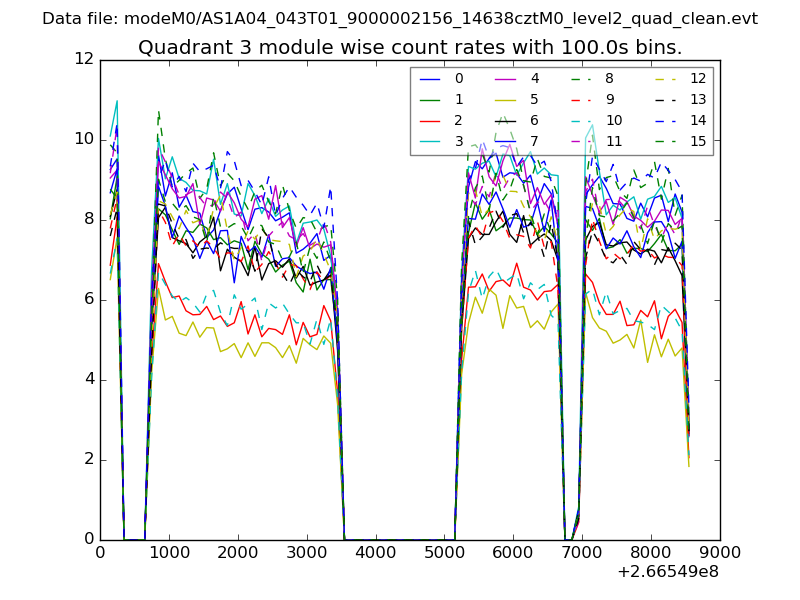
| Module-wise count rates for Quadrant C Data is divided into 100 sec bins |
 |
 |
| Module-wise count rates for Quadrant D Data is divided into 100 sec bins |
 |
 |
| Parameter | Plot |
|---|---|
| CZT HV Monitor | 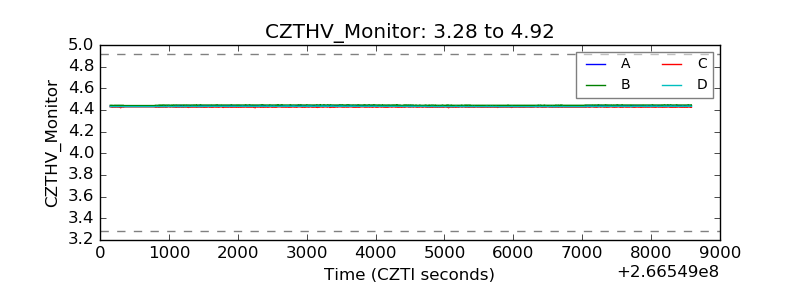 |
| D_VDD | 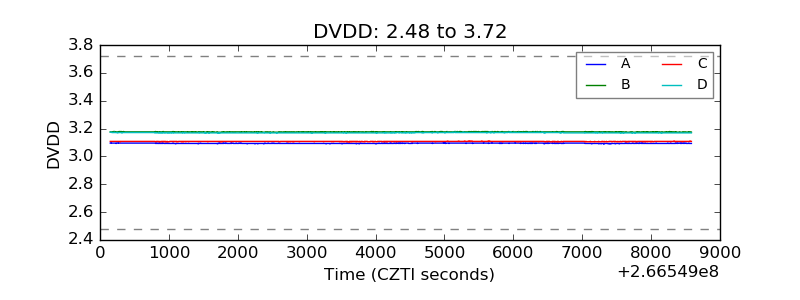 |
| Temperature 1 | 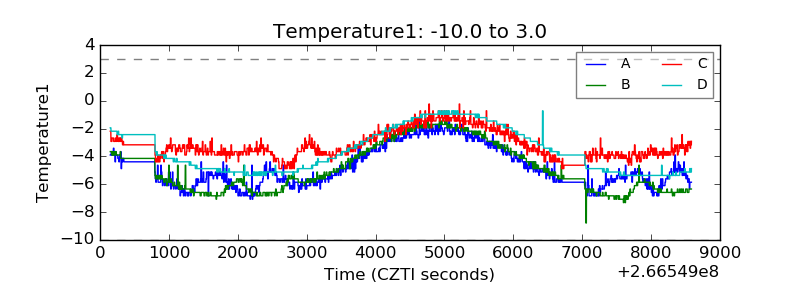 |
| Veto HV Monitor | 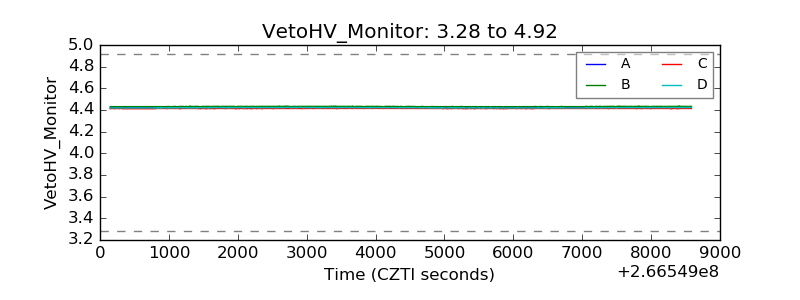 |
| Veto LLD | 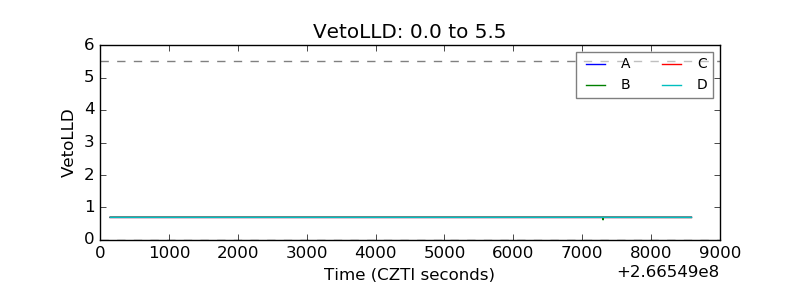 |
| Alpha Counter | 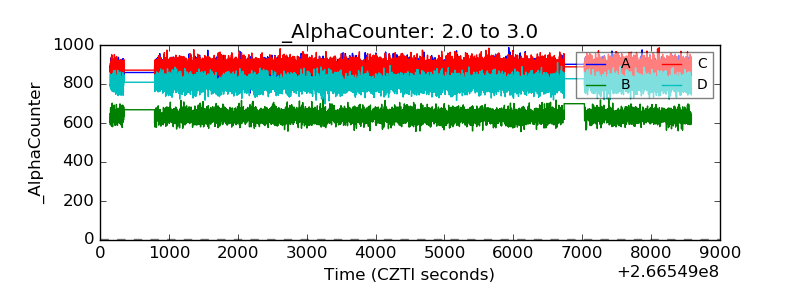 |
| _CPM_Rate | 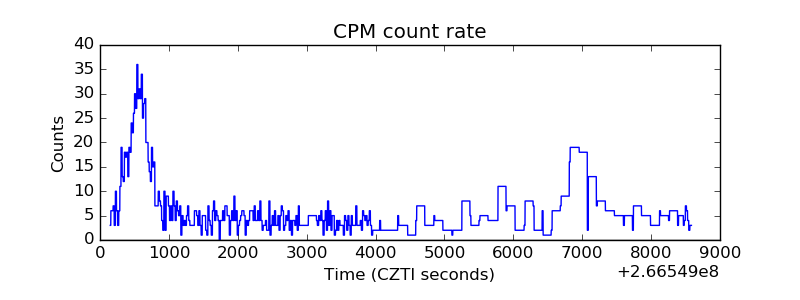 |
| CZT Counter | 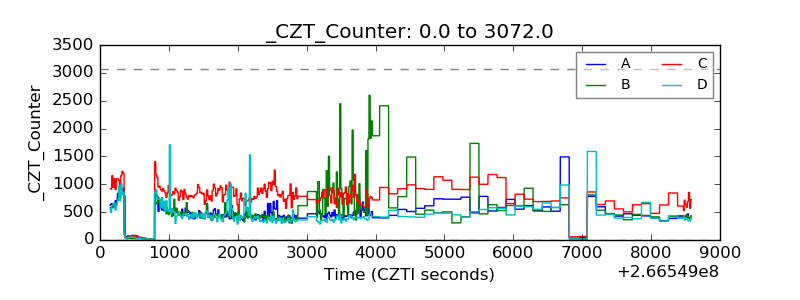 |
| +2.5 Volts monitor | 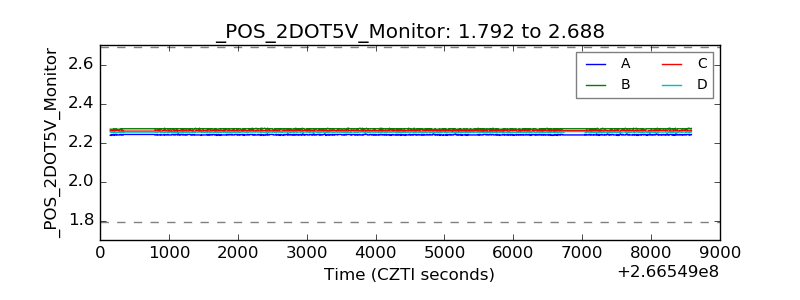 |
| +5 Volts monitor | 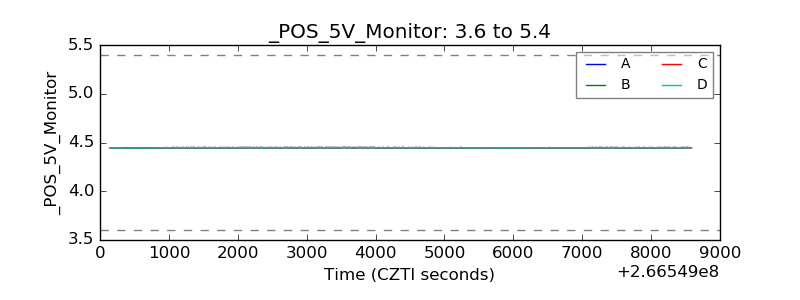 |
| _ROLL_ROT | 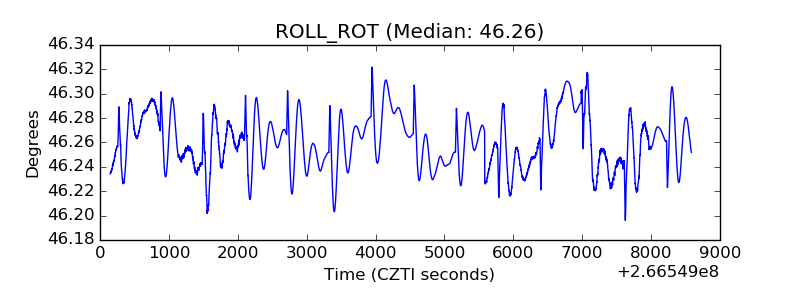 |
| _Roll_DEC | 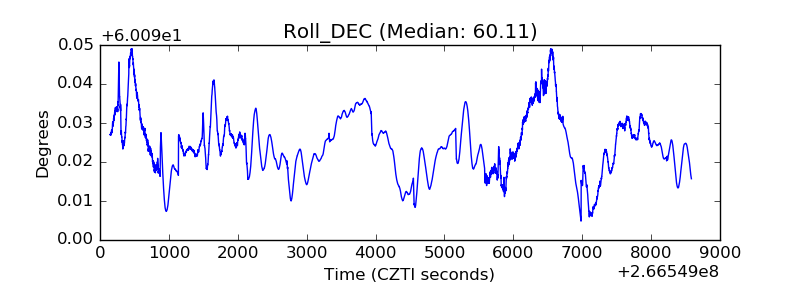 |
| _Roll_RA | 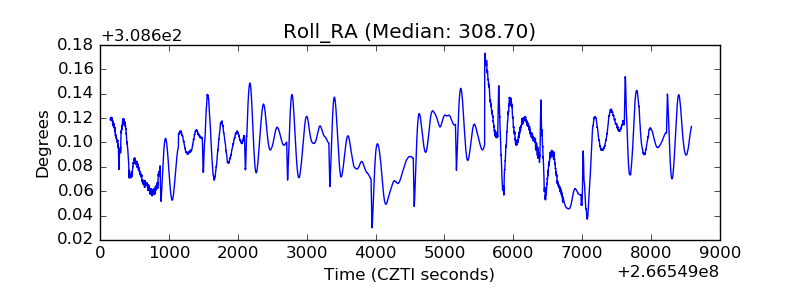 |
| Veto Counter | 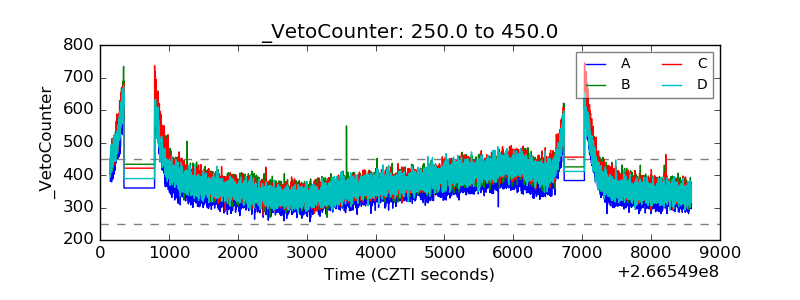 |