| Param | Original file | Final file |
|---|---|---|
| Filename | modeM0/AS1A04_043T01_9000002156_14641cztM0_level2.evt | modeM0/AS1A04_043T01_9000002156_14641cztM0_level2_quad_clean.evt |
| Size (bytes) | 399,352,320 | 65,574,720 |
| Size | 380.9 MB | 62.5 MB |
| Events in quadrant A | 2,893,068 | 413,577 |
| Events in quadrant B | 2,539,384 | 411,972 |
| Events in quadrant C | 3,795,134 | 402,406 |
| Events in quadrant D | 2,521,233 | 401,105 |
| Mode M0 | |||
|---|---|---|---|
| Quadrant | BADHDUFLAG | Total packets | Discarded packets |
| A | 0 | 11947 | 0 |
| B | 0 | 10864 | 0 |
| C | 0 | 15084 | 0 |
| D | 0 | 11213 | 0 |
| Mode SS | |||
|---|---|---|---|
| Quadrant | BADHDUFLAG | Total packets | Discarded packets |
| A | 0 | 100 | 0 |
| B | 0 | 100 | 0 |
| C | 0 | 100 | 0 |
| D | 0 | 100 | 0 |
| Quadrant | Total seconds | Saturated seconds | Saturation percentage |
|---|---|---|---|
| A | 5093 | 18 | 0.353426% |
| B | 5093 | 19 | 0.373061% |
| C | 5093 | 6 | 0.117809% |
| D | 5093 | 85 | 1.668957% |
Noise dominated data is calculated using 1-second bins in cleaned event files. If a bin has >2000 counts, and if more than 50% of those come from <1% of pixels, then it is considered to be noise-dominated and hence unusable.
| Quadrant | # 1 sec bins | Bins with >0 counts | Bins with >2000 counts | High rate bins dominated by noise | Noise dominated (total time) | Noise dominated (detector-on time) | Marked lightcurve |
|---|---|---|---|---|---|---|---|
| A | 5094 | 5094 | 3 | 3 | 0.06% | 0.06% | 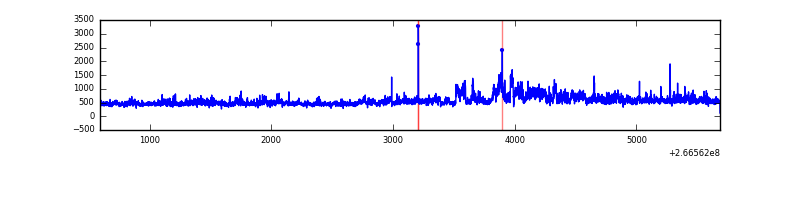 |
| B | 5094 | 5094 | 8 | 8 | 0.16% | 0.16% | 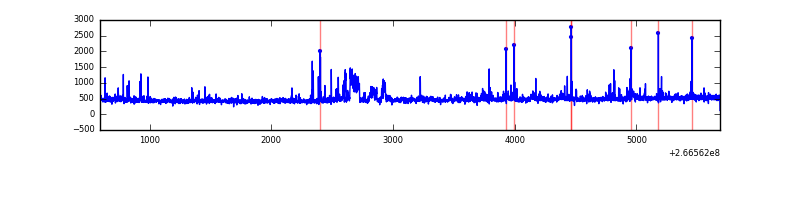 |
| C | 5094 | 5094 | 1 | 1 | 0.02% | 0.02% | 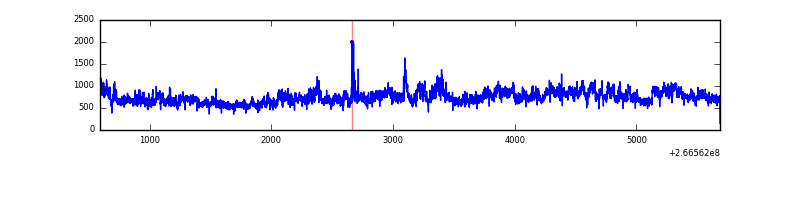 |
| D | 5094 | 5094 | 77 | 77 | 1.51% | 1.51% | 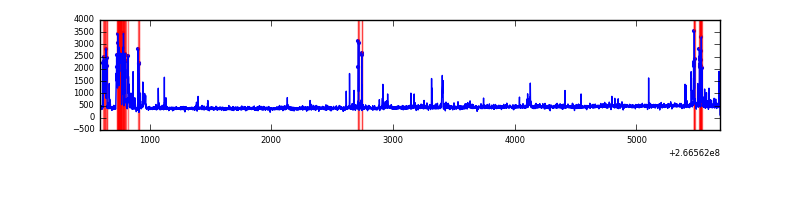 |
Top three noisy pixels from each quadrant. If the there are fewer than three noisy pixels in the level2.evt file, extra rows are filled as -1
| Pixel properties | Quadrant properties | ||||||
|---|---|---|---|---|---|---|---|
| Quadrant | DetID | PixID | Counts | Sigma | Mean | Median | Sigma |
| A | 0 | 23 | 244225 | 2041.37 | 581 | 570 | 119.4 |
| A | 1 | 162 | 138728 | 1157.5 | 581 | 570 | 119.4 |
| A | 1 | 178 | 62886 | 522.09 | 581 | 570 | 119.4 |
| B | 0 | 189 | 109111 | 978.48 | 582 | 567 | 110.9 |
| B | 10 | 246 | 46044 | 409.96 | 582 | 567 | 110.9 |
| B | 4 | 173 | 31430 | 278.22 | 582 | 567 | 110.9 |
| C | 3 | 233 | 1588118 | 12256.83 | 561 | 566 | 129.5 |
| C | 3 | 234 | 11900 | 87.51 | 561 | 566 | 129.5 |
| C | 3 | 232 | 6168 | 43.25 | 561 | 566 | 129.5 |
| D | 10 | 70 | 302210 | 2102.9 | 561 | 546 | 143.5 |
| D | 10 | 199 | 25322 | 172.71 | 561 | 546 | 143.5 |
| D | 13 | 172 | 22092 | 150.2 | 561 | 546 | 143.5 |
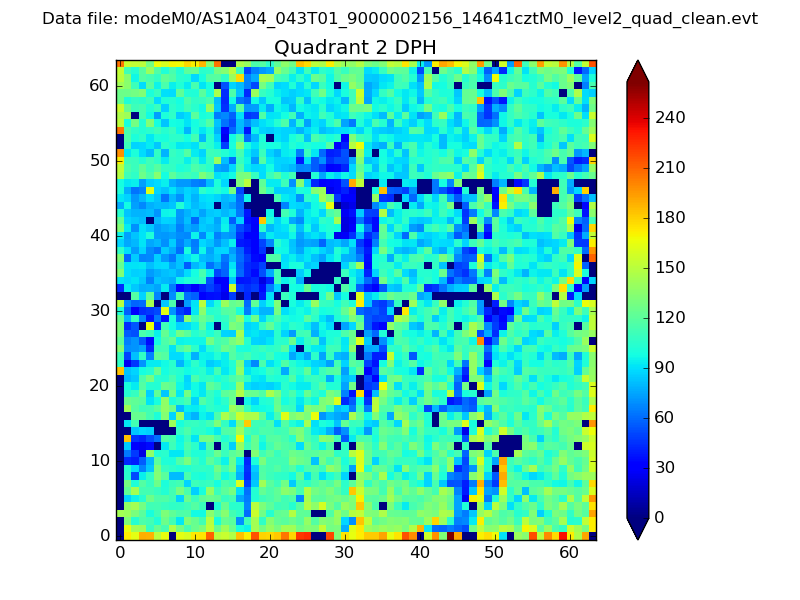
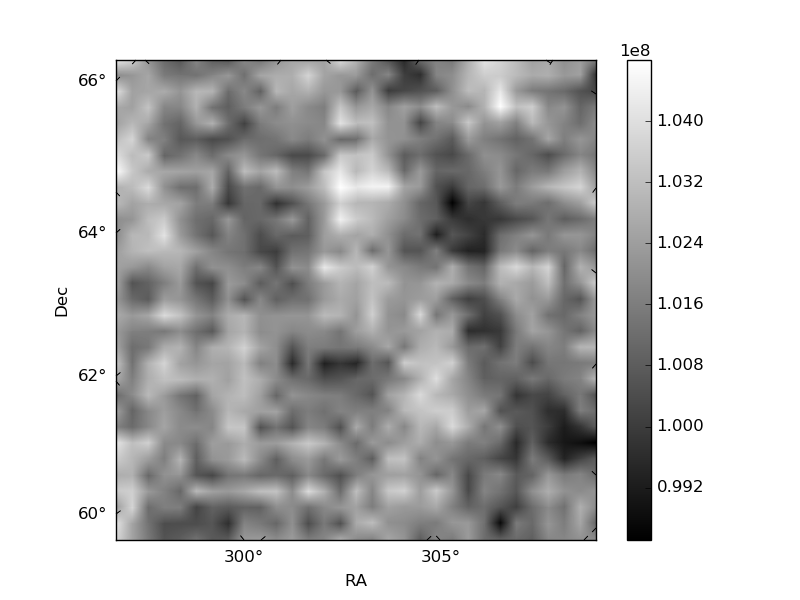
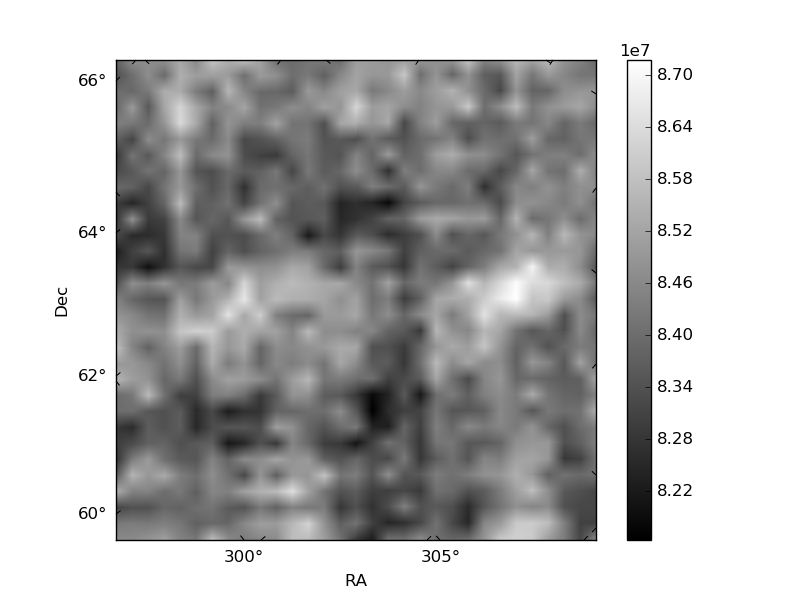
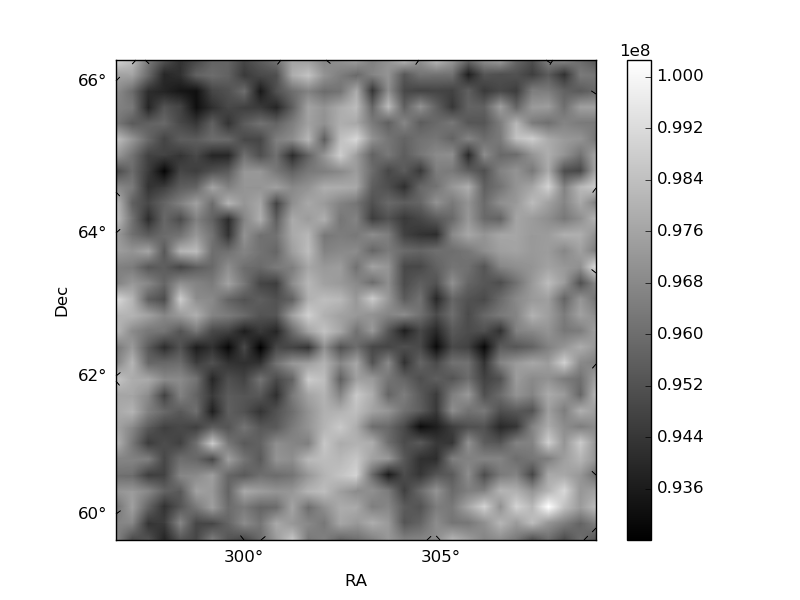
Histogram calculated using DETX and DETY for each event in the final _common_clean file
| Quadrant A | 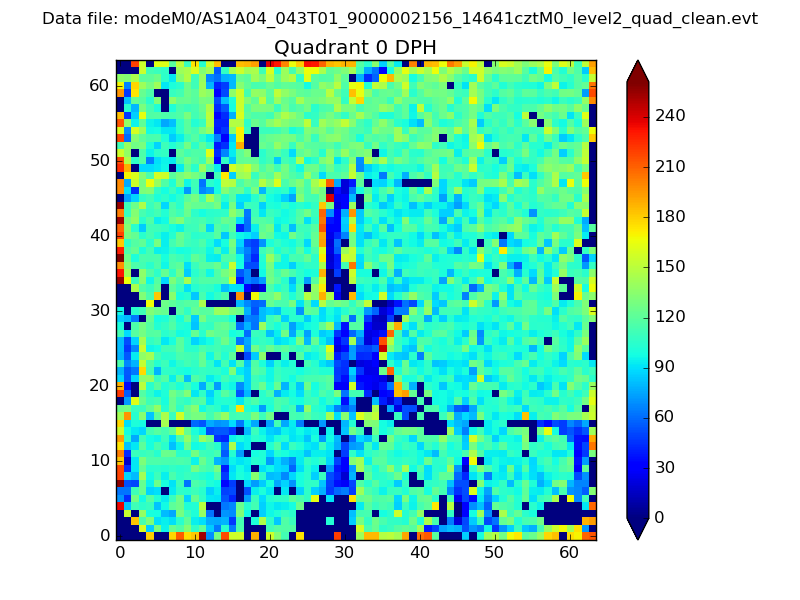 |
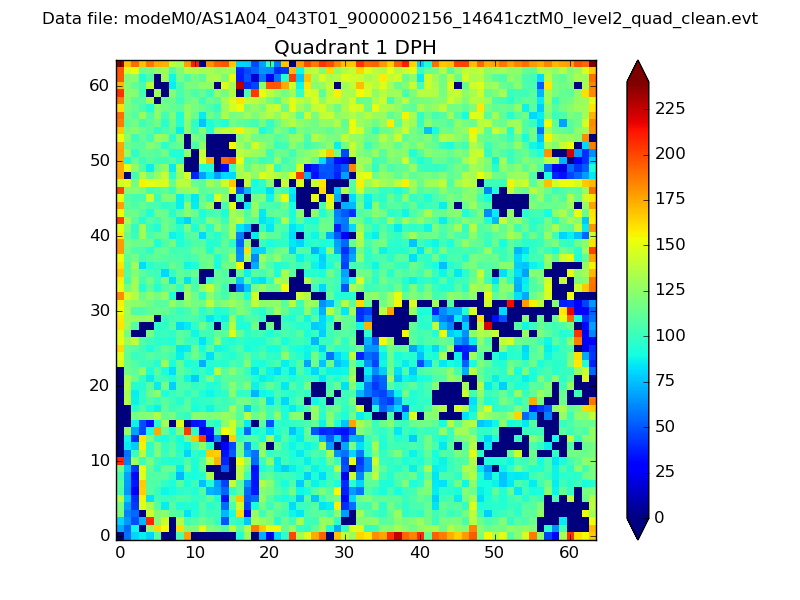 |
Quadrant B |
|---|---|---|---|
| Quadrant D | 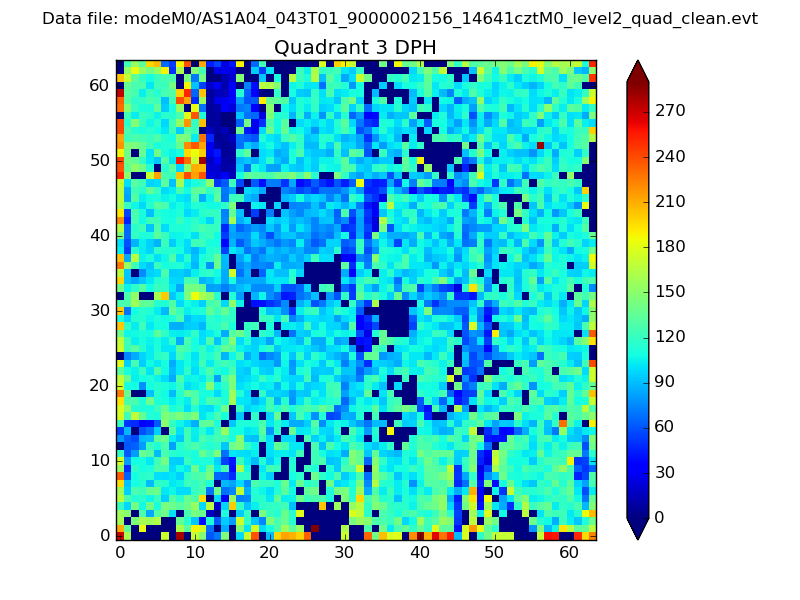 |
 |
Quadrant C |
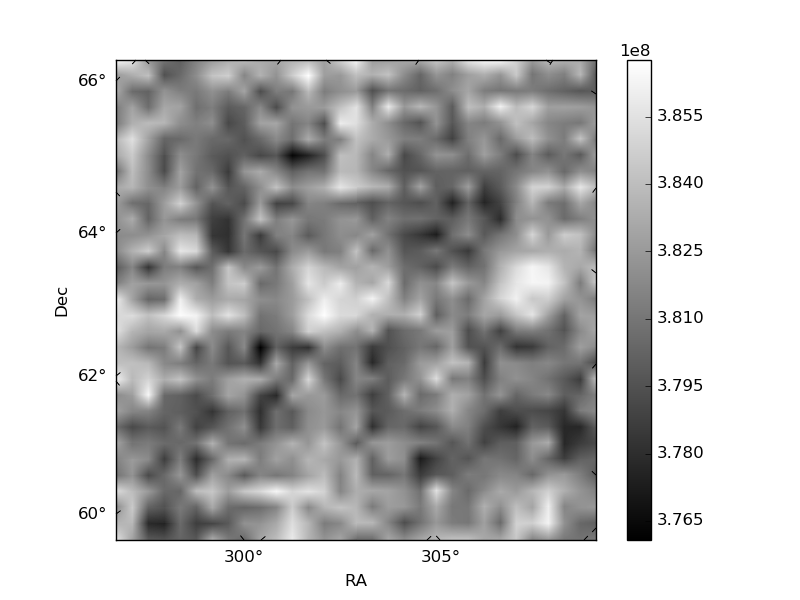
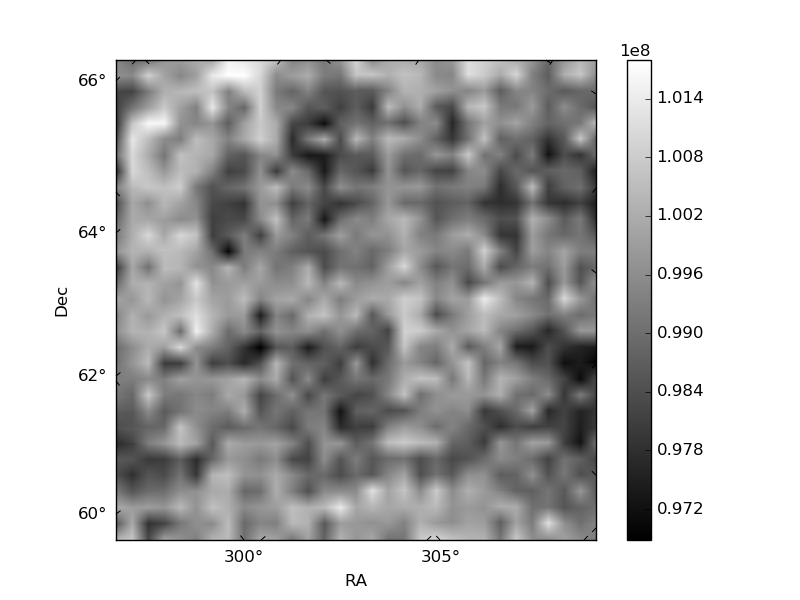
| Plot type | Count rate plots | Images |
|---|---|---|
| Comparison with Poisson distribution Blue bars denote a histogram of data divided into 1 sec bins. Red curve is a Poisson curve with rate = median count rate of data. |
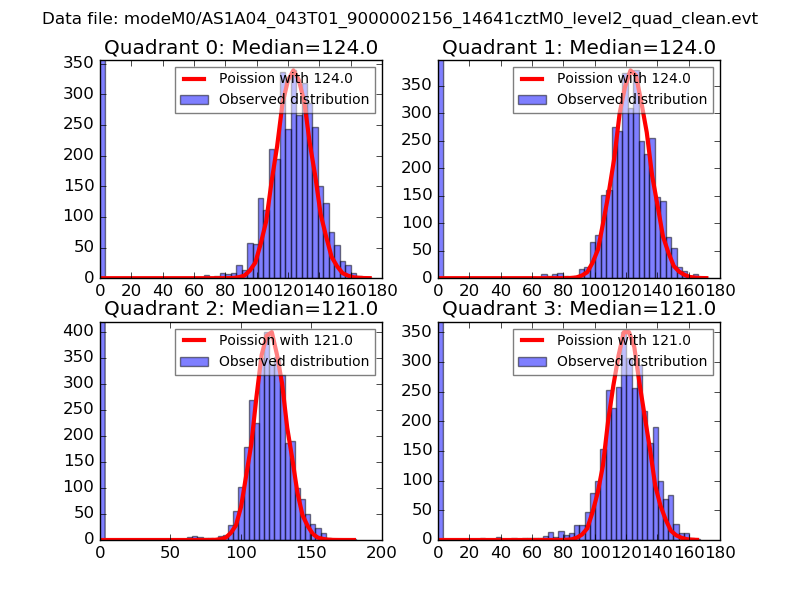 |
 |
| Quadrant-wise count rates Data is divided into 100 sec bins |
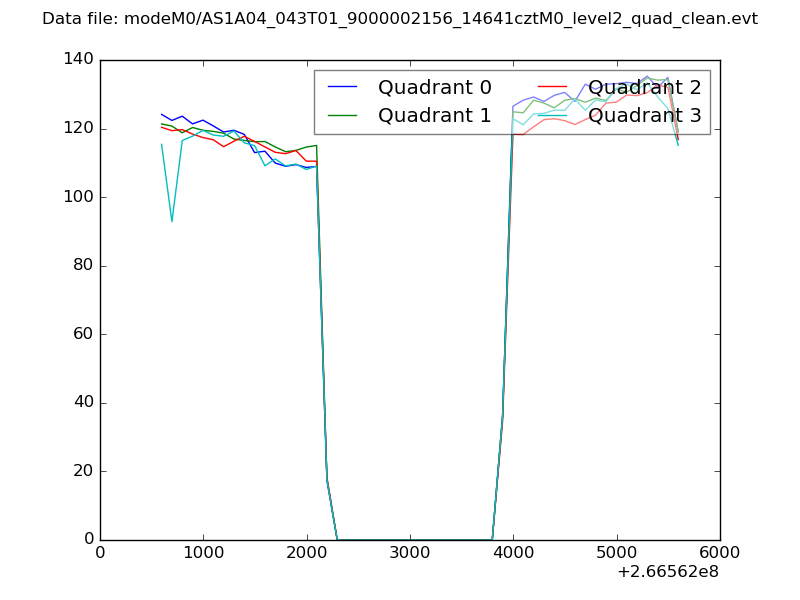 |
|
| Module-wise count rates for Quadrant A Data is divided into 100 sec bins |
 |
 |
| Module-wise count rates for Quadrant B Data is divided into 100 sec bins |
 |
 |
| Module-wise count rates for Quadrant C Data is divided into 100 sec bins |
 |
 |
| Module-wise count rates for Quadrant D Data is divided into 100 sec bins |
 |
 |
| Parameter | Plot |
|---|---|
| CZT HV Monitor |  |
| D_VDD | 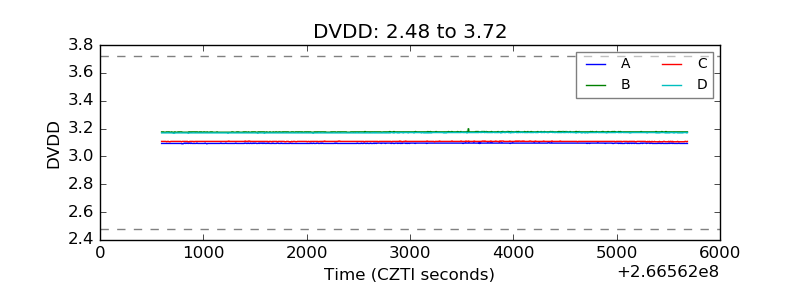 |
| Temperature 1 | 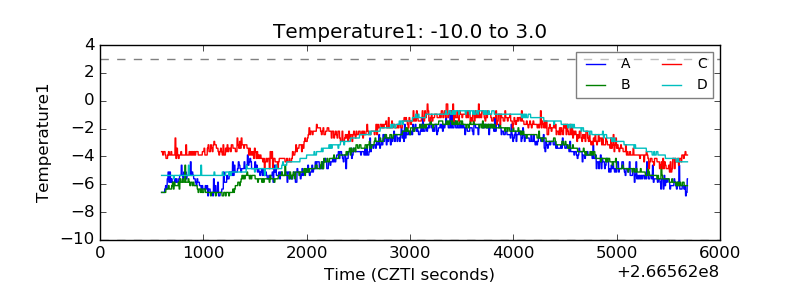 |
| Veto HV Monitor | 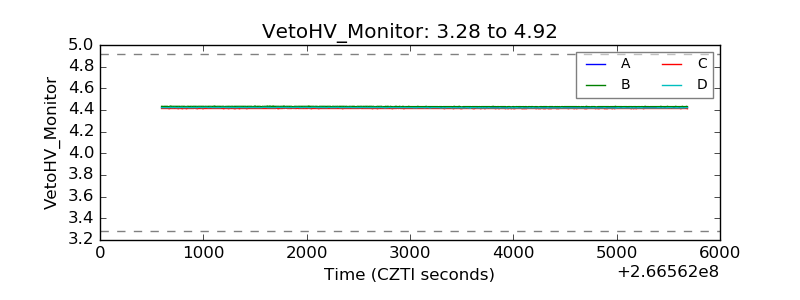 |
| Veto LLD |  |
| Alpha Counter | 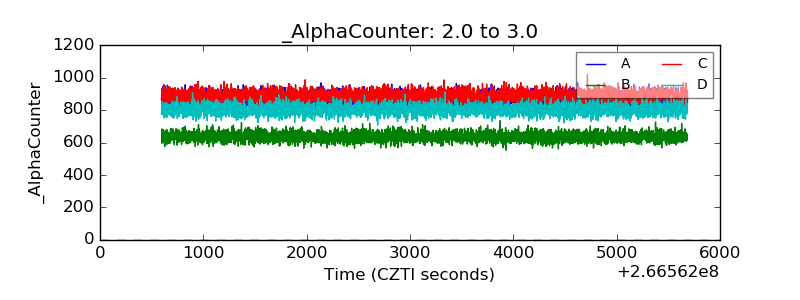 |
| _CPM_Rate | 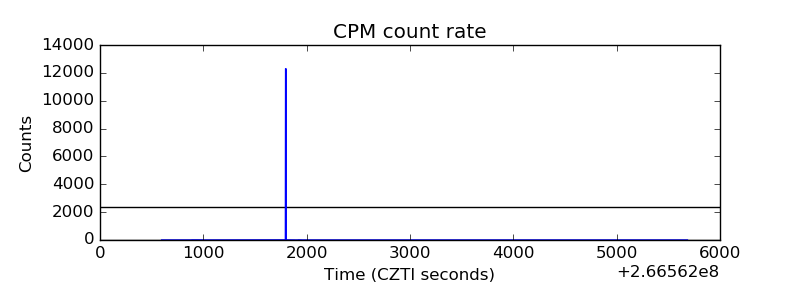 |
| CZT Counter | 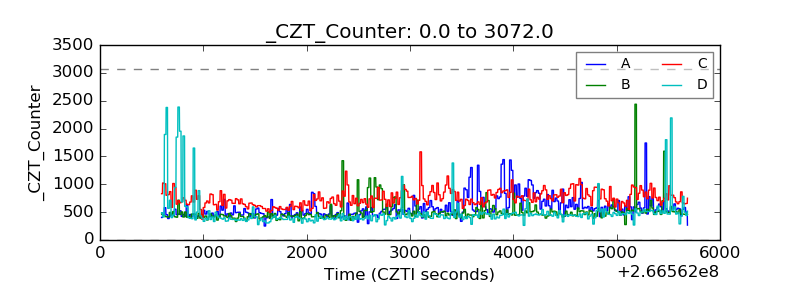 |
| +2.5 Volts monitor |  |
| +5 Volts monitor | 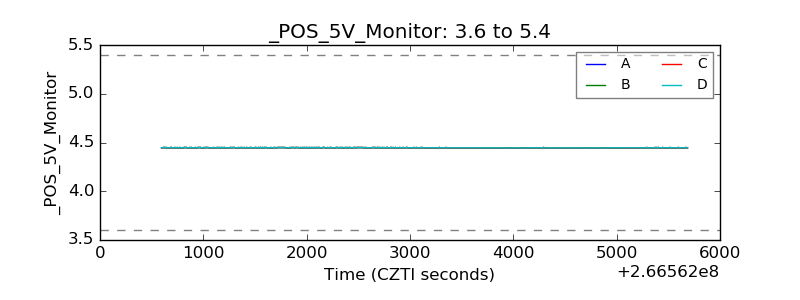 |
| _ROLL_ROT |  |
| _Roll_DEC | 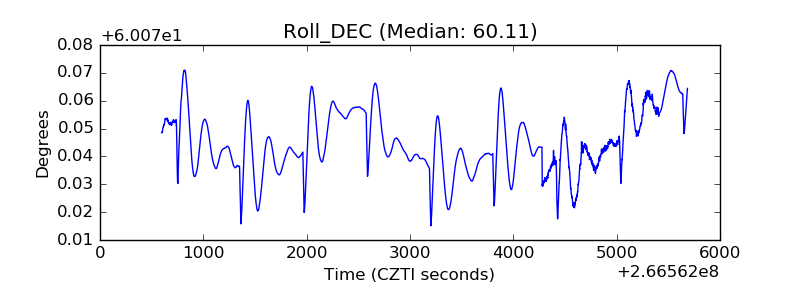 |
| _Roll_RA | 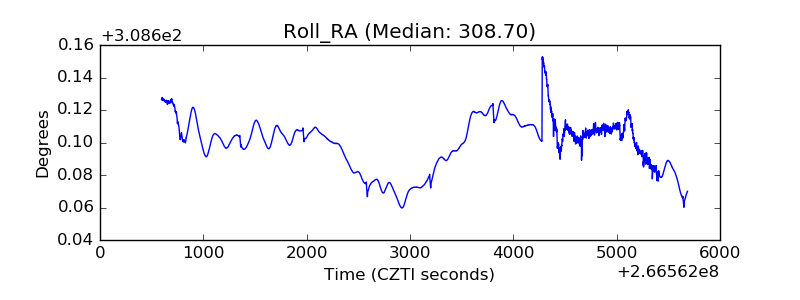 |
| Veto Counter |  |