| Param | Original file | Final file |
|---|---|---|
| Filename | modeM0/AS1A04_075T02_9000002158cztM0_level2.fits | modeM0/AS1A04_075T02_9000002158cztM0_level2_quad_clean.evt |
| Size (bytes) | 86,129,280 | 91,955,520 |
| Size | 82.1 MB | 87.7 MB |
| Events in quadrant A | 513,134 | 556,984 |
| Events in quadrant B | 496,504 | 554,279 |
| Events in quadrant C | 497,130 | 519,619 |
| Events in quadrant D | 441,970 | 493,330 |
| Mode SS | |||
|---|---|---|---|
| Quadrant | BADHDUFLAG | Total packets | Discarded packets |
| A | 0 | 190 | 0 |
| B | 0 | 190 | 0 |
| C | 0 | 190 | 0 |
| D | 0 | 190 | 0 |
| Mode M0 | |||
|---|---|---|---|
| Quadrant | BADHDUFLAG | Total packets | Discarded packets |
| A | 0 | 22336 | 0 |
| B | 0 | 20214 | 0 |
| C | 0 | 28189 | 0 |
| D | 0 | 20297 | 0 |
| Mode M9 | |||
|---|---|---|---|
| Quadrant | BADHDUFLAG | Total packets | Discarded packets |
| A | 0 | 9 | 0 |
| B | 0 | 9 | 0 |
| C | 0 | 9 | 0 |
| D | 0 | 10 | 0 |
| Quadrant | Total seconds | Saturated seconds | Saturation percentage |
|---|---|---|---|
| A | 9520 | 58 | 0.609244% |
| B | 9520 | 77 | 0.808824% |
| C | 9520 | 57 | 0.598739% |
| D | 9520 | 74 | 0.777311% |
Noise dominated data is calculated using 1-second bins in cleaned event files. If a bin has >2000 counts, and if more than 50% of those come from <1% of pixels, then it is considered to be noise-dominated and hence unusable.
| Quadrant | # 1 sec bins | Bins with >0 counts | Bins with >2000 counts | High rate bins dominated by noise | Noise dominated (total time) | Noise dominated (detector-on time) | Marked lightcurve |
|---|---|---|---|---|---|---|---|
| A | 10229 | 9518 | 0 | 0 | 0.00% | 0.00% |  |
| B | 10229 | 9518 | 0 | 0 | 0.00% | 0.00% |  |
| C | 10229 | 9519 | 0 | 0 | 0.00% | 0.00% |  |
| D | 10229 | 9518 | 0 | 0 | 0.00% | 0.00% |  |
Top three noisy pixels from each quadrant. If the there are fewer than three noisy pixels in the level2.evt file, extra rows are filled as -1
| Pixel properties | Quadrant properties | ||||||
|---|---|---|---|---|---|---|---|
| Quadrant | DetID | PixID | Counts | Sigma | Mean | Median | Sigma |
| A | 14 | 188 | 552 | 12.01 | 133 | 125 | 35.6 |
| A | 0 | 29 | 505 | 10.69 | 133 | 125 | 35.6 |
| A | 7 | 110 | 444 | 8.97 | 133 | 125 | 35.6 |
| B | 2 | 9 | 433 | 11.03 | 131 | 124 | 28.0 |
| B | 14 | 254 | 377 | 9.03 | 131 | 124 | 28.0 |
| B | 3 | 80 | 334 | 7.5 | 131 | 124 | 28.0 |
| C | 3 | 126 | 363 | 6.71 | 131 | 122 | 35.9 |
| C | 12 | 241 | 358 | 6.57 | 131 | 122 | 35.9 |
| C | 7 | 111 | 334 | 5.9 | 131 | 122 | 35.9 |
| D | 4 | 160 | 351 | 6.57 | 126 | 114 | 36.1 |
| D | 7 | 3 | 343 | 6.35 | 126 | 114 | 36.1 |
| D | 10 | 189 | 322 | 5.77 | 126 | 114 | 36.1 |
Histogram calculated using DETX and DETY for each event in the final _common_clean file
| Quadrant A | 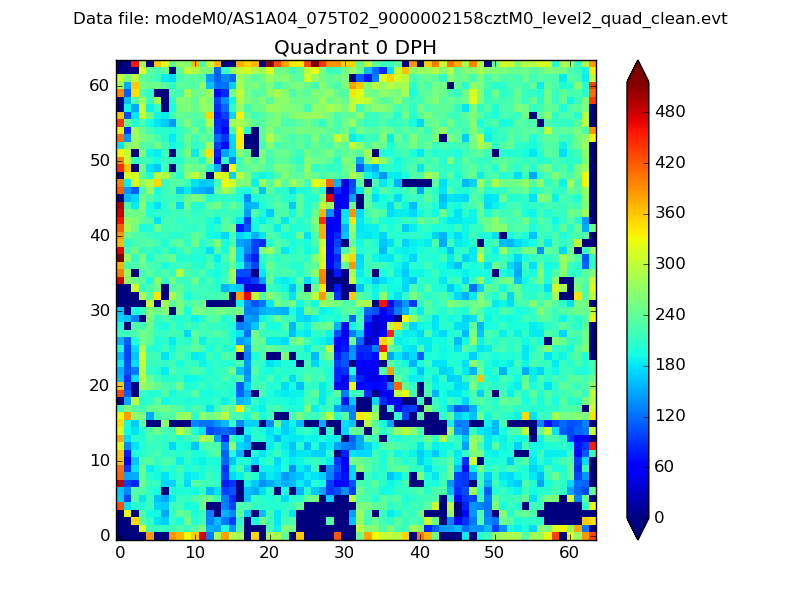 |
 |
Quadrant B |
|---|---|---|---|
| Quadrant D |  |
 |
Quadrant C |
| Plot type | Count rate plots | Images |
|---|---|---|
| Comparison with Poisson distribution Blue bars denote a histogram of data divided into 1 sec bins. Red curve is a Poisson curve with rate = median count rate of data. |
 |
 |
| Quadrant-wise count rates Data is divided into 100 sec bins |
 |
|
| Module-wise count rates for Quadrant A Data is divided into 100 sec bins |
 |
 |
| Module-wise count rates for Quadrant B Data is divided into 100 sec bins |
 |
 |
| Module-wise count rates for Quadrant C Data is divided into 100 sec bins |
 |
 |
| Module-wise count rates for Quadrant D Data is divided into 100 sec bins |
 |
 |
| Parameter | Plot |
|---|---|
| CZT HV Monitor |  |
| D_VDD |  |
| Temperature 1 |  |
| Veto HV Monitor |  |
| Veto LLD |  |
| Alpha Counter |  |
| _CPM_Rate |  |
| CZT Counter |  |
| +2.5 Volts monitor |  |
| +5 Volts monitor |  |
| _ROLL_ROT |  |
| _Roll_DEC |  |
| _Roll_RA |  |
| Veto Counter |  |