| Param | Original file | Final file |
|---|---|---|
| Filename | modeM0/AS1A04_075T02_9000002158_14641cztM0_level2.evt | modeM0/AS1A04_075T02_9000002158_14641cztM0_level2_quad_clean.evt |
| Size (bytes) | 7,894,080 | 1,828,800 |
| Size | 7.5 MB | 1.7 MB |
| Events in quadrant A | 55,389 | 9,955 |
| Events in quadrant B | 53,274 | 10,278 |
| Events in quadrant C | 68,078 | 10,239 |
| Events in quadrant D | 53,133 | 10,157 |
| Mode SS | |||
|---|---|---|---|
| Quadrant | BADHDUFLAG | Total packets | Discarded packets |
| A | 0 | 4 | 0 |
| B | 0 | 4 | 0 |
| C | 0 | 4 | 0 |
| D | 0 | 4 | 0 |
| Mode M0 | |||
|---|---|---|---|
| Quadrant | BADHDUFLAG | Total packets | Discarded packets |
| A | 0 | 225 | 0 |
| B | 0 | 220 | 0 |
| C | 0 | 257 | 0 |
| D | 0 | 215 | 0 |
| Mode M9 | |||
|---|---|---|---|
| Quadrant | BADHDUFLAG | Total packets | Discarded packets |
| A | 0 | 3 | 0 |
| B | 0 | 2 | 0 |
| C | 0 | 2 | 0 |
| D | 0 | 2 | 0 |
| Quadrant | Total seconds | Saturated seconds | Saturation percentage |
|---|---|---|---|
| A | 77 | 30 | 38.961039% |
| B | 77 | 29 | 37.662338% |
| C | 77 | 14 | 18.181818% |
| D | 77 | 20 | 25.974026% |
Noise dominated data is calculated using 1-second bins in cleaned event files. If a bin has >2000 counts, and if more than 50% of those come from <1% of pixels, then it is considered to be noise-dominated and hence unusable.
| Quadrant | # 1 sec bins | Bins with >0 counts | Bins with >2000 counts | High rate bins dominated by noise | Noise dominated (total time) | Noise dominated (detector-on time) | Marked lightcurve |
|---|---|---|---|---|---|---|---|
| A | 78 | 78 | 0 | 0 | 0.00% | 0.00% |  |
| B | 78 | 78 | 0 | 0 | 0.00% | 0.00% | 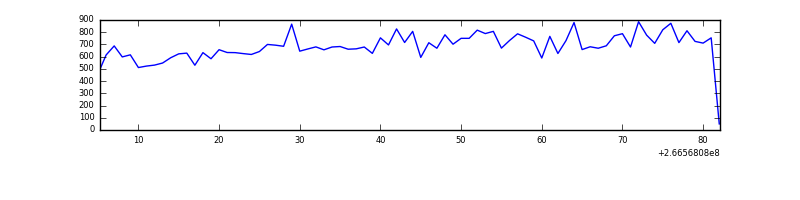 |
| C | 78 | 78 | 0 | 0 | 0.00% | 0.00% | 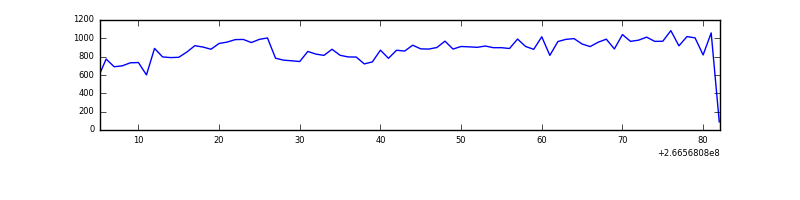 |
| D | 77 | 77 | 0 | 0 | 0.00% | 0.00% | 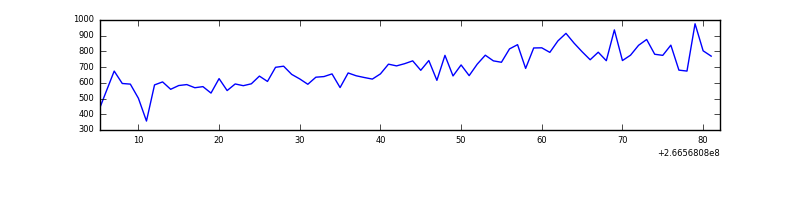 |
Top three noisy pixels from each quadrant. If the there are fewer than three noisy pixels in the level2.evt file, extra rows are filled as -1
| Pixel properties | Quadrant properties | ||||||
|---|---|---|---|---|---|---|---|
| Quadrant | DetID | PixID | Counts | Sigma | Mean | Median | Sigma |
| A | 1 | 162 | 1294 | 257.54 | 13 | 13 | 5.0 |
| A | 1 | 178 | 501 | 98.11 | 13 | 13 | 5.0 |
| A | 1 | 161 | 446 | 87.05 | 13 | 13 | 5.0 |
| B | 12 | 111 | 399 | 81.67 | 13 | 13 | 4.7 |
| B | 11 | 111 | 320 | 64.96 | 13 | 13 | 4.7 |
| B | 14 | 111 | 241 | 48.24 | 13 | 13 | 4.7 |
| C | 3 | 233 | 16567 | 3395.49 | 13 | 13 | 4.9 |
| C | 3 | 234 | 184 | 35.07 | 13 | 13 | 4.9 |
| C | 3 | 232 | 94 | 16.61 | 13 | 13 | 4.9 |
| D | 2 | 152 | 368 | 68.58 | 13 | 13 | 5.2 |
| D | 2 | 234 | 296 | 54.67 | 13 | 13 | 5.2 |
| D | 10 | 70 | 182 | 32.65 | 13 | 13 | 5.2 |
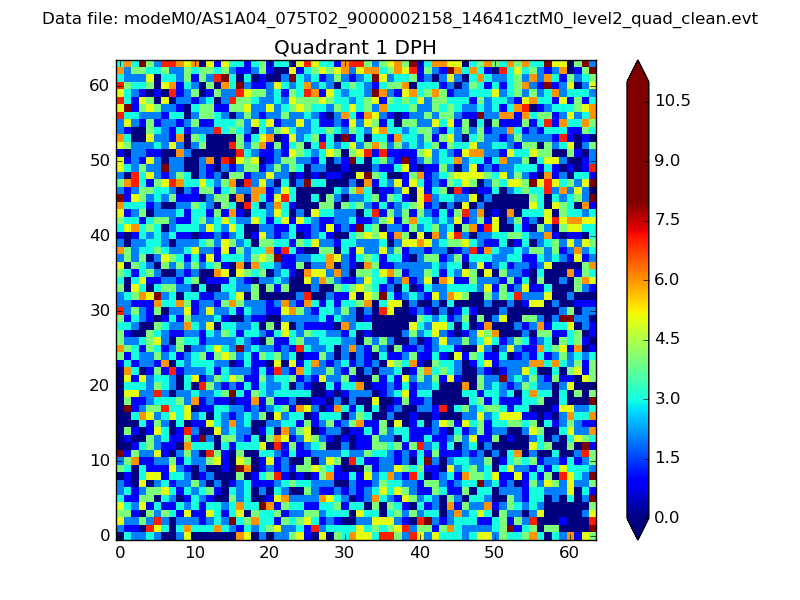
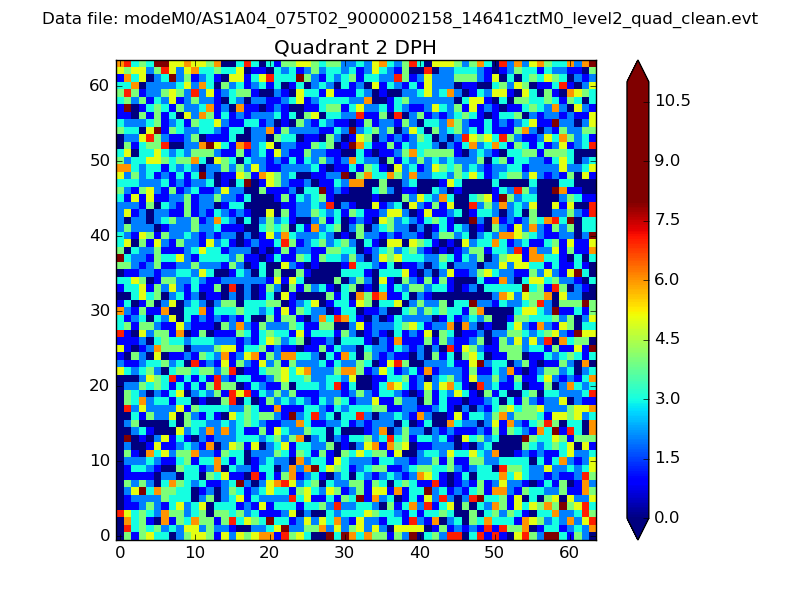
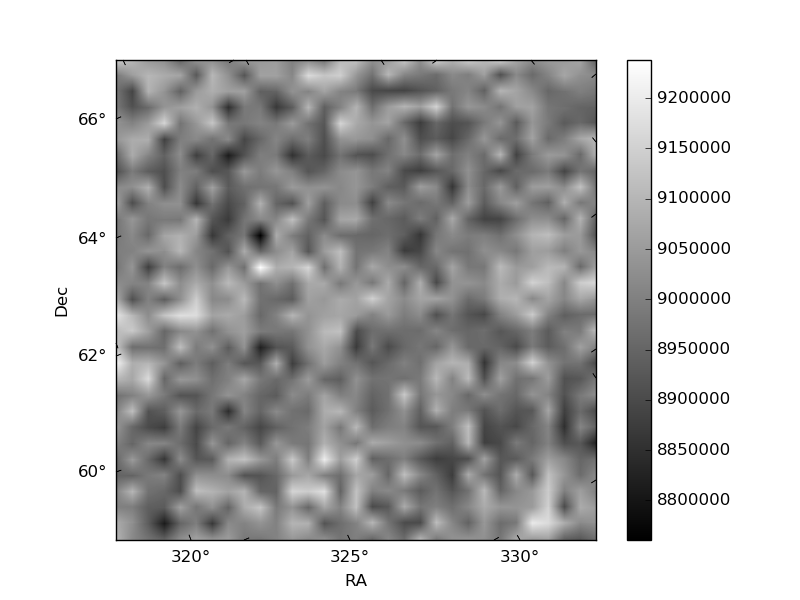
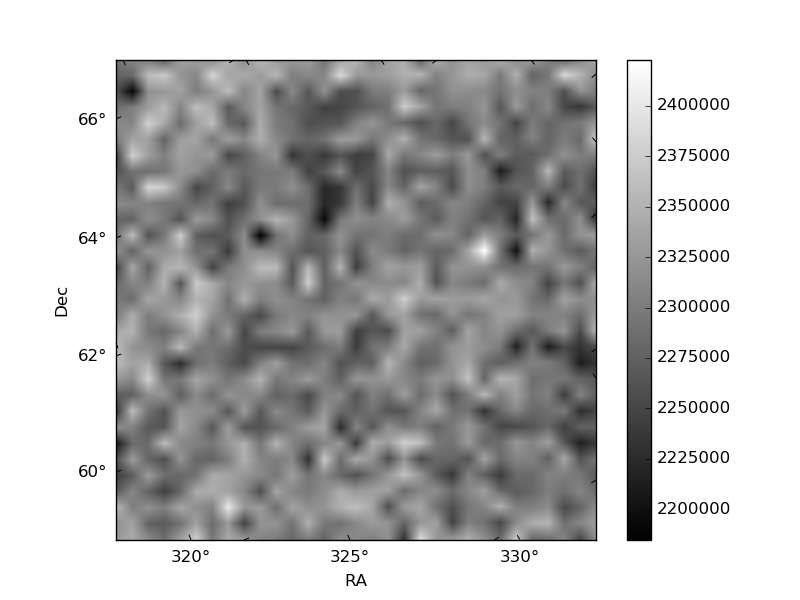
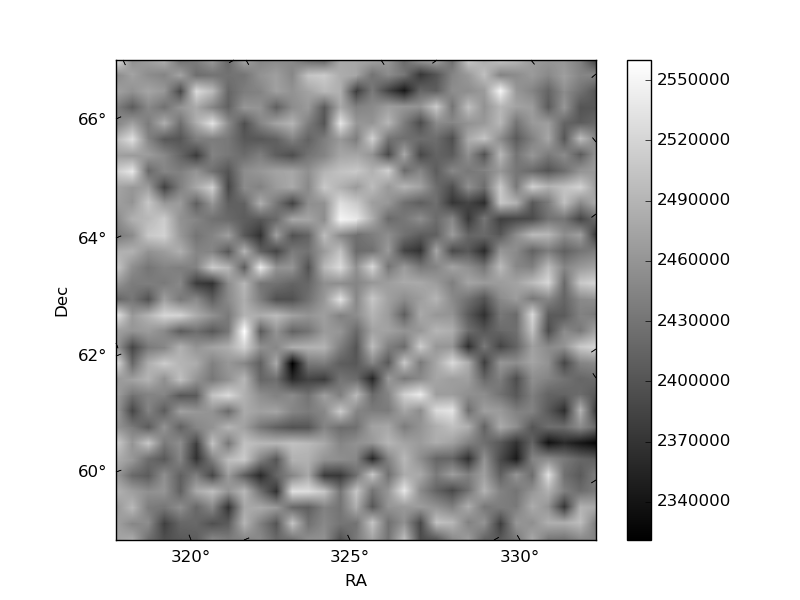
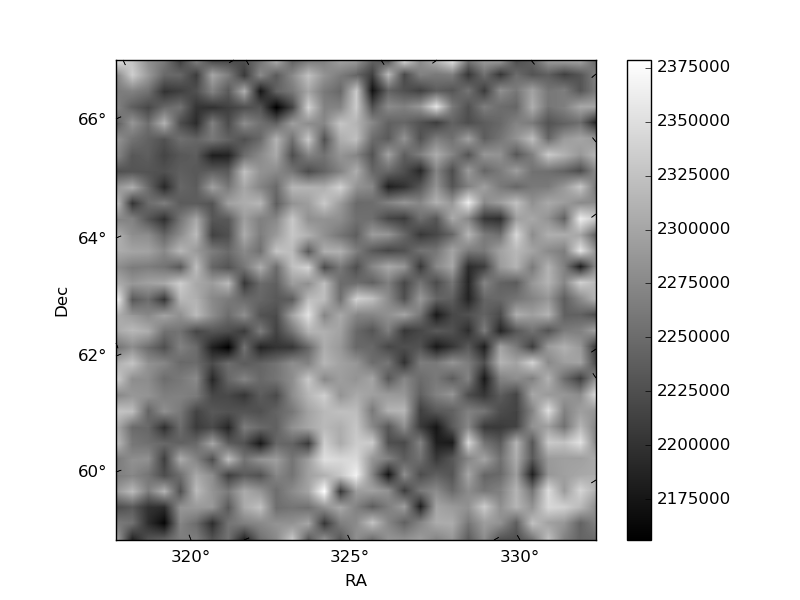
Histogram calculated using DETX and DETY for each event in the final _common_clean file
| Quadrant A | 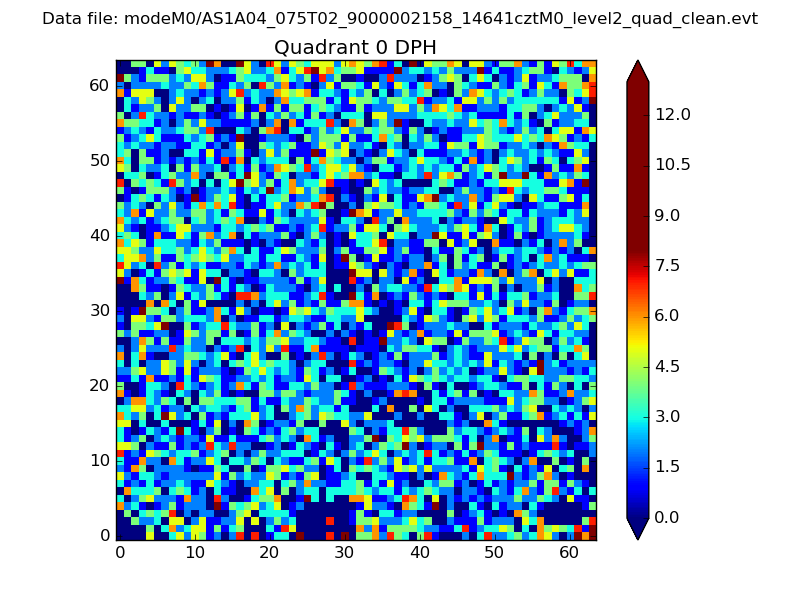 |
 |
Quadrant B |
|---|---|---|---|
| Quadrant D | 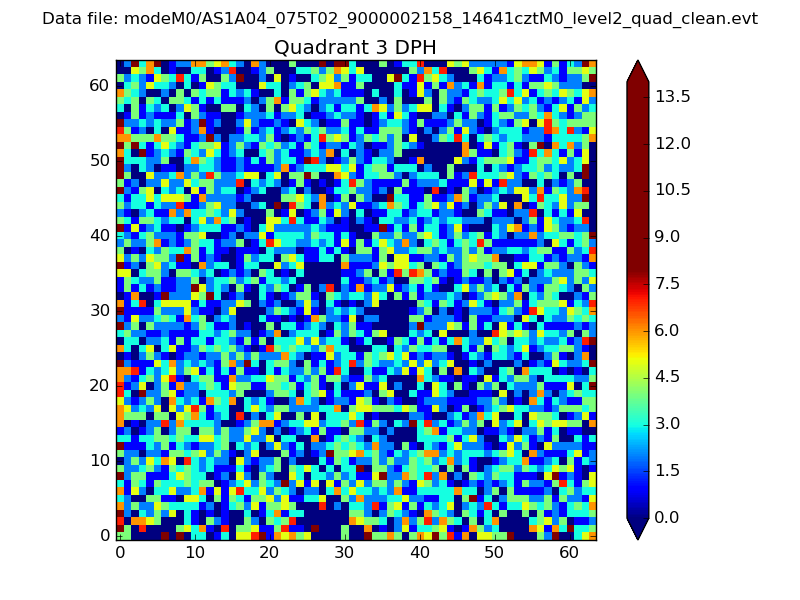 |
 |
Quadrant C |
| Plot type | Count rate plots | Images |
|---|---|---|
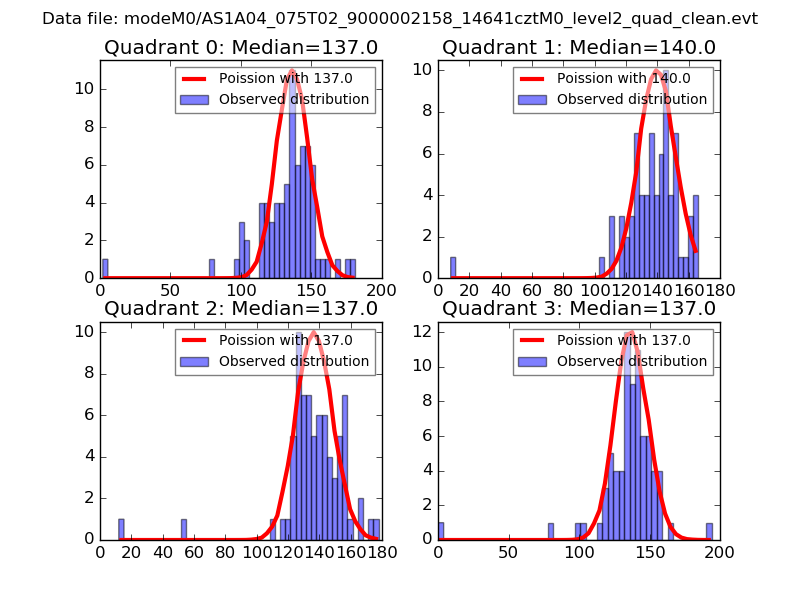
| Comparison with Poisson distribution Blue bars denote a histogram of data divided into 1 sec bins. Red curve is a Poisson curve with rate = median count rate of data. |
 |
 |
| Quadrant-wise count rates Data is divided into 100 sec bins |
 |
|
| Module-wise count rates for Quadrant A Data is divided into 100 sec bins |
 |
 |
| Module-wise count rates for Quadrant B Data is divided into 100 sec bins |
 |
 |
| Module-wise count rates for Quadrant C Data is divided into 100 sec bins |
 |
 |
| Module-wise count rates for Quadrant D Data is divided into 100 sec bins |
 |
 |
| Parameter | Plot |
|---|---|
| CZT HV Monitor | 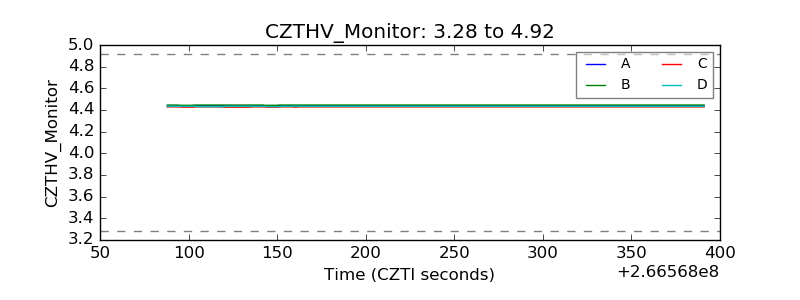 |
| D_VDD | 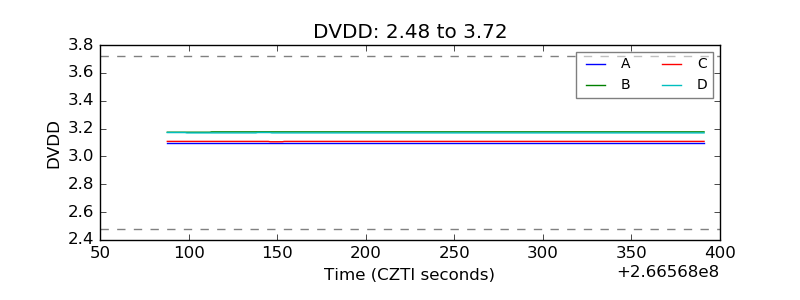 |
| Temperature 1 | 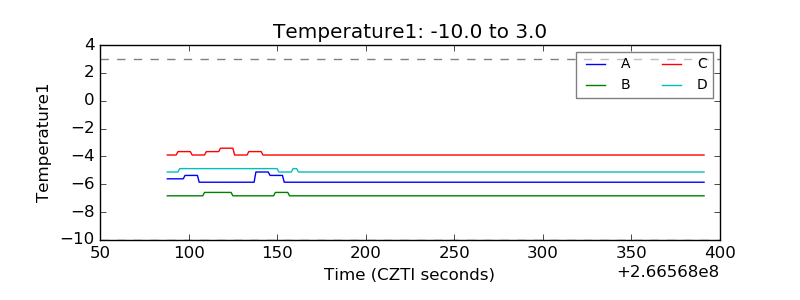 |
| Veto HV Monitor | 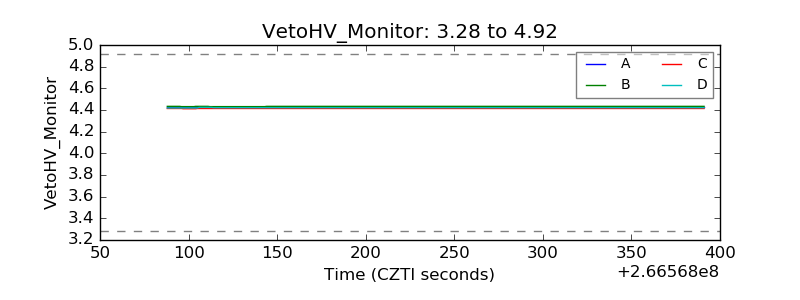 |
| Veto LLD | 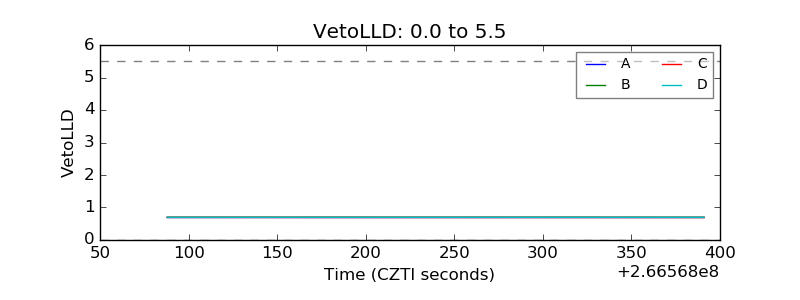 |
| Alpha Counter | 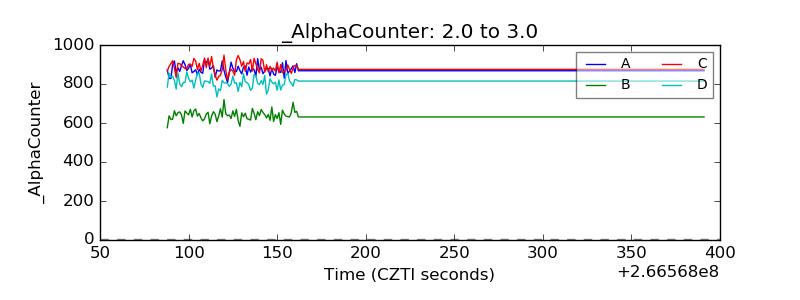 |
| _CPM_Rate | 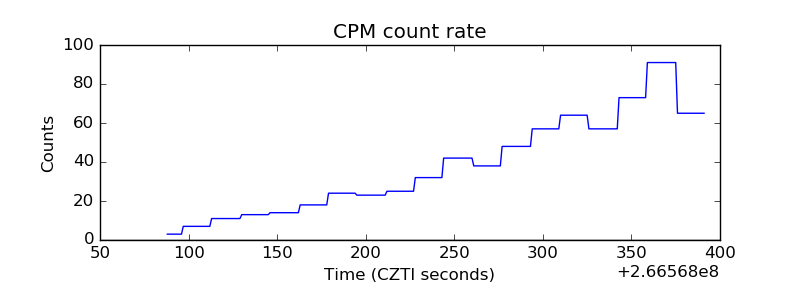 |
| CZT Counter | 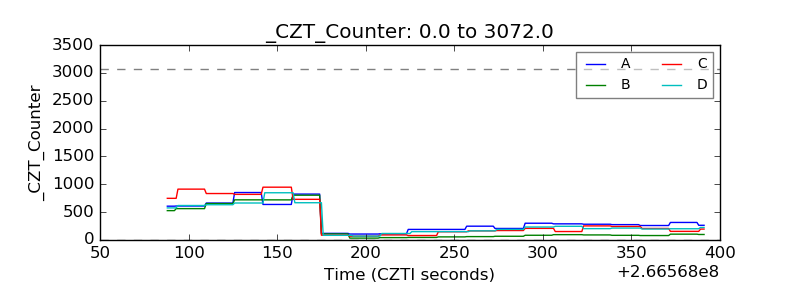 |
| +2.5 Volts monitor |  |
| +5 Volts monitor |  |
| _ROLL_ROT | 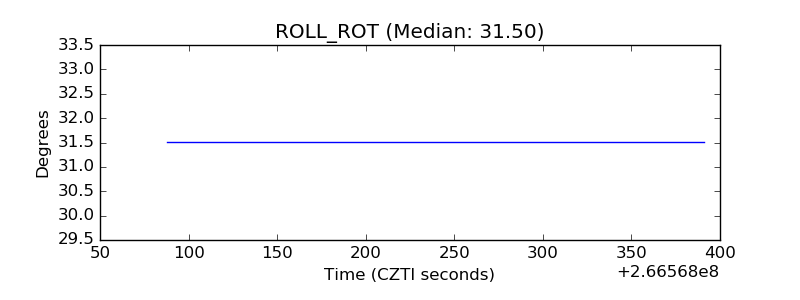 |
| _Roll_DEC | 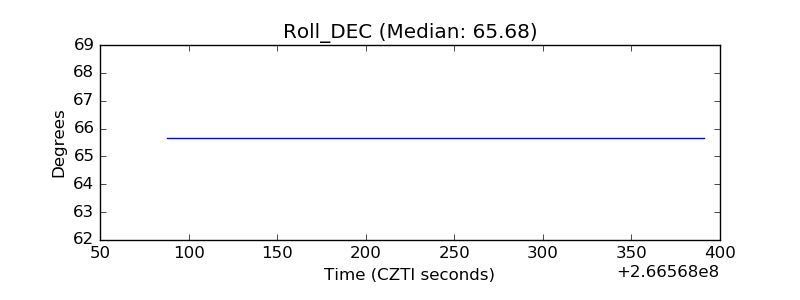 |
| _Roll_RA | 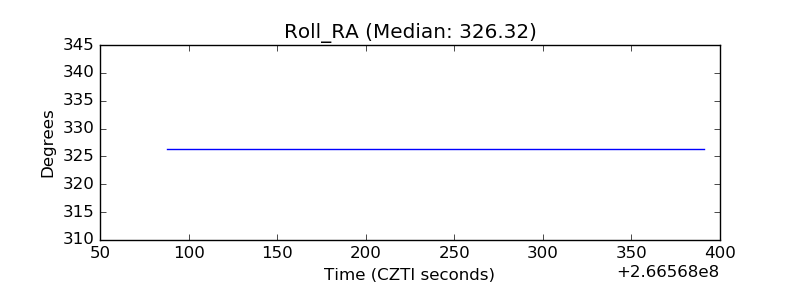 |
| Veto Counter | 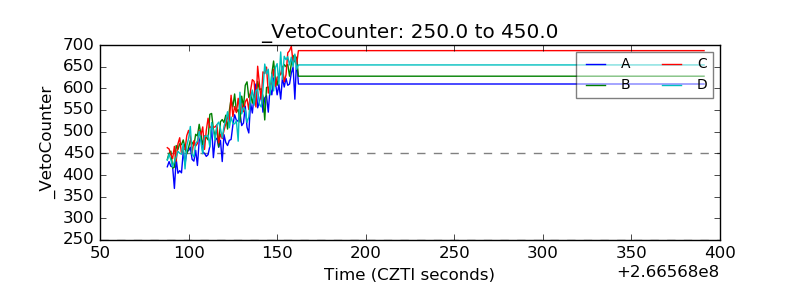 |