| Param | Original file | Final file |
|---|---|---|
| Filename | modeM0/AS1A04_075T02_9000002158_14642cztM0_level2.evt | modeM0/AS1A04_075T02_9000002158_14642cztM0_level2_quad_clean.evt |
| Size (bytes) | 739,002,240 | 128,266,560 |
| Size | 704.8 MB | 122.3 MB |
| Events in quadrant A | 5,481,050 | 814,756 |
| Events in quadrant B | 4,709,967 | 820,706 |
| Events in quadrant C | 7,030,884 | 797,475 |
| Events in quadrant D | 4,515,254 | 791,893 |
| Mode SS | |||
|---|---|---|---|
| Quadrant | BADHDUFLAG | Total packets | Discarded packets |
| A | 0 | 190 | 0 |
| B | 0 | 190 | 0 |
| C | 0 | 190 | 0 |
| D | 0 | 190 | 0 |
| Mode M0 | |||
|---|---|---|---|
| Quadrant | BADHDUFLAG | Total packets | Discarded packets |
| A | 0 | 22338 | 2 |
| B | 0 | 20216 | 2 |
| C | 0 | 28191 | 2 |
| D | 0 | 20299 | 2 |
| Mode M9 | |||
|---|---|---|---|
| Quadrant | BADHDUFLAG | Total packets | Discarded packets |
| A | 0 | 9 | 0 |
| B | 0 | 9 | 0 |
| C | 0 | 9 | 0 |
| D | 0 | 10 | 0 |
| Quadrant | Total seconds | Saturated seconds | Saturation percentage |
|---|---|---|---|
| A | 9520 | 58 | 0.609244% |
| B | 9520 | 77 | 0.808824% |
| C | 9520 | 57 | 0.598739% |
| D | 9520 | 74 | 0.777311% |
Noise dominated data is calculated using 1-second bins in cleaned event files. If a bin has >2000 counts, and if more than 50% of those come from <1% of pixels, then it is considered to be noise-dominated and hence unusable.
| Quadrant | # 1 sec bins | Bins with >0 counts | Bins with >2000 counts | High rate bins dominated by noise | Noise dominated (total time) | Noise dominated (detector-on time) | Marked lightcurve |
|---|---|---|---|---|---|---|---|
| A | 10231 | 9521 | 0 | 0 | 0.00% | 0.00% | 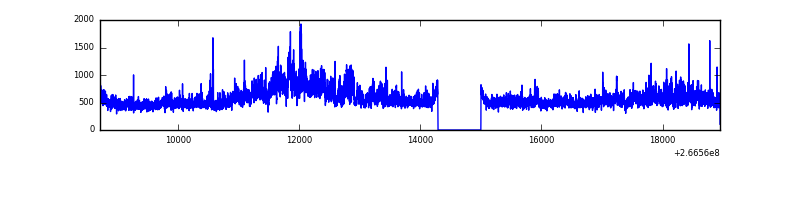 |
| B | 10231 | 9522 | 24 | 24 | 0.23% | 0.25% | 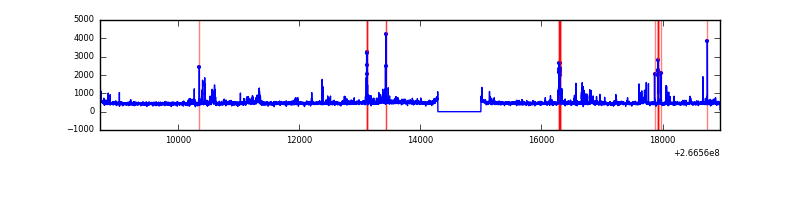 |
| C | 10231 | 9522 | 2 | 2 | 0.02% | 0.02% | 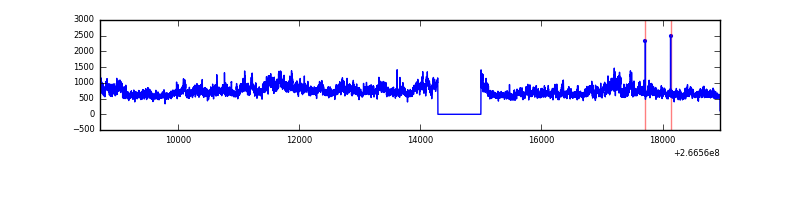 |
| D | 10231 | 9522 | 50 | 50 | 0.49% | 0.53% | 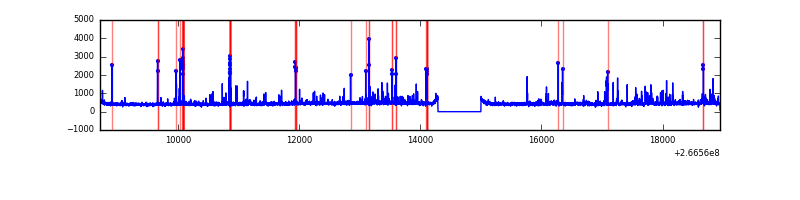 |
Top three noisy pixels from each quadrant. If the there are fewer than three noisy pixels in the level2.evt file, extra rows are filled as -1
| Pixel properties | Quadrant properties | ||||||
|---|---|---|---|---|---|---|---|
| Quadrant | DetID | PixID | Counts | Sigma | Mean | Median | Sigma |
| A | 0 | 23 | 443952 | 1984.97 | 1097 | 1073 | 223.1 |
| A | 8 | 15 | 211443 | 942.87 | 1097 | 1073 | 223.1 |
| A | 1 | 162 | 174693 | 778.16 | 1097 | 1073 | 223.1 |
| B | 10 | 16 | 90905 | 437.73 | 1092 | 1064 | 205.2 |
| B | 10 | 246 | 76053 | 365.37 | 1092 | 1064 | 205.2 |
| B | 0 | 219 | 52662 | 251.4 | 1092 | 1064 | 205.2 |
| C | 3 | 233 | 2875211 | 11886.1 | 1051 | 1055 | 241.8 |
| C | 3 | 234 | 22249 | 87.65 | 1051 | 1055 | 241.8 |
| C | 8 | 128 | 11228 | 42.07 | 1051 | 1055 | 241.8 |
| D | 12 | 110 | 154256 | 595.08 | 1057 | 1028 | 257.5 |
| D | 10 | 199 | 97447 | 374.46 | 1057 | 1028 | 257.5 |
| D | 10 | 70 | 65856 | 251.77 | 1057 | 1028 | 257.5 |
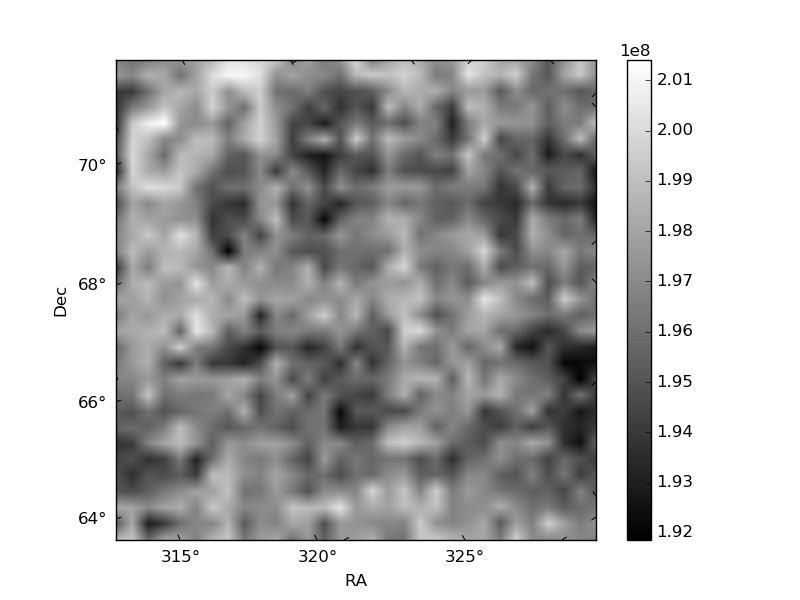
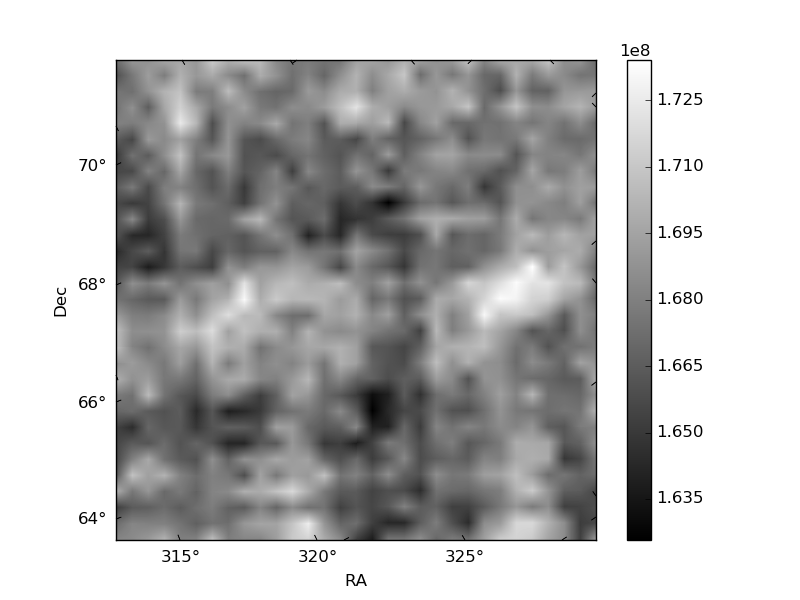
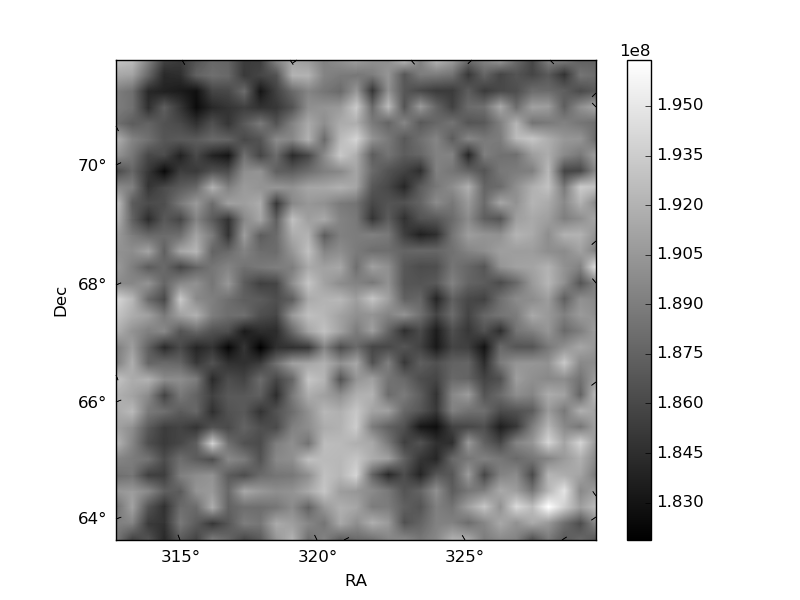
Histogram calculated using DETX and DETY for each event in the final _common_clean file
| Quadrant A |  |
 |
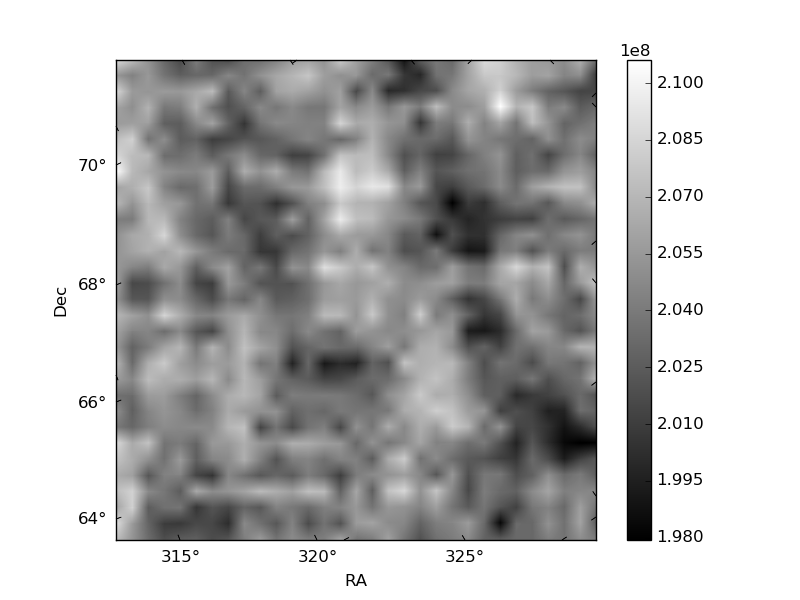
Quadrant B |
|---|---|---|---|
| Quadrant D | 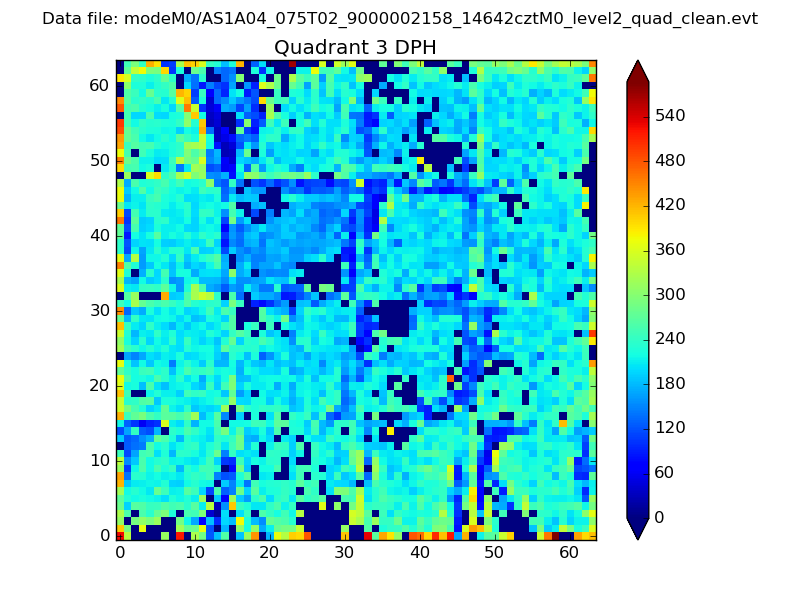 |
 |
Quadrant C |
| Plot type | Count rate plots | Images |
|---|---|---|
| Comparison with Poisson distribution Blue bars denote a histogram of data divided into 1 sec bins. Red curve is a Poisson curve with rate = median count rate of data. |
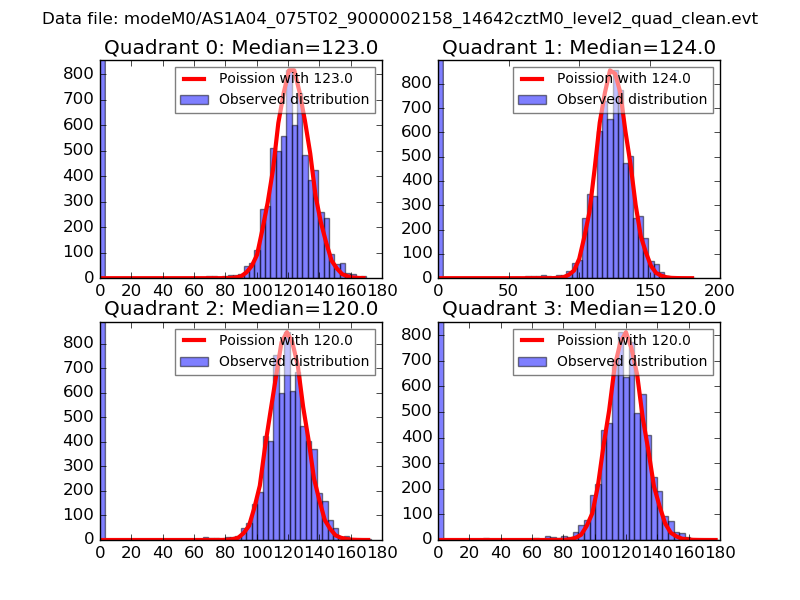 |
 |
| Quadrant-wise count rates Data is divided into 100 sec bins |
 |
|
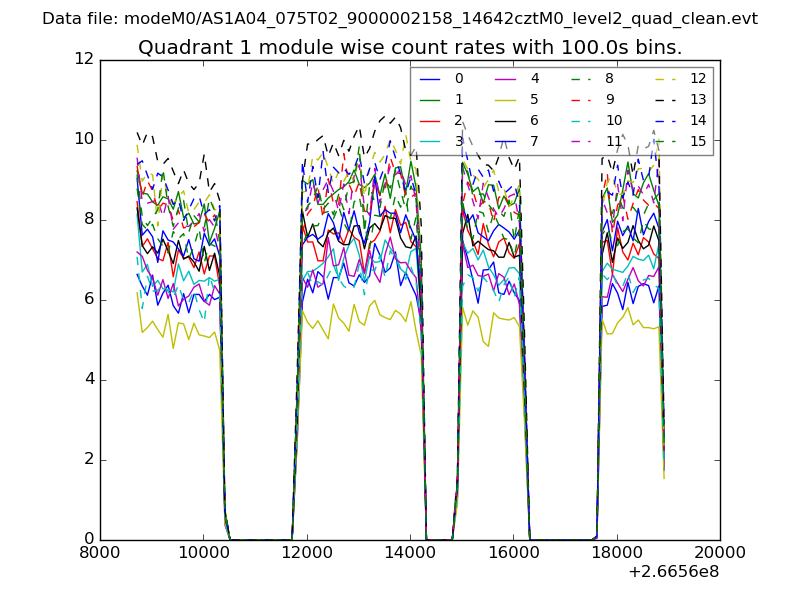
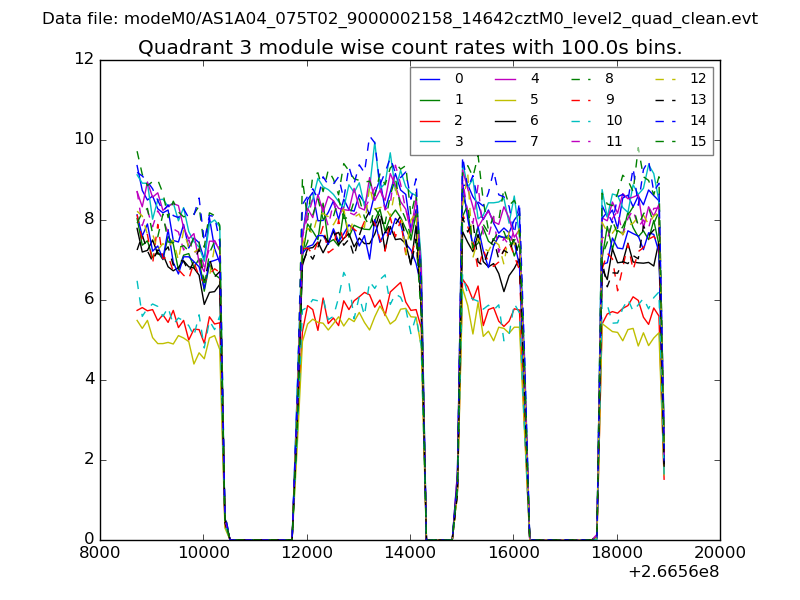
| Module-wise count rates for Quadrant A Data is divided into 100 sec bins |
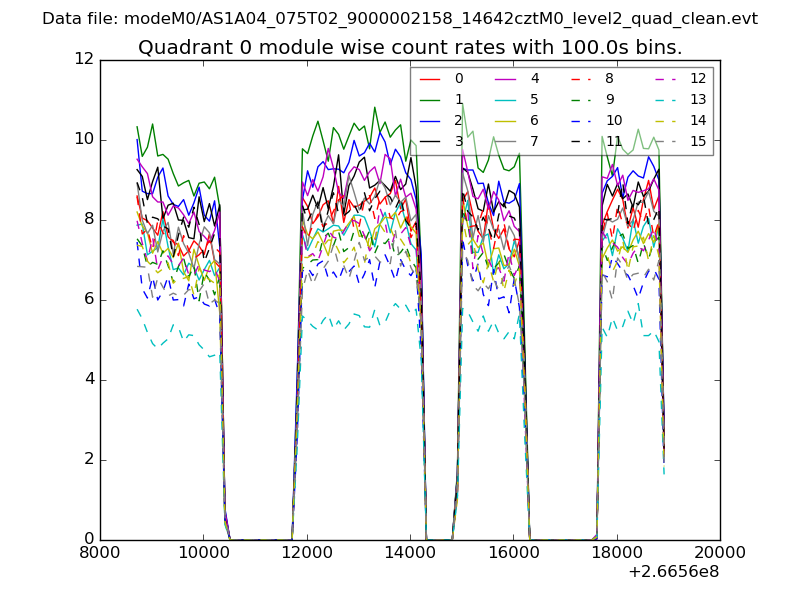 |
 |
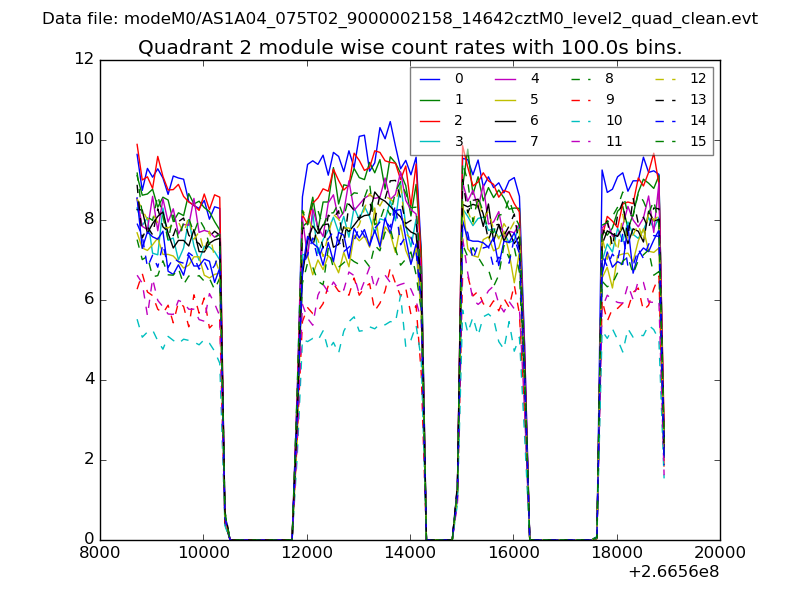
| Module-wise count rates for Quadrant B Data is divided into 100 sec bins |
 |
 |
| Module-wise count rates for Quadrant C Data is divided into 100 sec bins |
 |
 |
| Module-wise count rates for Quadrant D Data is divided into 100 sec bins |
 |
 |
| Parameter | Plot |
|---|---|
| CZT HV Monitor | 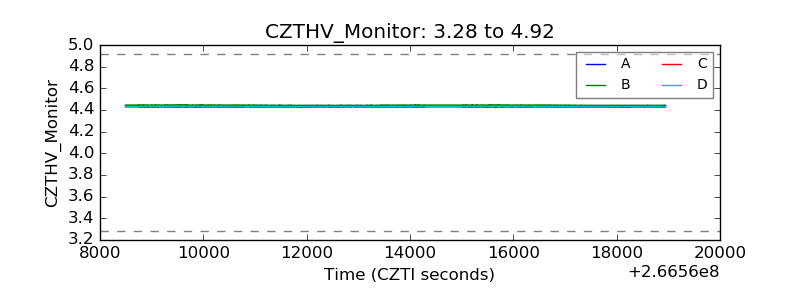 |
| D_VDD | 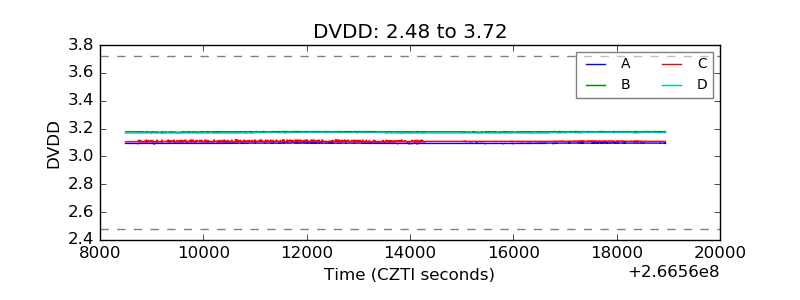 |
| Temperature 1 | 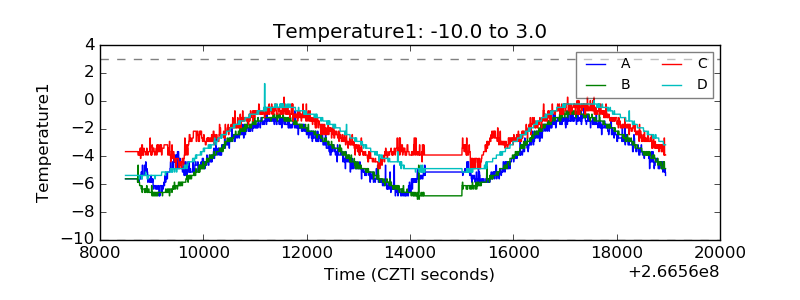 |
| Veto HV Monitor | 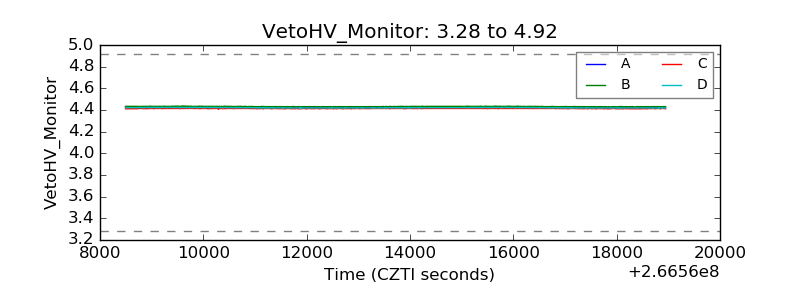 |
| Veto LLD | 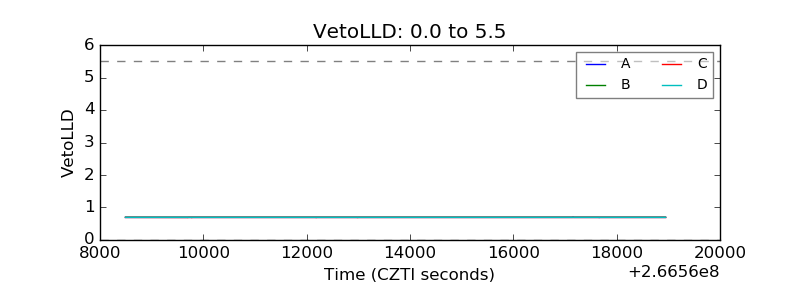 |
| Alpha Counter | 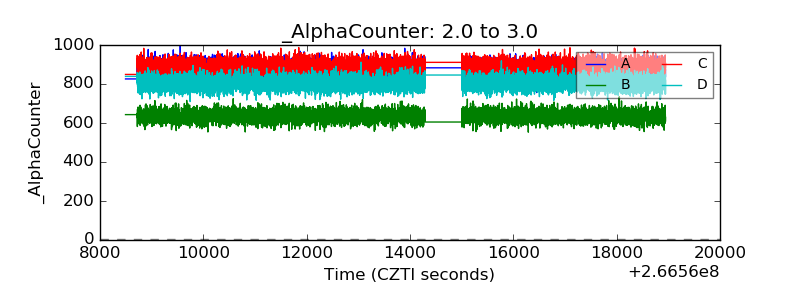 |
| _CPM_Rate | 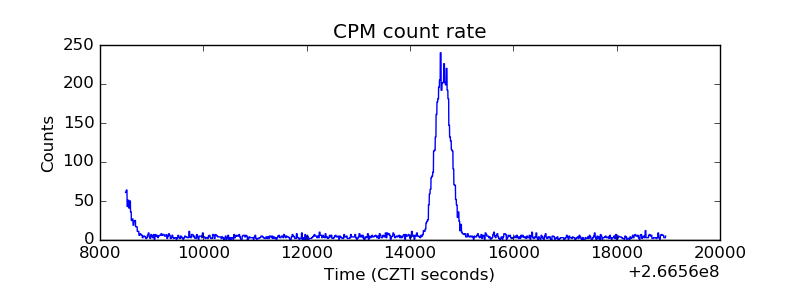 |
| CZT Counter | 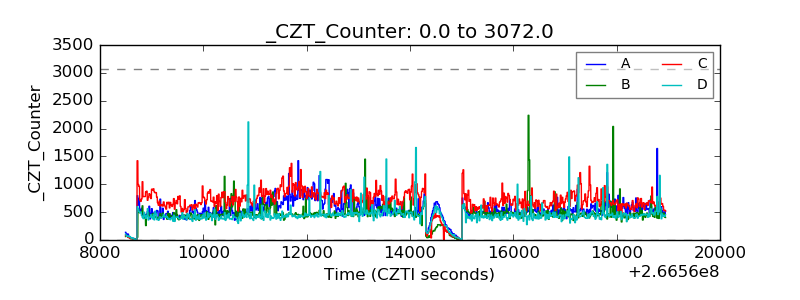 |
| +2.5 Volts monitor |  |
| +5 Volts monitor |  |
| _ROLL_ROT |  |
| _Roll_DEC | 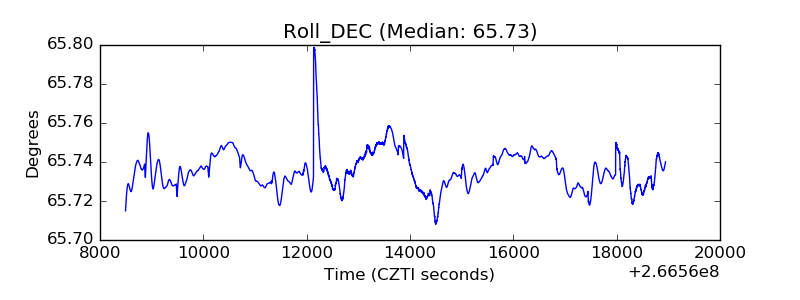 |
| _Roll_RA | 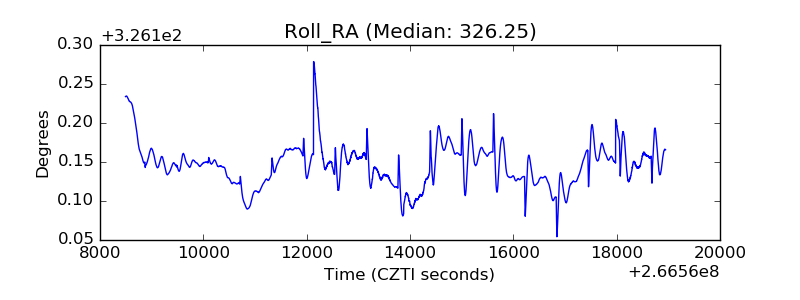 |
| Veto Counter | 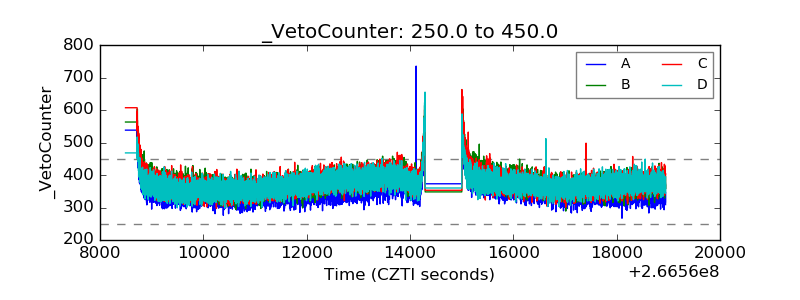 |