| Param | Original file | Final file |
|---|---|---|
| Filename | modeM0/AS1A04_075T04_9000002160cztM0_level2.fits | modeM0/AS1A04_075T04_9000002160cztM0_level2_quad_clean.evt |
| Size (bytes) | 88,945,920 | 67,766,400 |
| Size | 84.8 MB | 64.6 MB |
| Events in quadrant A | 546,510 | 379,827 |
| Events in quadrant B | 519,532 | 369,774 |
| Events in quadrant C | 529,318 | 341,910 |
| Events in quadrant D | 471,648 | 332,989 |
| Mode M0 | |||
|---|---|---|---|
| Quadrant | BADHDUFLAG | Total packets | Discarded packets |
| A | 0 | 19419 | 0 |
| B | 0 | 19584 | 0 |
| C | 0 | 23619 | 0 |
| D | 0 | 19976 | 0 |
| Mode M9 | |||
|---|---|---|---|
| Quadrant | BADHDUFLAG | Total packets | Discarded packets |
| A | 0 | 19 | 0 |
| B | 0 | 19 | 0 |
| C | 0 | 19 | 0 |
| D | 0 | 19 | 0 |
| Mode SS | |||
|---|---|---|---|
| Quadrant | BADHDUFLAG | Total packets | Discarded packets |
| A | 0 | 184 | 0 |
| B | 0 | 184 | 0 |
| C | 0 | 184 | 0 |
| D | 0 | 184 | 0 |
| Quadrant | Total seconds | Saturated seconds | Saturation percentage |
|---|---|---|---|
| A | 9035 | 151 | 1.671278% |
| B | 9035 | 194 | 2.147205% |
| C | 9035 | 124 | 1.372441% |
| D | 9035 | 169 | 1.870504% |
Noise dominated data is calculated using 1-second bins in cleaned event files. If a bin has >2000 counts, and if more than 50% of those come from <1% of pixels, then it is considered to be noise-dominated and hence unusable.
| Quadrant | # 1 sec bins | Bins with >0 counts | Bins with >2000 counts | High rate bins dominated by noise | Noise dominated (total time) | Noise dominated (detector-on time) | Marked lightcurve |
|---|---|---|---|---|---|---|---|
| A | 10875 | 9033 | 0 | 0 | 0.00% | 0.00% |  |
| B | 10875 | 9033 | 0 | 0 | 0.00% | 0.00% |  |
| C | 10875 | 9034 | 0 | 0 | 0.00% | 0.00% |  |
| D | 10875 | 9032 | 0 | 0 | 0.00% | 0.00% |  |
Top three noisy pixels from each quadrant. If the there are fewer than three noisy pixels in the level2.evt file, extra rows are filled as -1
| Pixel properties | Quadrant properties | ||||||
|---|---|---|---|---|---|---|---|
| Quadrant | DetID | PixID | Counts | Sigma | Mean | Median | Sigma |
| A | 0 | 29 | 536 | 10.7 | 142 | 134 | 37.6 |
| A | 7 | 110 | 436 | 8.04 | 142 | 134 | 37.6 |
| A | 0 | 30 | 410 | 7.35 | 142 | 134 | 37.6 |
| B | 2 | 9 | 487 | 11.89 | 137 | 130 | 30.0 |
| B | 3 | 17 | 355 | 7.49 | 137 | 130 | 30.0 |
| B | 3 | 80 | 355 | 7.49 | 137 | 130 | 30.0 |
| C | 3 | 126 | 381 | 6.6 | 140 | 131 | 37.9 |
| C | 9 | 188 | 371 | 6.33 | 140 | 131 | 37.9 |
| C | 12 | 241 | 367 | 6.23 | 140 | 131 | 37.9 |
| D | 3 | 31 | 345 | 5.97 | 134 | 122 | 37.4 |
| D | 6 | 231 | 341 | 5.86 | 134 | 122 | 37.4 |
| D | 7 | 5 | 340 | 5.84 | 134 | 122 | 37.4 |
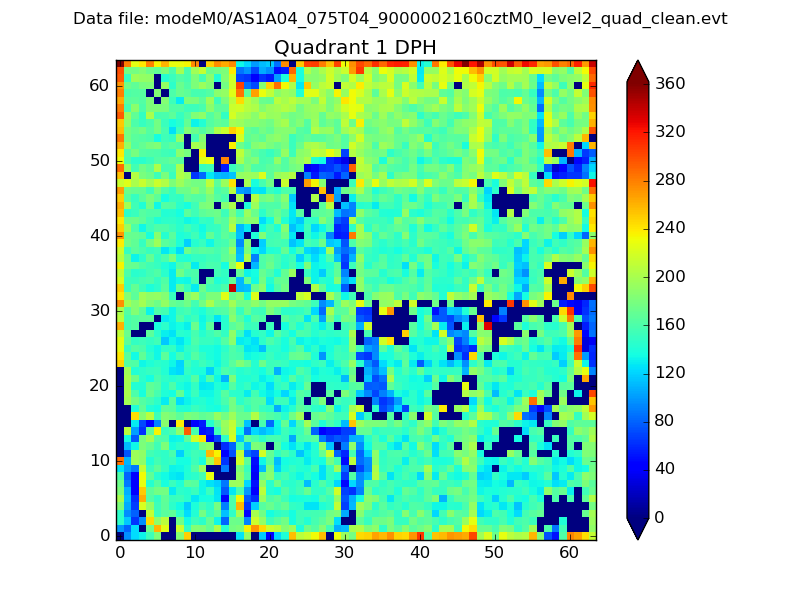
Histogram calculated using DETX and DETY for each event in the final _common_clean file
| Quadrant A |  |
 |
Quadrant B |
|---|---|---|---|
| Quadrant D |  |
 |
Quadrant C |
| Plot type | Count rate plots | Images |
|---|---|---|
| Comparison with Poisson distribution Blue bars denote a histogram of data divided into 1 sec bins. Red curve is a Poisson curve with rate = median count rate of data. |
 |
 |
| Quadrant-wise count rates Data is divided into 100 sec bins |
 |
|
| Module-wise count rates for Quadrant A Data is divided into 100 sec bins |
 |
 |
| Module-wise count rates for Quadrant B Data is divided into 100 sec bins |
 |
 |
| Module-wise count rates for Quadrant C Data is divided into 100 sec bins |
 |
 |
| Module-wise count rates for Quadrant D Data is divided into 100 sec bins |
 |
 |
| Parameter | Plot |
|---|---|
| CZT HV Monitor |  |
| D_VDD |  |
| Temperature 1 | 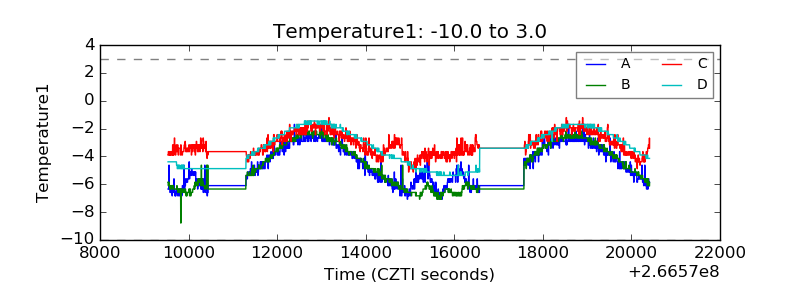 |
| Veto HV Monitor |  |
| Veto LLD |  |
| Alpha Counter |  |
| _CPM_Rate |  |
| CZT Counter |  |
| +2.5 Volts monitor | 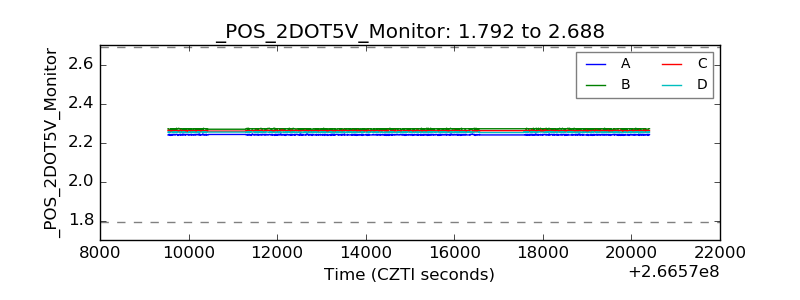 |
| +5 Volts monitor |  |
| _ROLL_ROT |  |
| _Roll_DEC |  |
| _Roll_RA |  |
| Veto Counter |  |