| Param | Original file | Final file |
|---|---|---|
| Filename | modeM0/AS1A04_075T04_9000002160_14642cztM0_level2.evt | modeM0/AS1A04_075T04_9000002160_14642cztM0_level2_quad_clean.evt |
| Size (bytes) | 178,718,400 | 26,032,320 |
| Size | 170.4 MB | 24.8 MB |
| Events in quadrant A | 1,237,794 | 157,605 |
| Events in quadrant B | 1,346,533 | 156,904 |
| Events in quadrant C | 1,534,468 | 154,622 |
| Events in quadrant D | 1,136,582 | 154,186 |
| Mode M0 | |||
|---|---|---|---|
| Quadrant | BADHDUFLAG | Total packets | Discarded packets |
| A | 0 | 4980 | 1 |
| B | 0 | 5329 | 0 |
| C | 0 | 6238 | 0 |
| D | 0 | 4810 | 0 |
| Mode M9 | |||
|---|---|---|---|
| Quadrant | BADHDUFLAG | Total packets | Discarded packets |
| A | 0 | 9 | 0 |
| B | 0 | 9 | 0 |
| C | 0 | 9 | 0 |
| D | 0 | 9 | 0 |
| Mode SS | |||
|---|---|---|---|
| Quadrant | BADHDUFLAG | Total packets | Discarded packets |
| A | 0 | 46 | 0 |
| B | 0 | 46 | 0 |
| C | 0 | 46 | 0 |
| D | 0 | 46 | 0 |
| Quadrant | Total seconds | Saturated seconds | Saturation percentage |
|---|---|---|---|
| A | 2285 | 65 | 2.844639% |
| B | 2285 | 107 | 4.682713% |
| C | 2285 | 62 | 2.713348% |
| D | 2285 | 58 | 2.538293% |
Noise dominated data is calculated using 1-second bins in cleaned event files. If a bin has >2000 counts, and if more than 50% of those come from <1% of pixels, then it is considered to be noise-dominated and hence unusable.
| Quadrant | # 1 sec bins | Bins with >0 counts | Bins with >2000 counts | High rate bins dominated by noise | Noise dominated (total time) | Noise dominated (detector-on time) | Marked lightcurve |
|---|---|---|---|---|---|---|---|
| A | 3131 | 2286 | 0 | 0 | 0.00% | 0.00% |  |
| B | 3131 | 2286 | 23 | 23 | 0.73% | 1.01% | 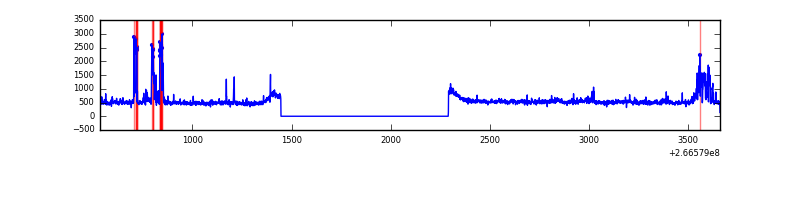 |
| C | 3131 | 2286 | 1 | 1 | 0.03% | 0.04% | 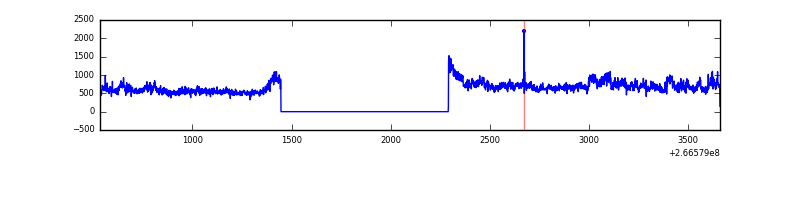 |
| D | 3131 | 2286 | 0 | 0 | 0.00% | 0.00% | 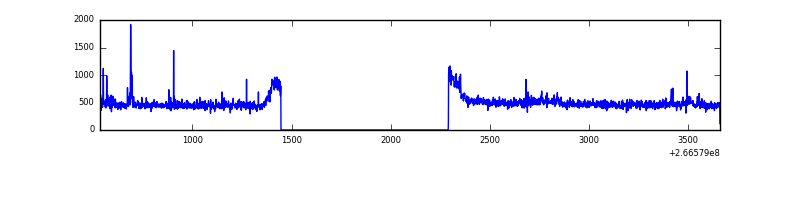 |
Top three noisy pixels from each quadrant. If the there are fewer than three noisy pixels in the level2.evt file, extra rows are filled as -1
| Pixel properties | Quadrant properties | ||||||
|---|---|---|---|---|---|---|---|
| Quadrant | DetID | PixID | Counts | Sigma | Mean | Median | Sigma |
| A | 1 | 162 | 27620 | 433.58 | 299 | 292 | 63.0 |
| A | 8 | 15 | 24416 | 382.74 | 299 | 292 | 63.0 |
| A | 1 | 178 | 11380 | 175.92 | 299 | 292 | 63.0 |
| B | 10 | 16 | 89175 | 1493.62 | 295 | 288 | 59.5 |
| B | 0 | 230 | 62342 | 1042.73 | 295 | 288 | 59.5 |
| B | 0 | 205 | 11352 | 185.91 | 295 | 288 | 59.5 |
| C | 3 | 233 | 419187 | 6188.96 | 284 | 285 | 67.7 |
| C | 10 | 22 | 3259 | 43.94 | 284 | 285 | 67.7 |
| C | 13 | 61 | 2021 | 25.65 | 284 | 285 | 67.7 |
| D | 9 | 1 | 10560 | 141.87 | 288 | 279 | 72.5 |
| D | 10 | 70 | 9306 | 124.56 | 288 | 279 | 72.5 |
| D | 10 | 199 | 8980 | 120.06 | 288 | 279 | 72.5 |
Histogram calculated using DETX and DETY for each event in the final _common_clean file
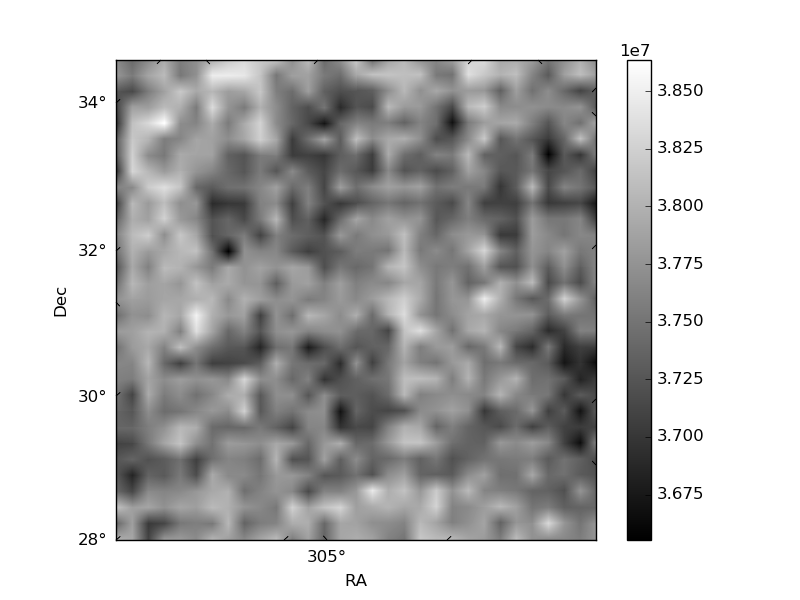
| Quadrant A |  |
 |
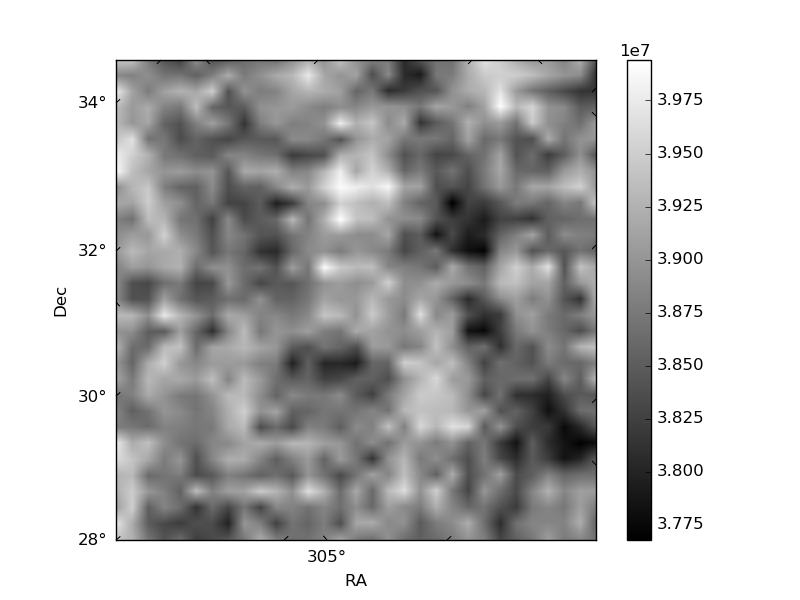
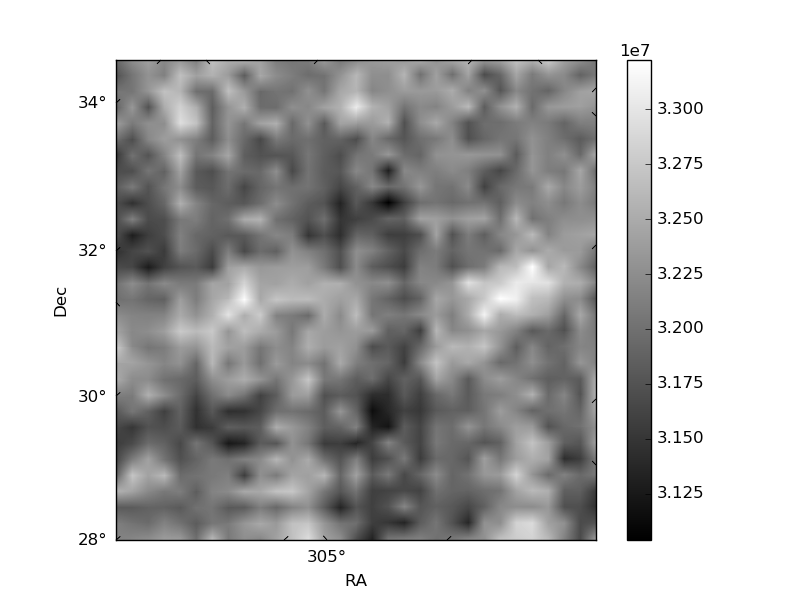
Quadrant B |
|---|---|---|---|
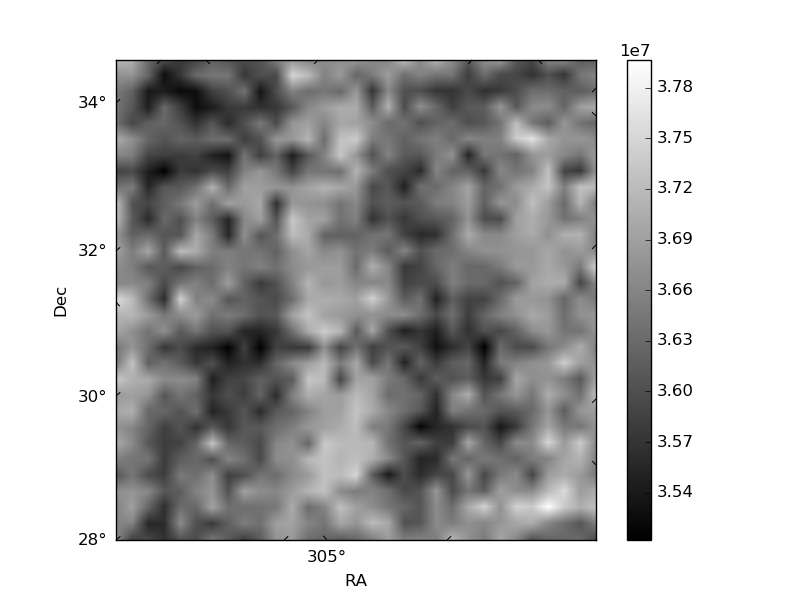
| Quadrant D | 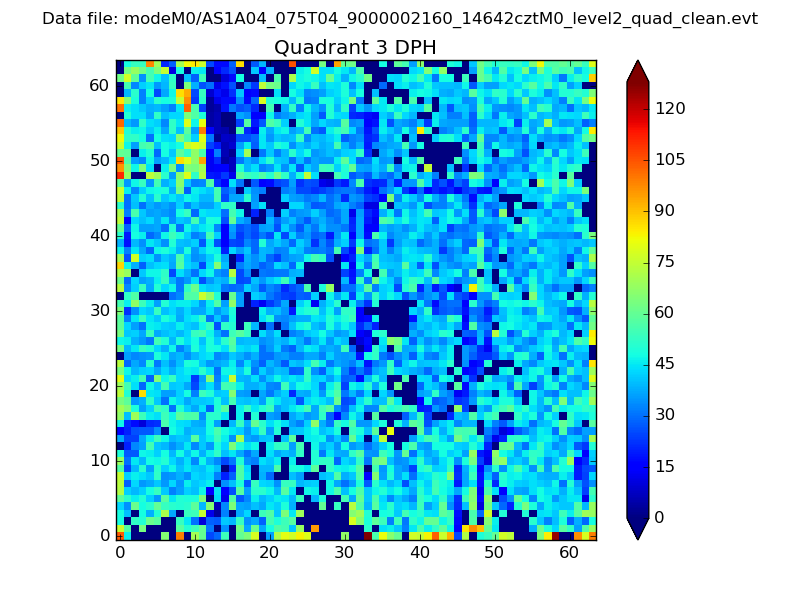 |
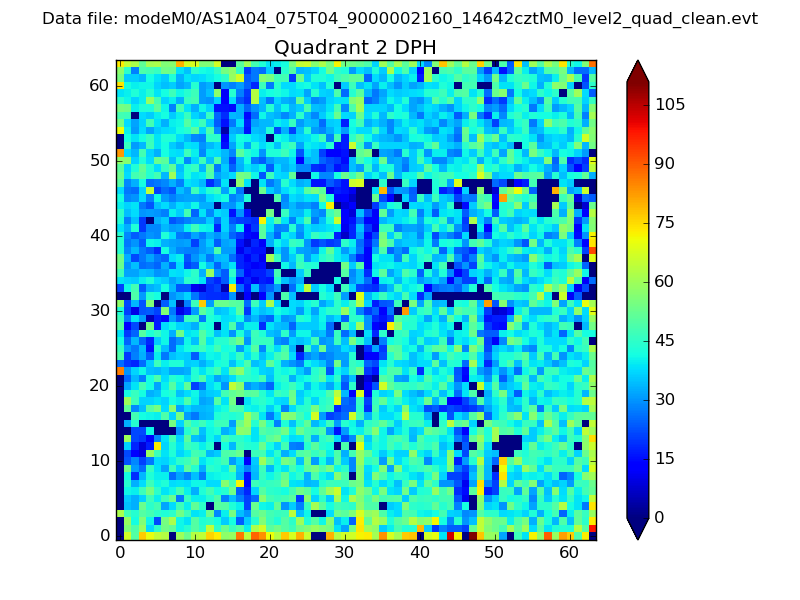 |
Quadrant C |
| Plot type | Count rate plots | Images |
|---|---|---|
| Comparison with Poisson distribution Blue bars denote a histogram of data divided into 1 sec bins. Red curve is a Poisson curve with rate = median count rate of data. |
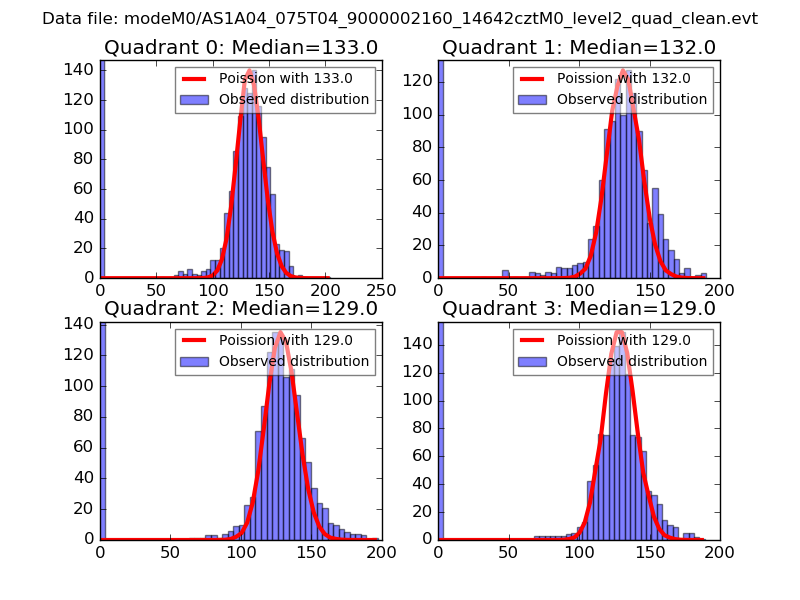 |
 |
| Quadrant-wise count rates Data is divided into 100 sec bins |
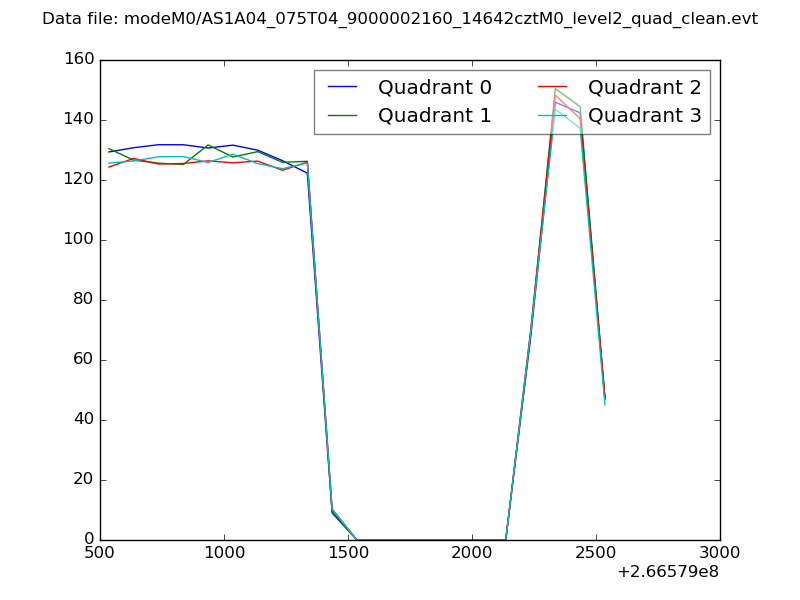 |
|
| Module-wise count rates for Quadrant A Data is divided into 100 sec bins |
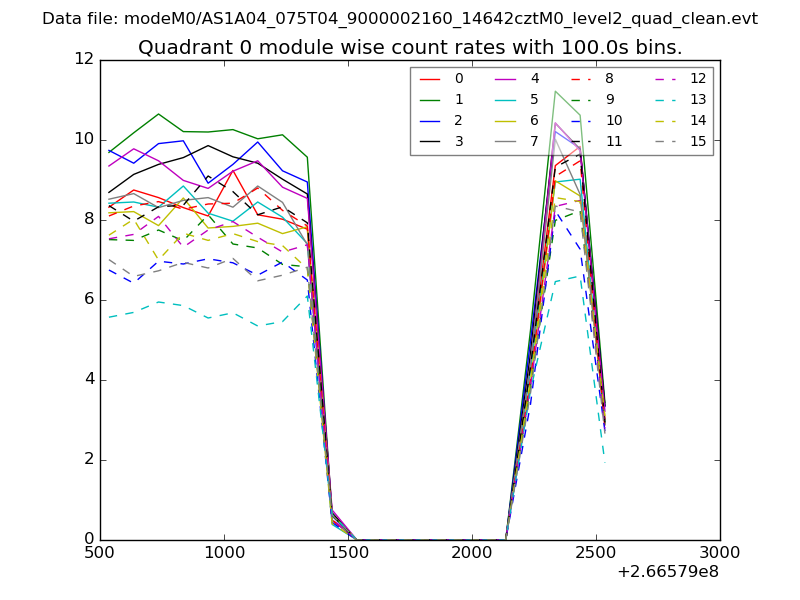 |
 |
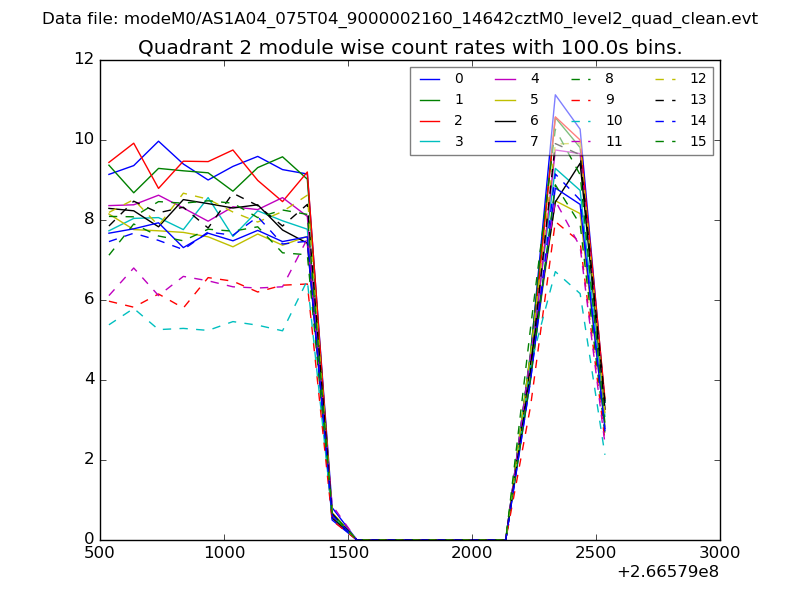
| Module-wise count rates for Quadrant B Data is divided into 100 sec bins |
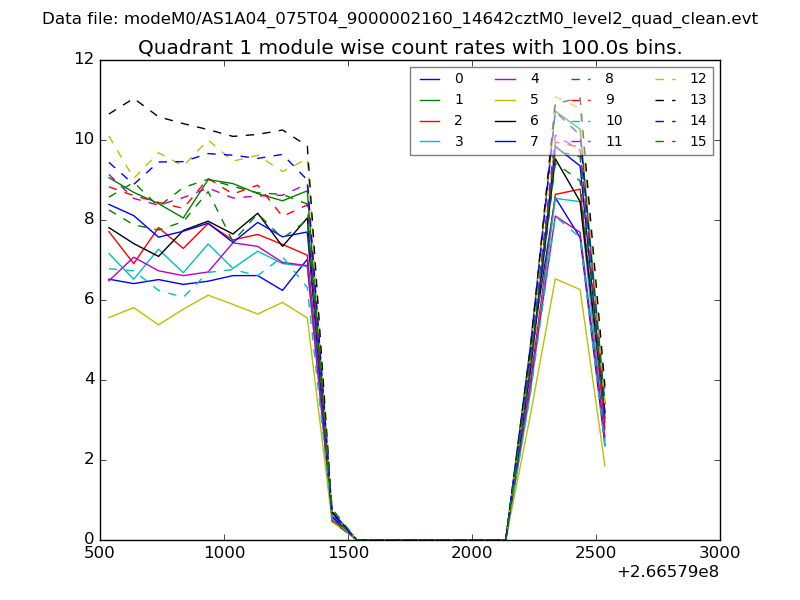 |
 |
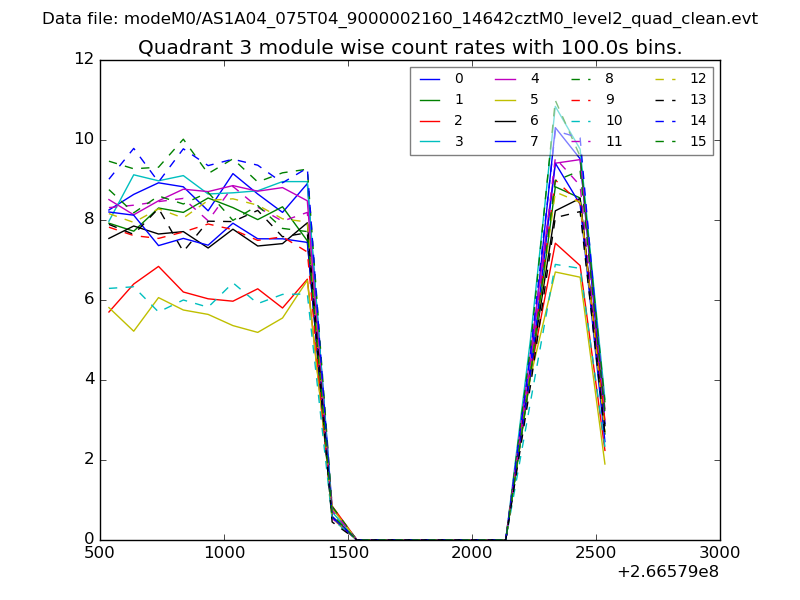
| Module-wise count rates for Quadrant C Data is divided into 100 sec bins |
 |
 |
| Module-wise count rates for Quadrant D Data is divided into 100 sec bins |
 |
 |
| Parameter | Plot |
|---|---|
| CZT HV Monitor |  |
| D_VDD | 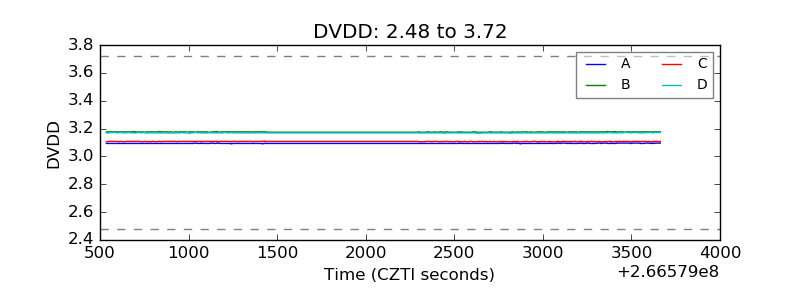 |
| Temperature 1 | 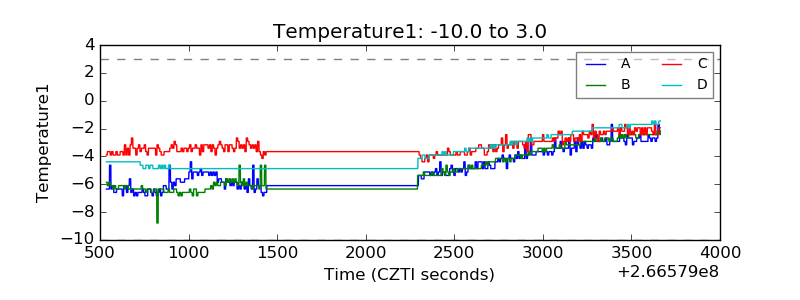 |
| Veto HV Monitor | 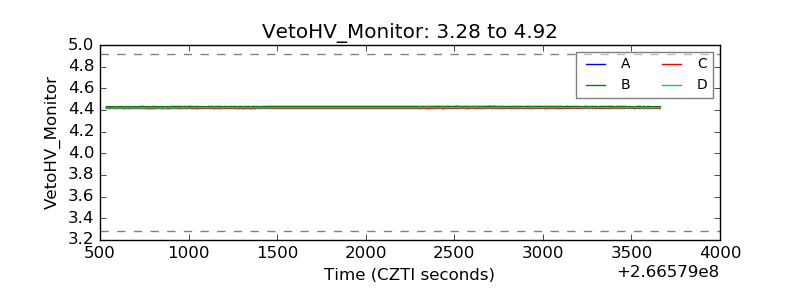 |
| Veto LLD | 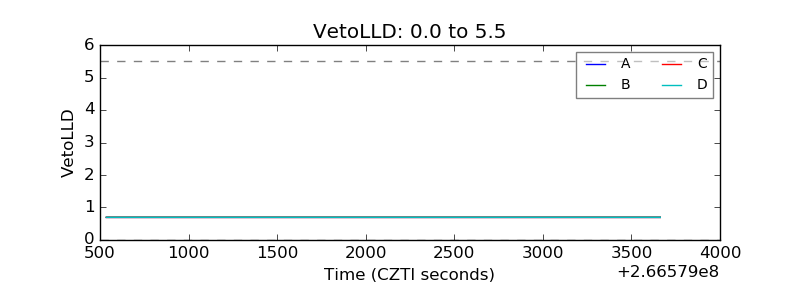 |
| Alpha Counter | 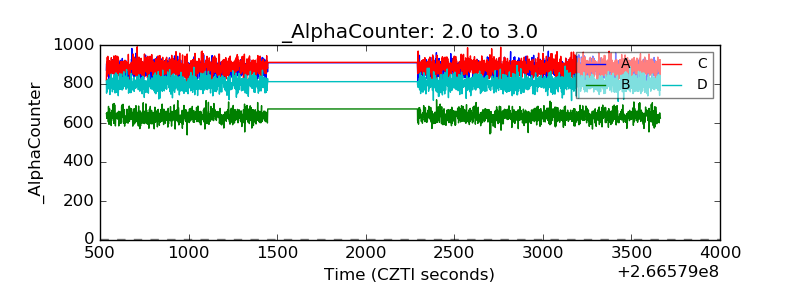 |
| _CPM_Rate | 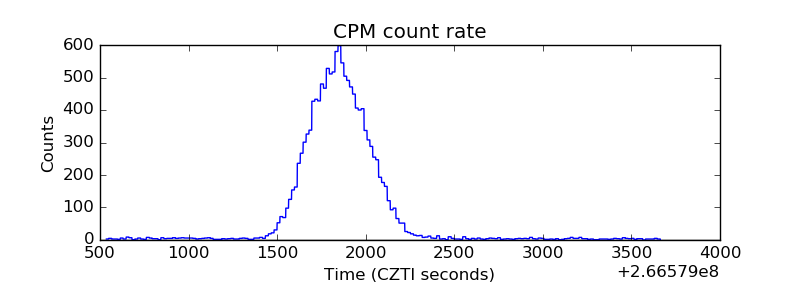 |
| CZT Counter |  |
| +2.5 Volts monitor |  |
| +5 Volts monitor | 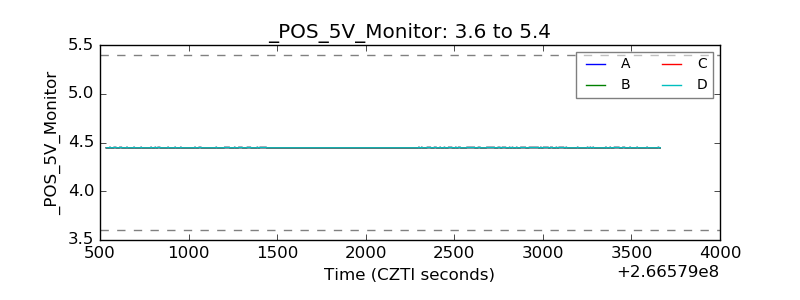 |
| _ROLL_ROT | 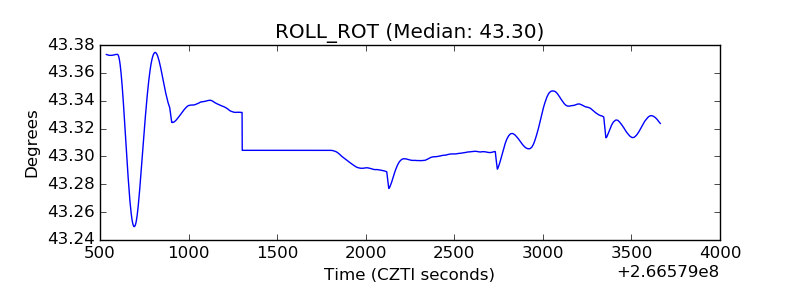 |
| _Roll_DEC | 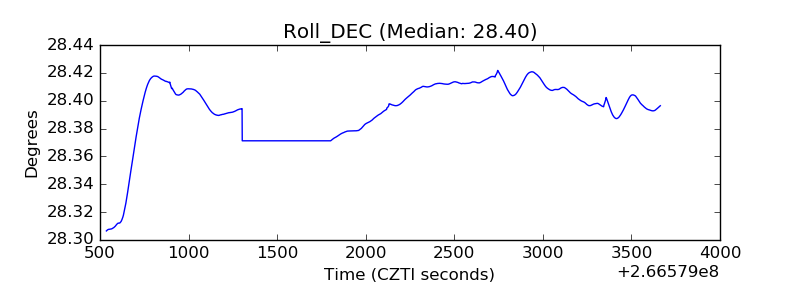 |
| _Roll_RA | 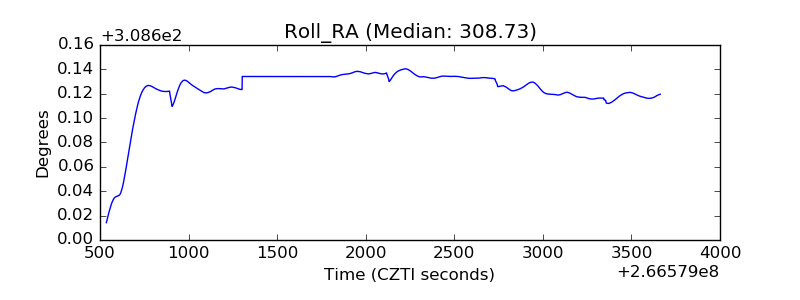 |
| Veto Counter | 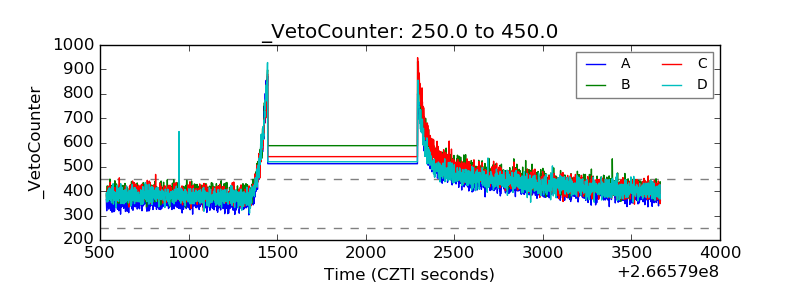 |