| Param | Original file | Final file |
|---|---|---|
| Filename | modeM0/AS1A04_075T04_9000002160_14644cztM0_level2.evt | modeM0/AS1A04_075T04_9000002160_14644cztM0_level2_quad_clean.evt |
| Size (bytes) | 220,196,160 | 19,854,720 |
| Size | 210.0 MB | 18.9 MB |
| Events in quadrant A | 1,561,564 | 102,485 |
| Events in quadrant B | 1,534,273 | 100,816 |
| Events in quadrant C | 1,730,060 | 96,260 |
| Events in quadrant D | 1,647,640 | 97,647 |
| Mode M0 | |||
|---|---|---|---|
| Quadrant | BADHDUFLAG | Total packets | Discarded packets |
| A | 0 | 6347 | 1 |
| B | 0 | 6278 | 1 |
| C | 0 | 7112 | 1 |
| D | 0 | 6701 | 1 |
| Mode M9 | |||
|---|---|---|---|
| Quadrant | BADHDUFLAG | Total packets | Discarded packets |
| A | 0 | 2 | 0 |
| B | 0 | 2 | 0 |
| C | 0 | 2 | 0 |
| D | 0 | 3 | 0 |
| Mode SS | |||
|---|---|---|---|
| Quadrant | BADHDUFLAG | Total packets | Discarded packets |
| A | 0 | 58 | 0 |
| B | 0 | 58 | 0 |
| C | 0 | 58 | 0 |
| D | 0 | 58 | 0 |
| Quadrant | Total seconds | Saturated seconds | Saturation percentage |
|---|---|---|---|
| A | 2841 | 47 | 1.654347% |
| B | 2841 | 51 | 1.795143% |
| C | 2841 | 35 | 1.231961% |
| D | 2841 | 54 | 1.900739% |
Noise dominated data is calculated using 1-second bins in cleaned event files. If a bin has >2000 counts, and if more than 50% of those come from <1% of pixels, then it is considered to be noise-dominated and hence unusable.
| Quadrant | # 1 sec bins | Bins with >0 counts | Bins with >2000 counts | High rate bins dominated by noise | Noise dominated (total time) | Noise dominated (detector-on time) | Marked lightcurve |
|---|---|---|---|---|---|---|---|
| A | 2842 | 2842 | 0 | 0 | 0.00% | 0.00% | 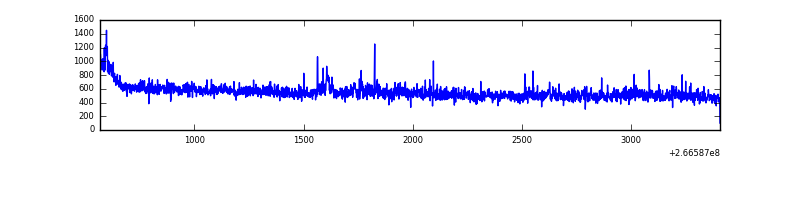 |
| B | 2842 | 2842 | 1 | 1 | 0.04% | 0.04% | 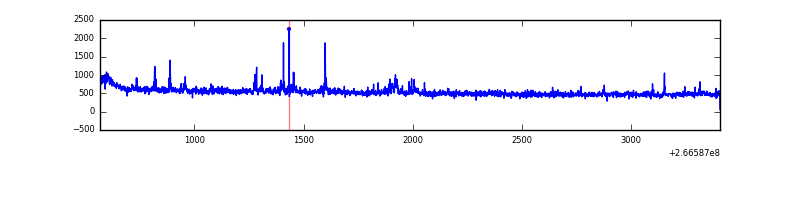 |
| C | 2842 | 2842 | 0 | 0 | 0.00% | 0.00% | 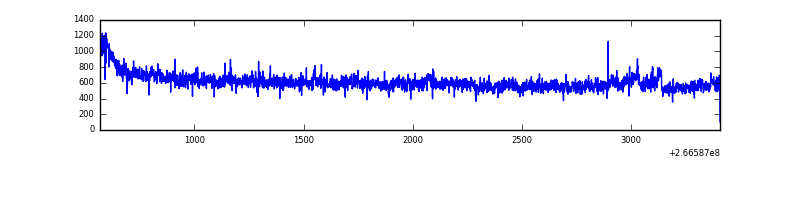 |
| D | 2842 | 2842 | 6 | 6 | 0.21% | 0.21% | 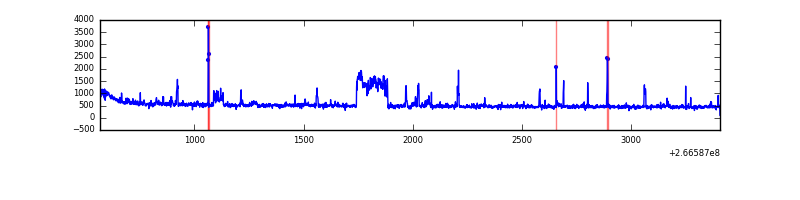 |
Top three noisy pixels from each quadrant. If the there are fewer than three noisy pixels in the level2.evt file, extra rows are filled as -1
| Pixel properties | Quadrant properties | ||||||
|---|---|---|---|---|---|---|---|
| Quadrant | DetID | PixID | Counts | Sigma | Mean | Median | Sigma |
| A | 1 | 162 | 30765 | 389.3 | 377 | 369 | 78.1 |
| A | 8 | 15 | 20745 | 260.97 | 377 | 369 | 78.1 |
| A | 0 | 23 | 14172 | 176.78 | 377 | 369 | 78.1 |
| B | 4 | 142 | 19073 | 264.82 | 371 | 363 | 70.7 |
| B | 0 | 205 | 14581 | 201.24 | 371 | 363 | 70.7 |
| B | 0 | 230 | 12125 | 166.48 | 371 | 363 | 70.7 |
| C | 3 | 233 | 317629 | 3763.53 | 359 | 362 | 84.3 |
| C | 8 | 128 | 6952 | 78.17 | 359 | 362 | 84.3 |
| C | 8 | 112 | 3327 | 35.17 | 359 | 362 | 84.3 |
| D | 12 | 110 | 212716 | 2183.81 | 363 | 356 | 97.2 |
| D | 10 | 199 | 13622 | 136.42 | 363 | 356 | 97.2 |
| D | 15 | 0 | 11009 | 109.55 | 363 | 356 | 97.2 |
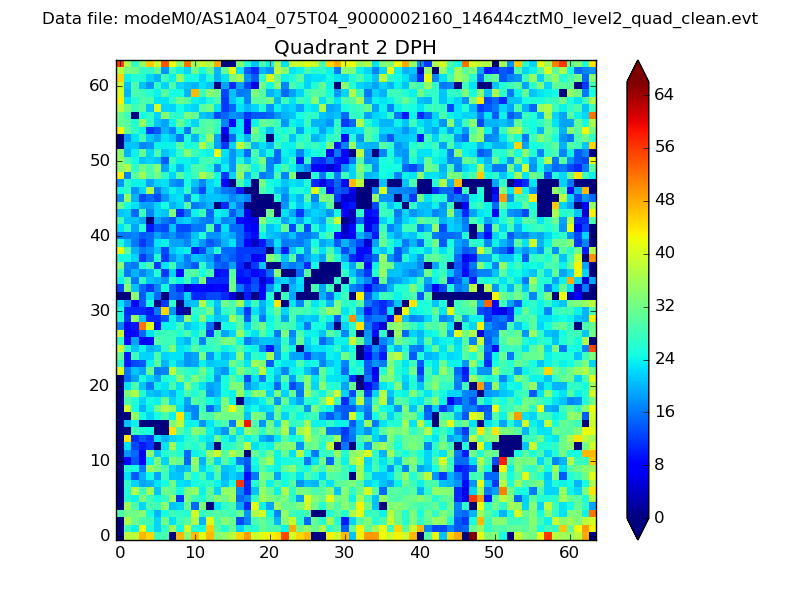
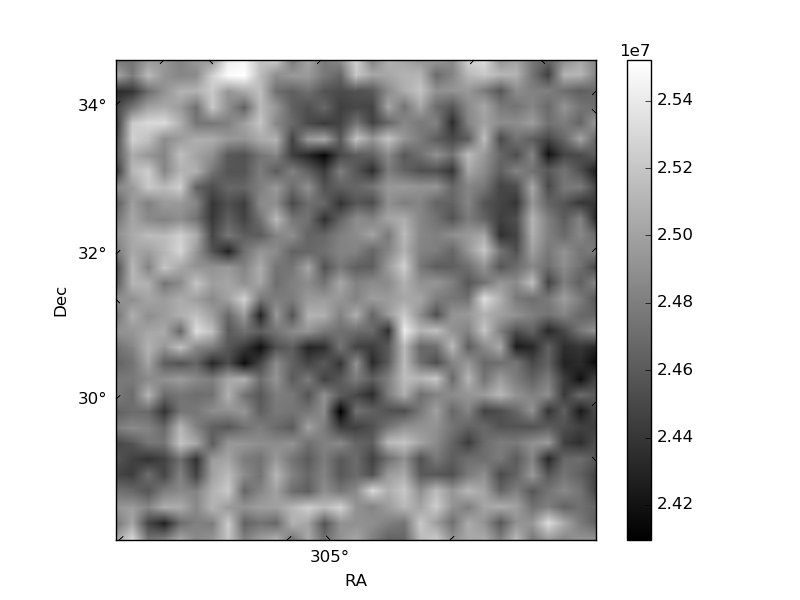
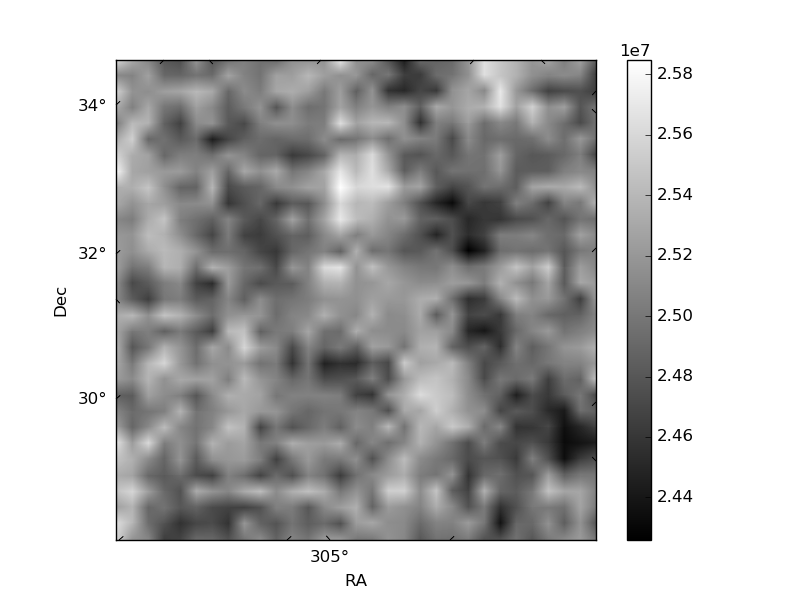
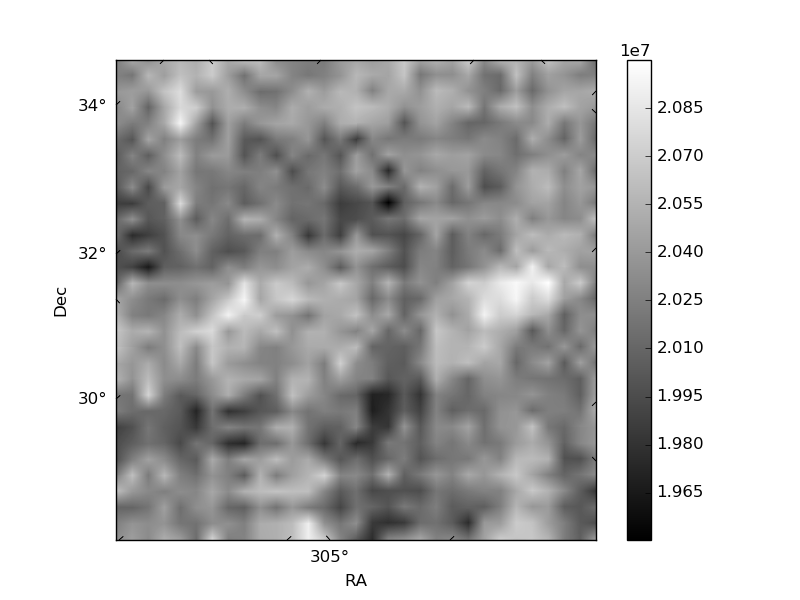
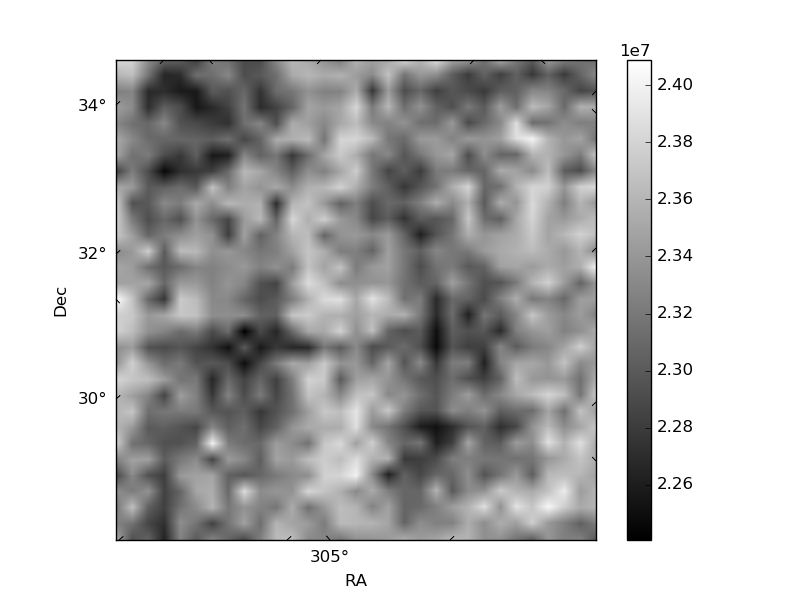
Histogram calculated using DETX and DETY for each event in the final _common_clean file
| Quadrant A | 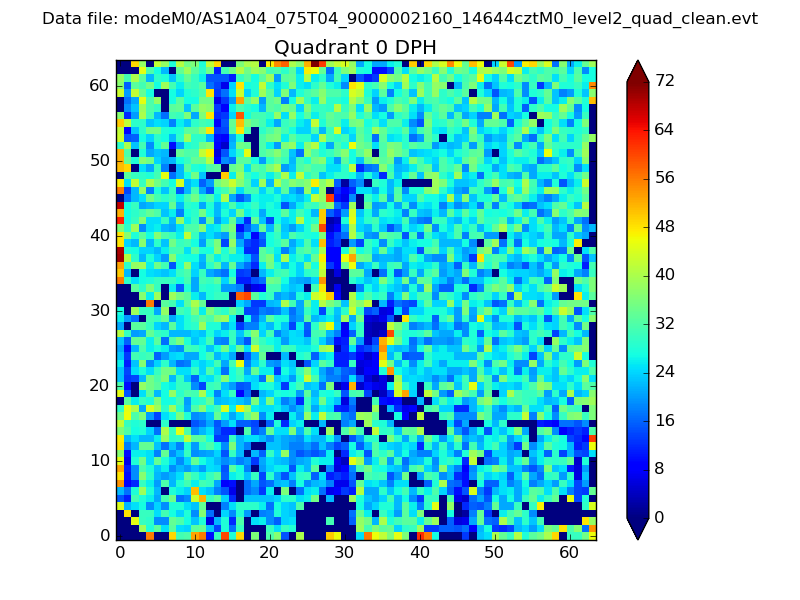 |
 |
Quadrant B |
|---|---|---|---|
| Quadrant D |  |
 |
Quadrant C |
| Plot type | Count rate plots | Images |
|---|---|---|
| Comparison with Poisson distribution Blue bars denote a histogram of data divided into 1 sec bins. Red curve is a Poisson curve with rate = median count rate of data. |
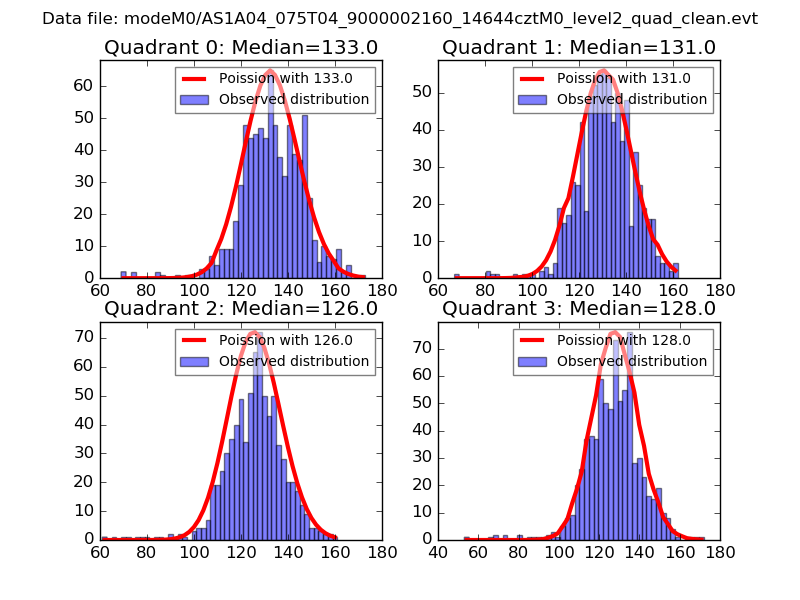 |
 |
| Quadrant-wise count rates Data is divided into 100 sec bins |
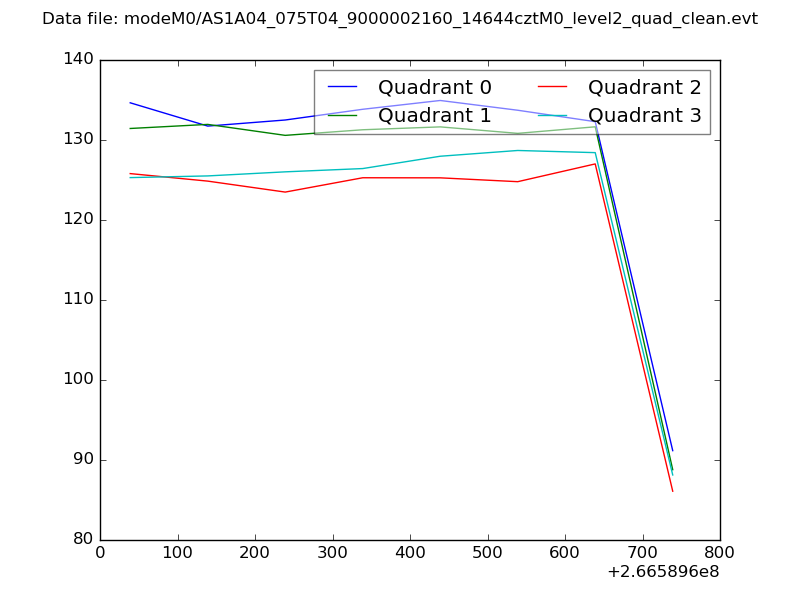 |
|
| Module-wise count rates for Quadrant A Data is divided into 100 sec bins |
 |
 |
| Module-wise count rates for Quadrant B Data is divided into 100 sec bins |
 |
 |
| Module-wise count rates for Quadrant C Data is divided into 100 sec bins |
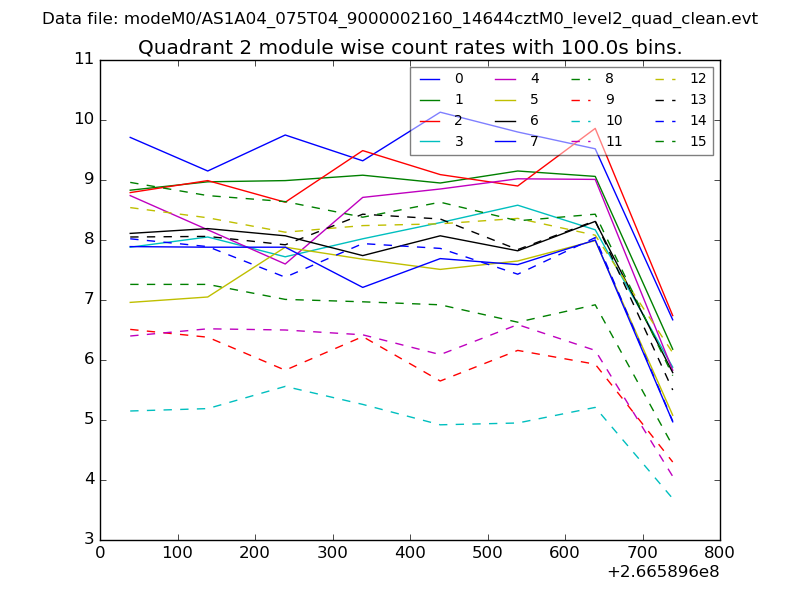 |
 |
| Module-wise count rates for Quadrant D Data is divided into 100 sec bins |
 |
 |
| Parameter | Plot |
|---|---|
| CZT HV Monitor |  |
| D_VDD | 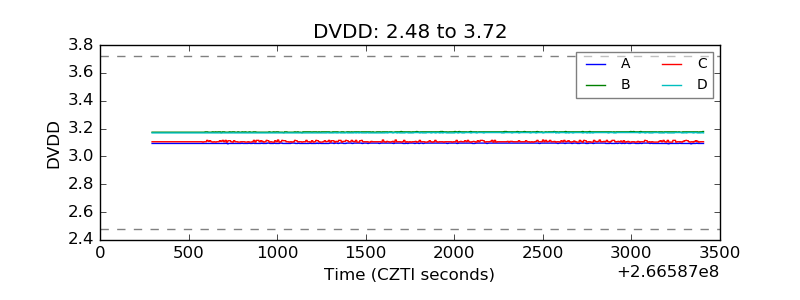 |
| Temperature 1 | 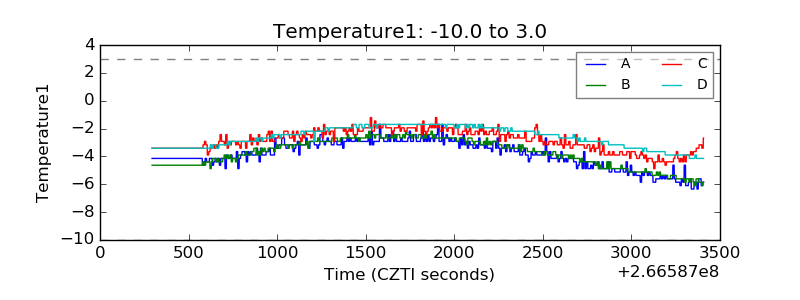 |
| Veto HV Monitor | 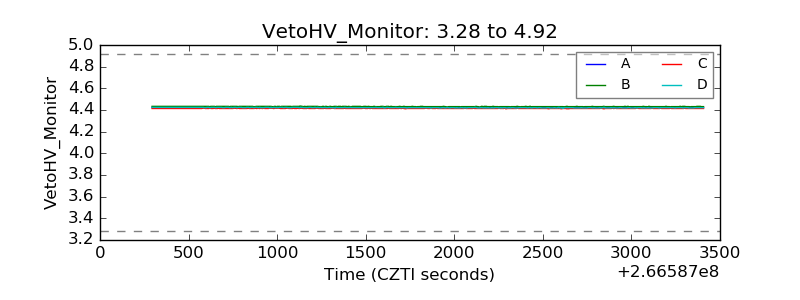 |
| Veto LLD | 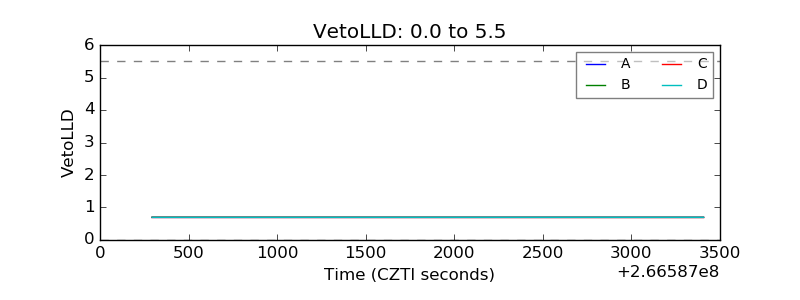 |
| Alpha Counter | 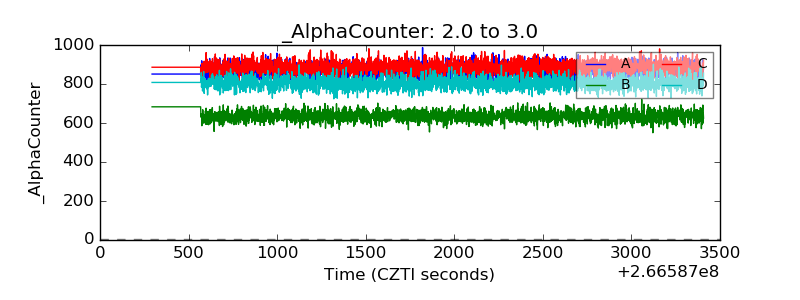 |
| _CPM_Rate | 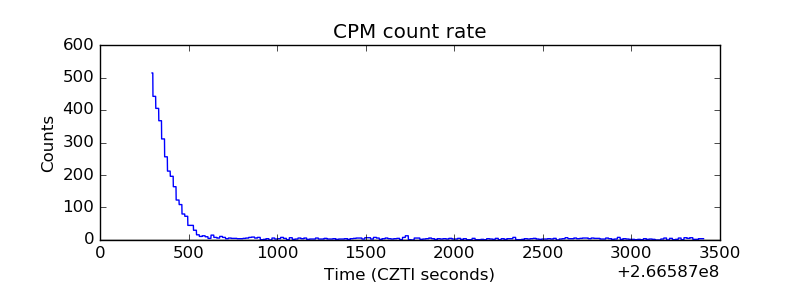 |
| CZT Counter | 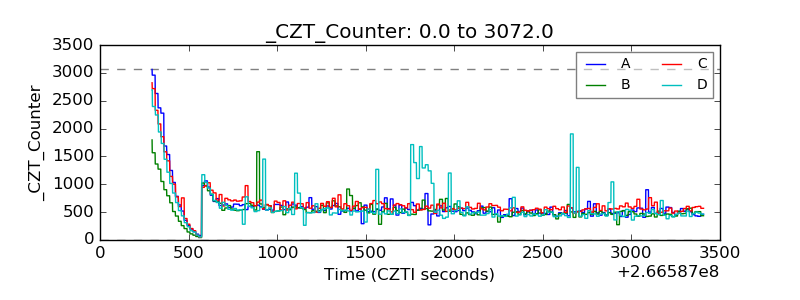 |
| +2.5 Volts monitor | 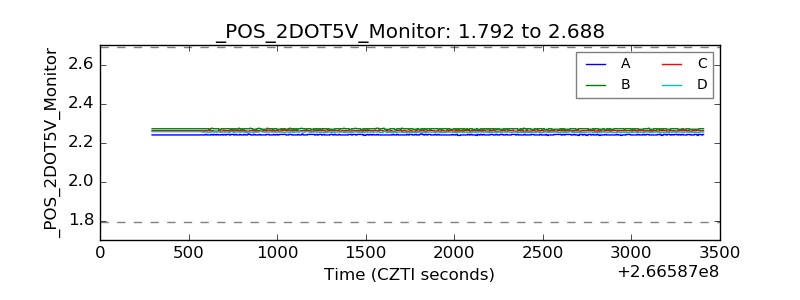 |
| +5 Volts monitor | 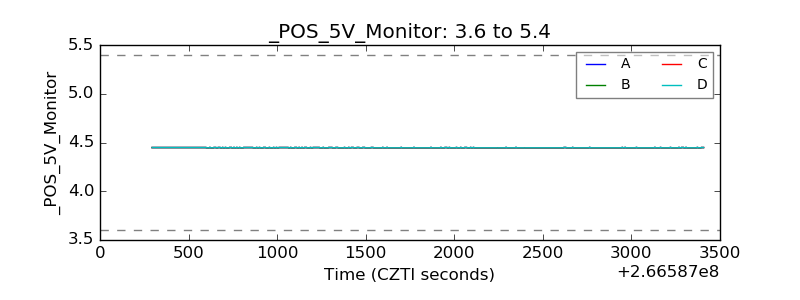 |
| _ROLL_ROT | 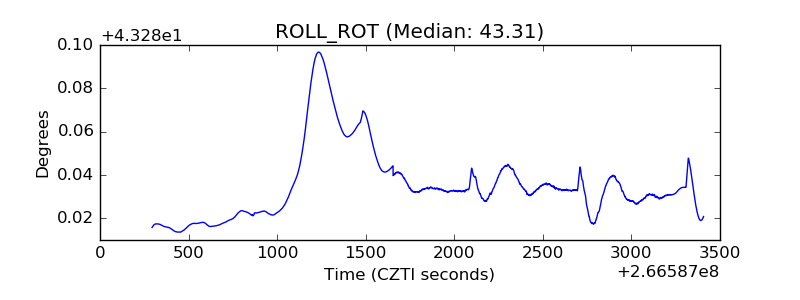 |
| _Roll_DEC | 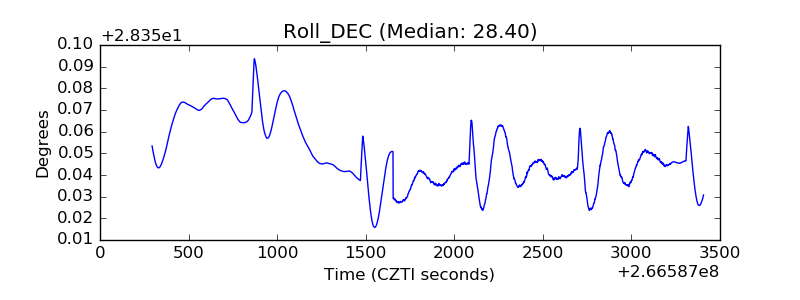 |
| _Roll_RA | 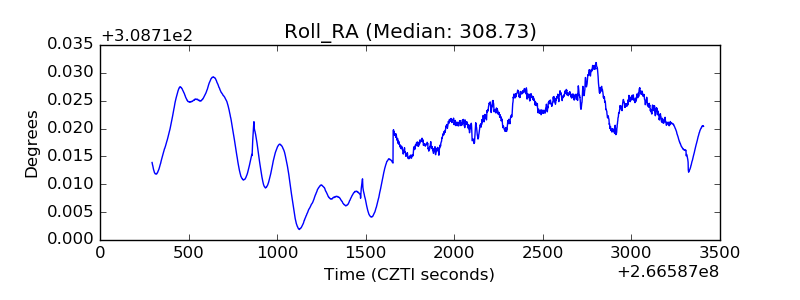 |
| Veto Counter | 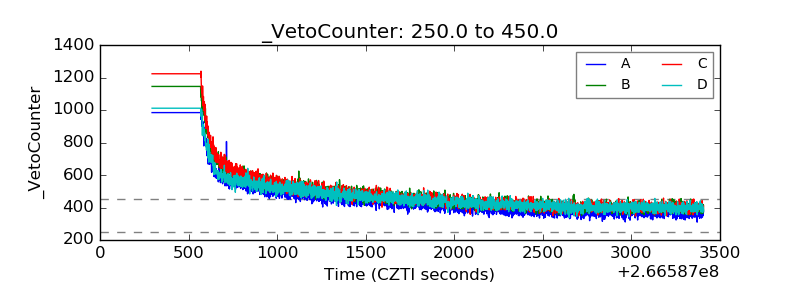 |