| Param | Original file | Final file |
|---|---|---|
| Filename | modeM0/AS1A04_148T01_9000002162cztM0_level2.fits | modeM0/AS1A04_148T01_9000002162cztM0_level2_quad_clean.evt |
| Size (bytes) | 144,743,040 | 120,147,840 |
| Size | 138.0 MB | 114.6 MB |
| Events in quadrant A | 861,940 | 638,950 |
| Events in quadrant B | 880,516 | 721,351 |
| Events in quadrant C | 900,258 | 690,426 |
| Events in quadrant D | 789,276 | 635,606 |
| Mode SS | |||
|---|---|---|---|
| Quadrant | BADHDUFLAG | Total packets | Discarded packets |
| A | 0 | 280 | 0 |
| B | 0 | 280 | 0 |
| C | 0 | 280 | 0 |
| D | 0 | 280 | 0 |
| Mode M9 | |||
|---|---|---|---|
| Quadrant | BADHDUFLAG | Total packets | Discarded packets |
| A | 0 | 37 | 0 |
| B | 0 | 37 | 0 |
| C | 0 | 37 | 0 |
| D | 0 | 37 | 0 |
| Mode M0 | |||
|---|---|---|---|
| Quadrant | BADHDUFLAG | Total packets | Discarded packets |
| A | 0 | 42329 | 0 |
| B | 0 | 30992 | 0 |
| C | 0 | 36995 | 0 |
| D | 0 | 32835 | 0 |
| Quadrant | Total seconds | Saturated seconds | Saturation percentage |
|---|---|---|---|
| A | 13779 | 1242 | 9.013717% |
| B | 13779 | 226 | 1.640177% |
| C | 13779 | 206 | 1.495029% |
| D | 13779 | 439 | 3.186008% |
Noise dominated data is calculated using 1-second bins in cleaned event files. If a bin has >2000 counts, and if more than 50% of those come from <1% of pixels, then it is considered to be noise-dominated and hence unusable.
| Quadrant | # 1 sec bins | Bins with >0 counts | Bins with >2000 counts | High rate bins dominated by noise | Noise dominated (total time) | Noise dominated (detector-on time) | Marked lightcurve |
|---|---|---|---|---|---|---|---|
| A | 17459 | 13723 | 0 | 0 | 0.00% | 0.00% |  |
| B | 17459 | 13776 | 0 | 0 | 0.00% | 0.00% |  |
| C | 17459 | 13776 | 0 | 0 | 0.00% | 0.00% |  |
| D | 17459 | 13773 | 0 | 0 | 0.00% | 0.00% |  |
Top three noisy pixels from each quadrant. If the there are fewer than three noisy pixels in the level2.evt file, extra rows are filled as -1
| Pixel properties | Quadrant properties | ||||||
|---|---|---|---|---|---|---|---|
| Quadrant | DetID | PixID | Counts | Sigma | Mean | Median | Sigma |
| A | 0 | 29 | 830 | 10.96 | 225 | 212 | 56.4 |
| A | 14 | 79 | 653 | 7.82 | 225 | 212 | 56.4 |
| A | 0 | 28 | 651 | 7.78 | 225 | 212 | 56.4 |
| B | 2 | 9 | 785 | 11.6 | 233 | 223 | 48.4 |
| B | 3 | 80 | 619 | 8.17 | 233 | 223 | 48.4 |
| B | 5 | 128 | 588 | 7.53 | 233 | 223 | 48.4 |
| C | 1 | 81 | 693 | 7.69 | 238 | 225 | 60.9 |
| C | 1 | 80 | 679 | 7.46 | 238 | 225 | 60.9 |
| C | 3 | 126 | 626 | 6.59 | 238 | 225 | 60.9 |
| D | 6 | 231 | 585 | 6.18 | 226 | 207 | 61.2 |
| D | 6 | 67 | 584 | 6.16 | 226 | 207 | 61.2 |
| D | 10 | 189 | 575 | 6.01 | 226 | 207 | 61.2 |
Histogram calculated using DETX and DETY for each event in the final _common_clean file
| Quadrant A | 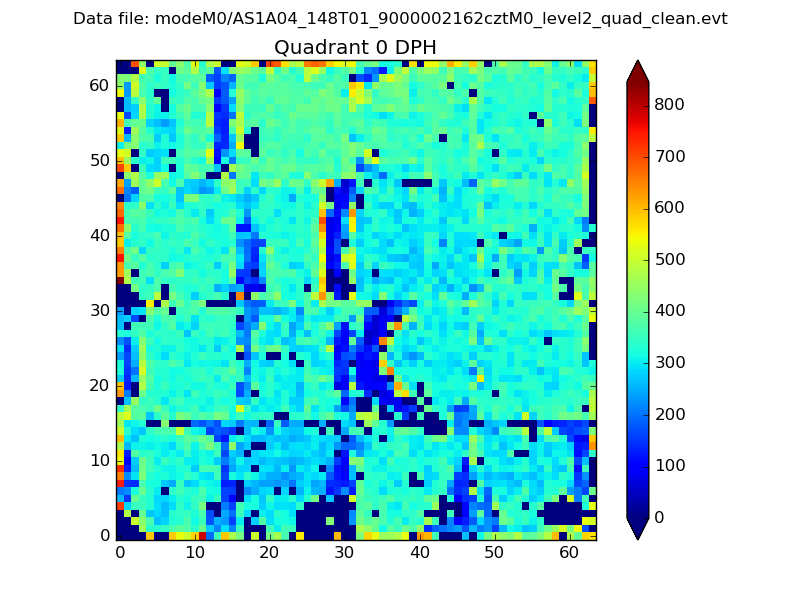 |
 |
Quadrant B |
|---|---|---|---|
| Quadrant D |  |
 |
Quadrant C |
| Plot type | Count rate plots | Images |
|---|---|---|
| Comparison with Poisson distribution Blue bars denote a histogram of data divided into 1 sec bins. Red curve is a Poisson curve with rate = median count rate of data. |
 |
 |
| Quadrant-wise count rates Data is divided into 100 sec bins |
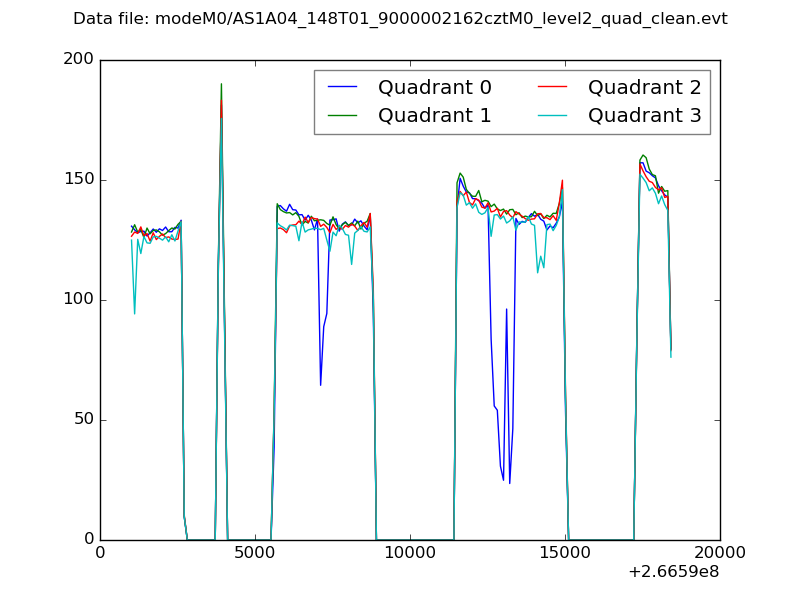 |
|
| Module-wise count rates for Quadrant A Data is divided into 100 sec bins |
 |
 |
| Module-wise count rates for Quadrant B Data is divided into 100 sec bins |
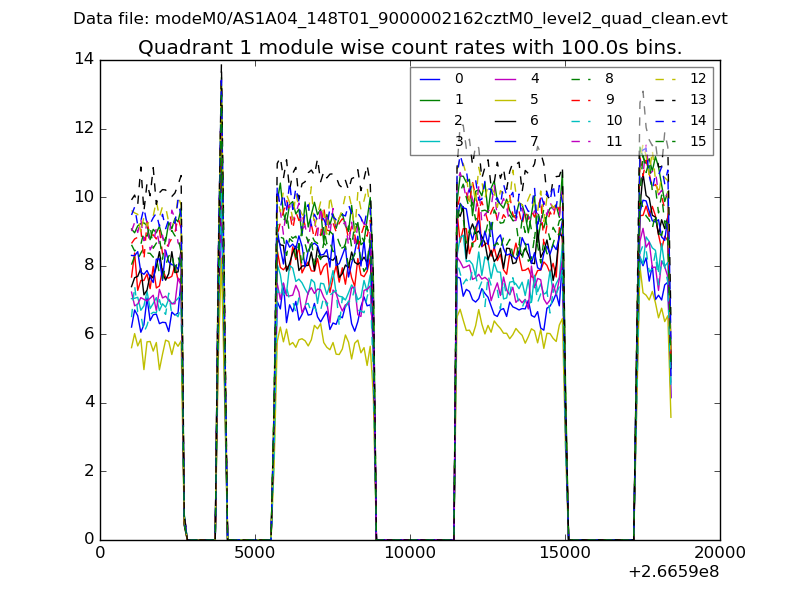 |
 |
| Module-wise count rates for Quadrant C Data is divided into 100 sec bins |
 |
 |
| Module-wise count rates for Quadrant D Data is divided into 100 sec bins |
 |
 |
| Parameter | Plot |
|---|---|
| CZT HV Monitor |  |
| D_VDD |  |
| Temperature 1 |  |
| Veto HV Monitor |  |
| Veto LLD |  |
| Alpha Counter | 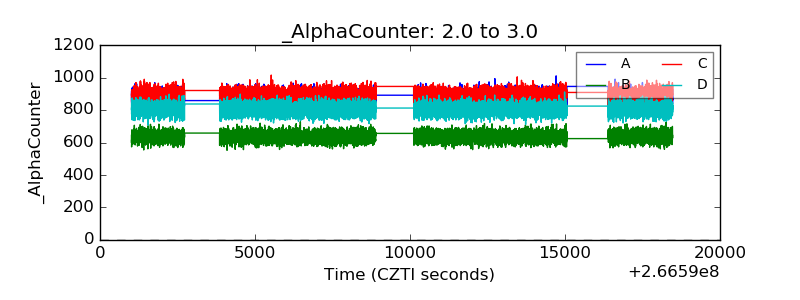 |
| _CPM_Rate |  |
| CZT Counter |  |
| +2.5 Volts monitor |  |
| +5 Volts monitor |  |
| _ROLL_ROT |  |
| _Roll_DEC |  |
| _Roll_RA |  |
| Veto Counter |  |