| Param | Original file | Final file |
|---|---|---|
| Filename | modeM0/AS1A04_148T01_9000002162_14644cztM0_level2.evt | modeM0/AS1A04_148T01_9000002162_14644cztM0_level2_quad_clean.evt |
| Size (bytes) | 264,245,760 | 41,676,480 |
| Size | 252.0 MB | 39.7 MB |
| Events in quadrant A | 1,743,431 | 260,275 |
| Events in quadrant B | 1,732,301 | 261,720 |
| Events in quadrant C | 2,353,468 | 256,595 |
| Events in quadrant D | 1,949,512 | 250,269 |
| Mode SS | |||
|---|---|---|---|
| Quadrant | BADHDUFLAG | Total packets | Discarded packets |
| A | 0 | 68 | 0 |
| B | 0 | 68 | 0 |
| C | 0 | 68 | 0 |
| D | 0 | 68 | 0 |
| Mode M9 | |||
|---|---|---|---|
| Quadrant | BADHDUFLAG | Total packets | Discarded packets |
| A | 0 | 11 | 0 |
| B | 0 | 11 | 0 |
| C | 0 | 11 | 0 |
| D | 0 | 11 | 0 |
| Mode M0 | |||
|---|---|---|---|
| Quadrant | BADHDUFLAG | Total packets | Discarded packets |
| A | 0 | 7288 | 2 |
| B | 0 | 7292 | 1 |
| C | 0 | 9213 | 1 |
| D | 0 | 7904 | 1 |
| Quadrant | Total seconds | Saturated seconds | Saturation percentage |
|---|---|---|---|
| A | 3275 | 53 | 1.618321% |
| B | 3275 | 64 | 1.954198% |
| C | 3275 | 67 | 2.045802% |
| D | 3275 | 116 | 3.541985% |
Noise dominated data is calculated using 1-second bins in cleaned event files. If a bin has >2000 counts, and if more than 50% of those come from <1% of pixels, then it is considered to be noise-dominated and hence unusable.
| Quadrant | # 1 sec bins | Bins with >0 counts | Bins with >2000 counts | High rate bins dominated by noise | Noise dominated (total time) | Noise dominated (detector-on time) | Marked lightcurve |
|---|---|---|---|---|---|---|---|
| A | 4406 | 3276 | 0 | 0 | 0.00% | 0.00% | 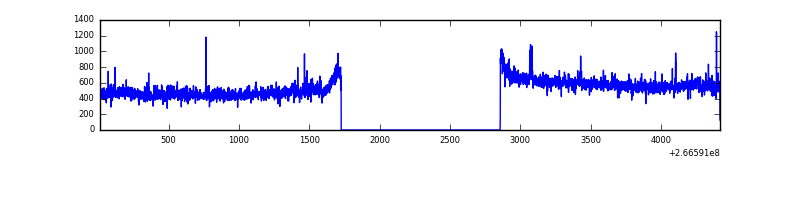 |
| B | 4406 | 3276 | 4 | 4 | 0.09% | 0.12% | 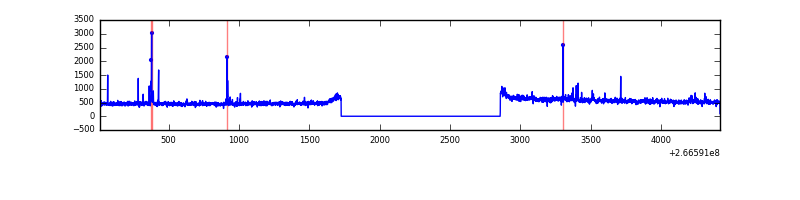 |
| C | 4406 | 3276 | 0 | 0 | 0.00% | 0.00% | 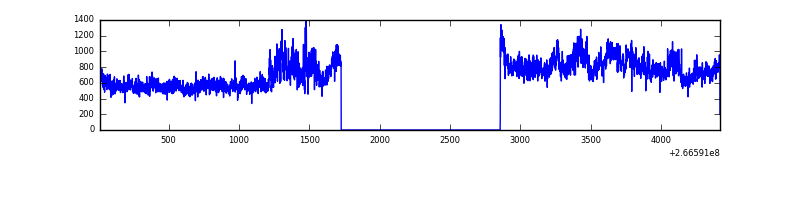 |
| D | 4406 | 3276 | 71 | 71 | 1.61% | 2.17% | 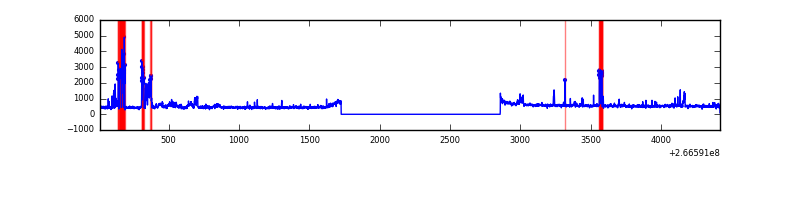 |
Top three noisy pixels from each quadrant. If the there are fewer than three noisy pixels in the level2.evt file, extra rows are filled as -1
| Pixel properties | Quadrant properties | ||||||
|---|---|---|---|---|---|---|---|
| Quadrant | DetID | PixID | Counts | Sigma | Mean | Median | Sigma |
| A | 8 | 15 | 32843 | 376.85 | 427 | 419 | 86.0 |
| A | 0 | 23 | 19105 | 217.18 | 427 | 419 | 86.0 |
| A | 1 | 162 | 14628 | 165.14 | 427 | 419 | 86.0 |
| B | 4 | 173 | 21317 | 256.77 | 426 | 416 | 81.4 |
| B | 10 | 247 | 11477 | 135.88 | 426 | 416 | 81.4 |
| B | 12 | 111 | 9032 | 105.85 | 426 | 416 | 81.4 |
| C | 3 | 233 | 734852 | 7698.81 | 413 | 415 | 95.4 |
| C | 8 | 128 | 3756 | 35.02 | 413 | 415 | 95.4 |
| C | 13 | 61 | 3116 | 28.31 | 413 | 415 | 95.4 |
| D | 15 | 0 | 317581 | 2993.61 | 409 | 398 | 106.0 |
| D | 12 | 110 | 36967 | 345.14 | 409 | 398 | 106.0 |
| D | 2 | 234 | 10838 | 98.53 | 409 | 398 | 106.0 |
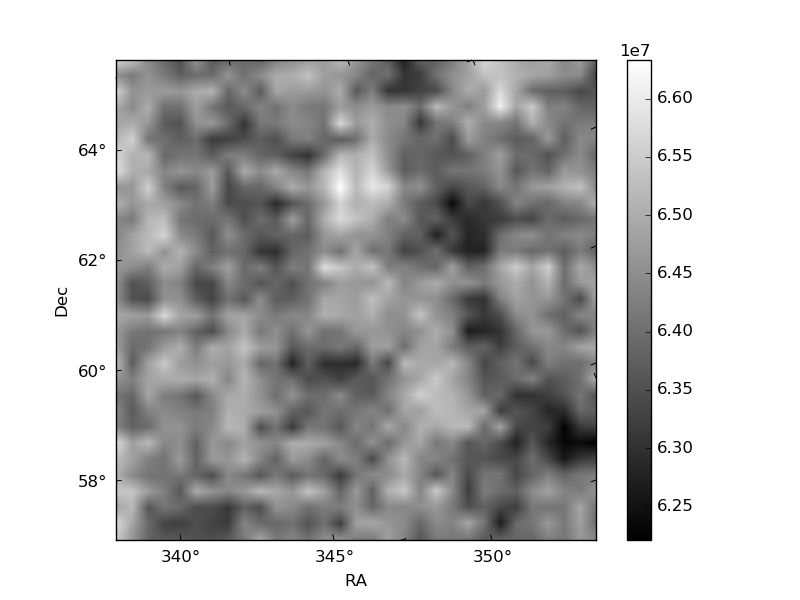
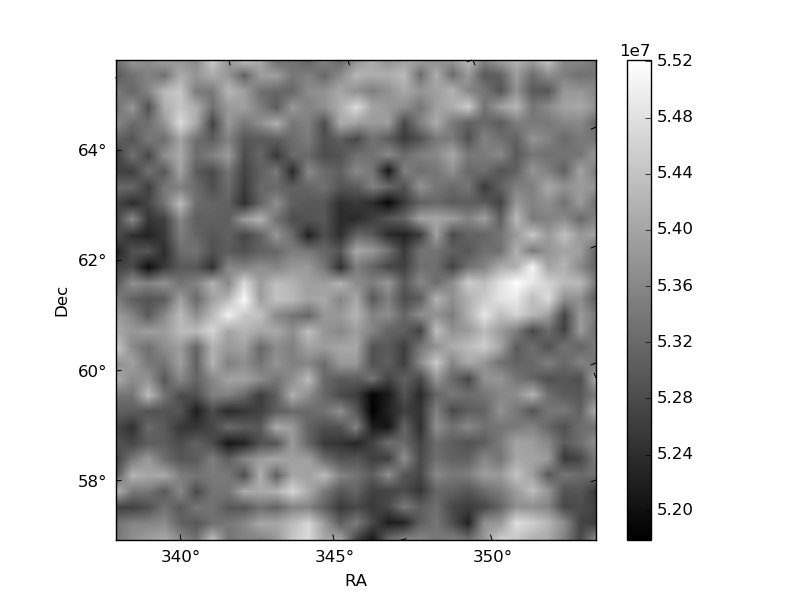
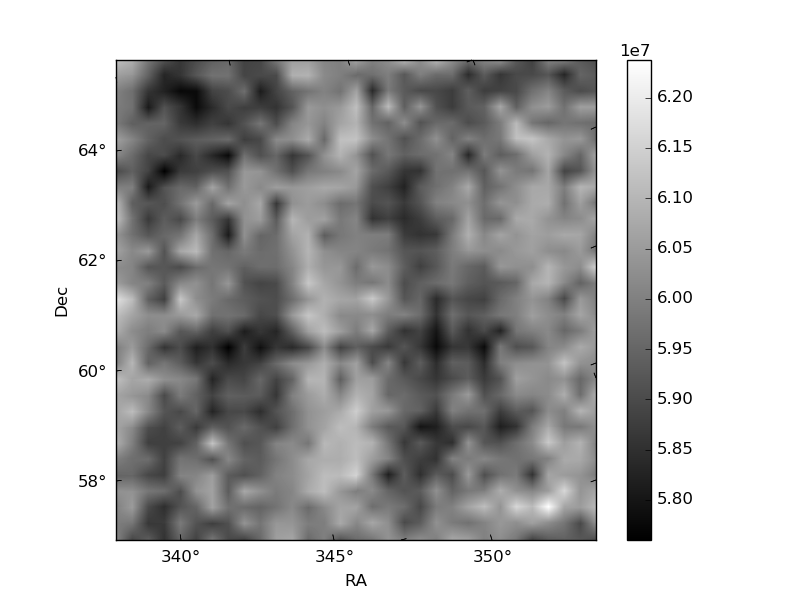
Histogram calculated using DETX and DETY for each event in the final _common_clean file
| Quadrant A |  |
 |
Quadrant B |
|---|---|---|---|
| Quadrant D |  |
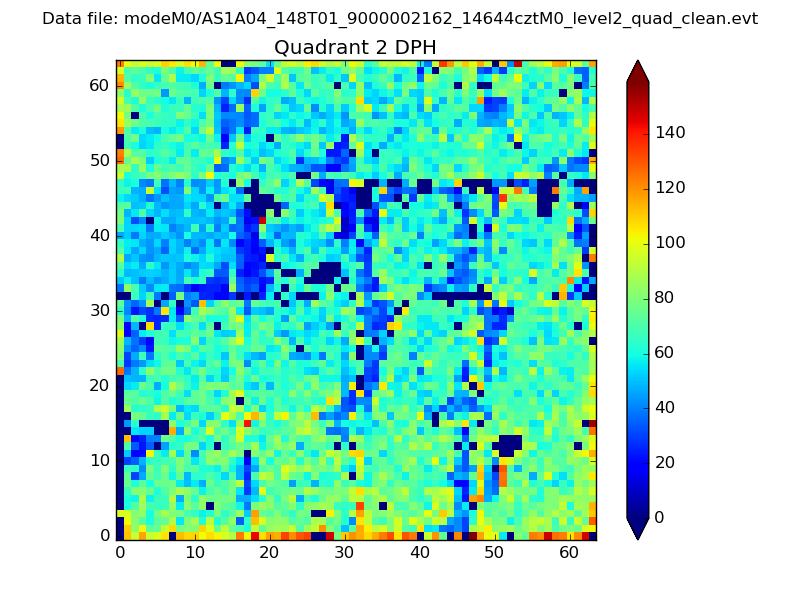 |
Quadrant C |
| Plot type | Count rate plots | Images |
|---|---|---|
| Comparison with Poisson distribution Blue bars denote a histogram of data divided into 1 sec bins. Red curve is a Poisson curve with rate = median count rate of data. |
 |
 |
| Quadrant-wise count rates Data is divided into 100 sec bins |
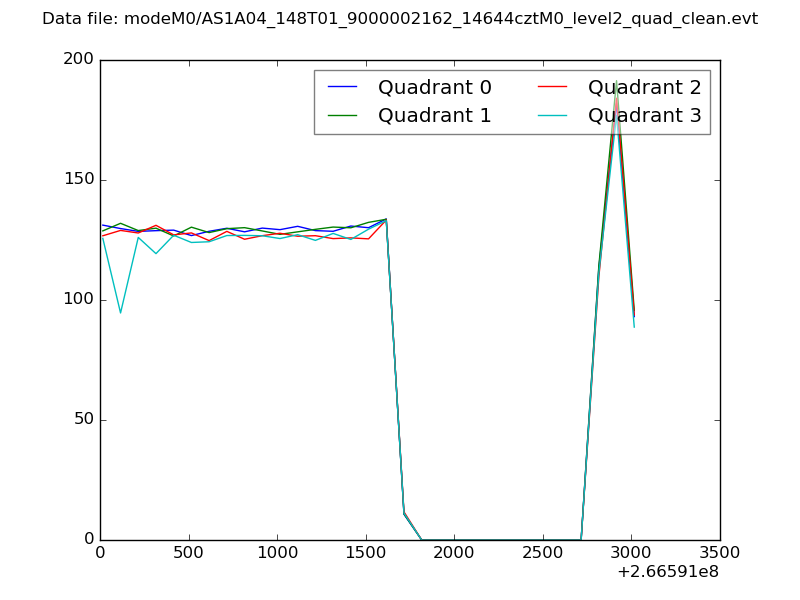 |
|
| Module-wise count rates for Quadrant A Data is divided into 100 sec bins |
 |
 |
| Module-wise count rates for Quadrant B Data is divided into 100 sec bins |
 |
 |
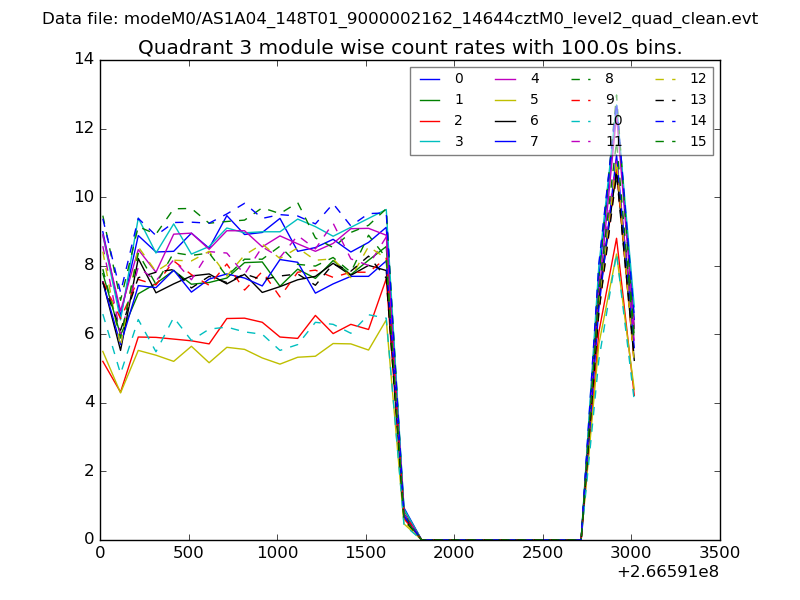
| Module-wise count rates for Quadrant C Data is divided into 100 sec bins |
 |
 |
| Module-wise count rates for Quadrant D Data is divided into 100 sec bins |
 |
 |
| Parameter | Plot |
|---|---|
| CZT HV Monitor |  |
| D_VDD | 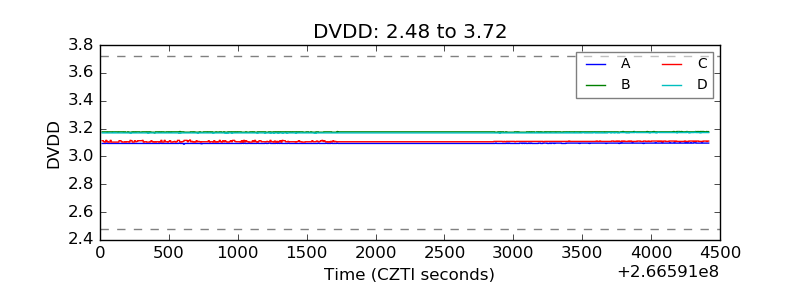 |
| Temperature 1 |  |
| Veto HV Monitor | 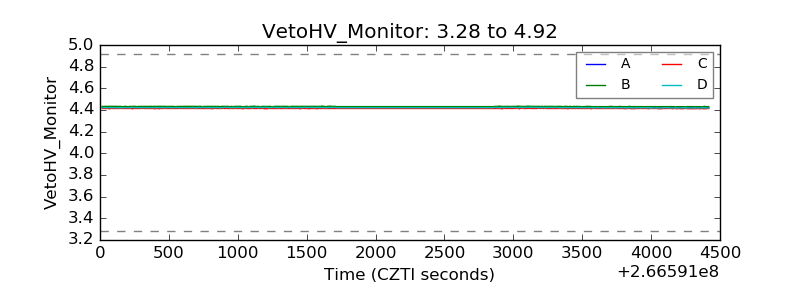 |
| Veto LLD | 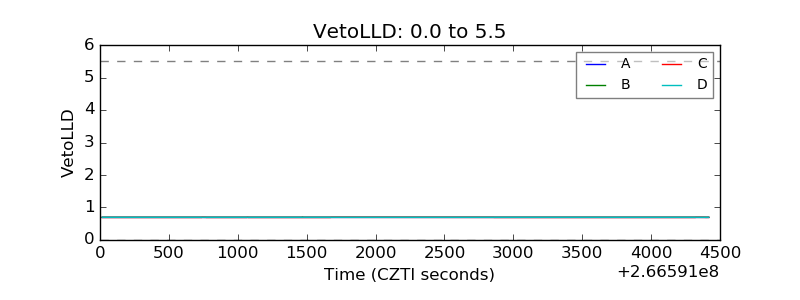 |
| Alpha Counter | 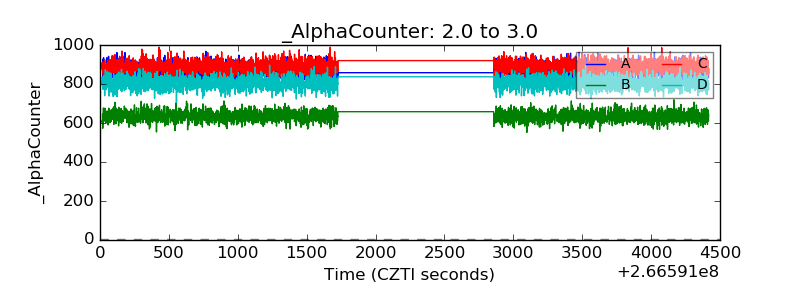 |
| _CPM_Rate | 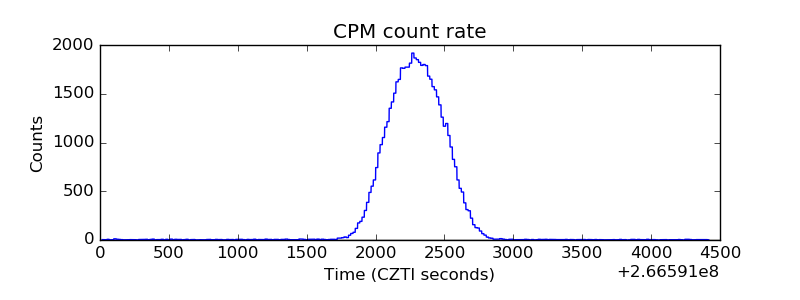 |
| CZT Counter | 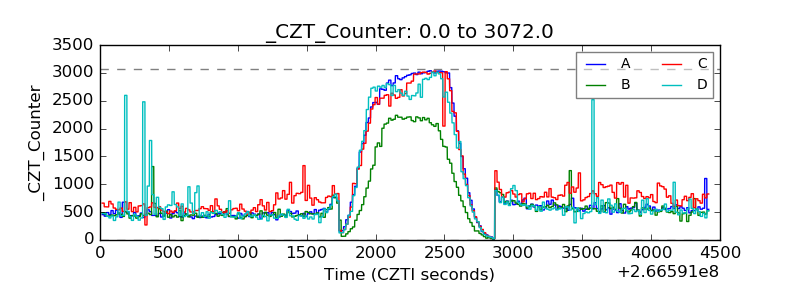 |
| +2.5 Volts monitor |  |
| +5 Volts monitor |  |
| _ROLL_ROT | 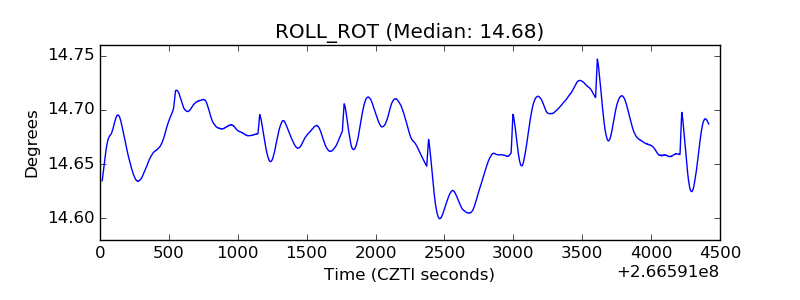 |
| _Roll_DEC | 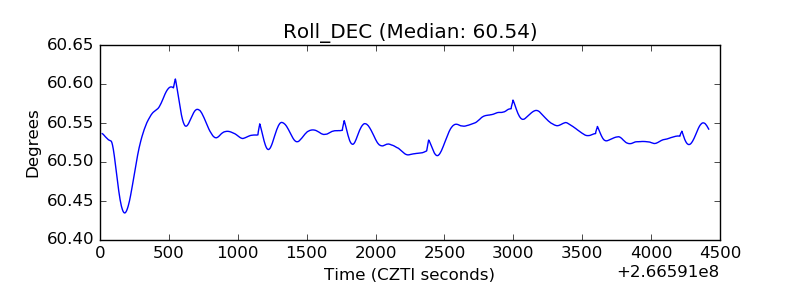 |
| _Roll_RA | 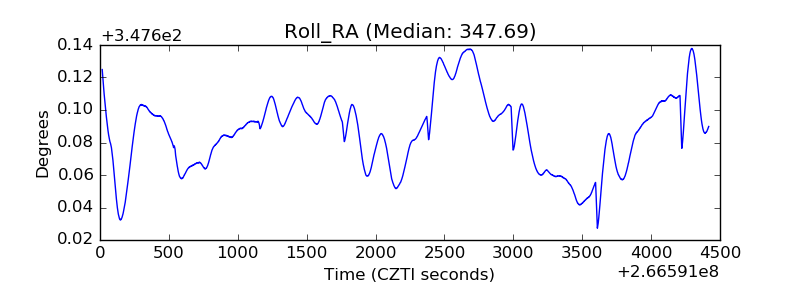 |
| Veto Counter | 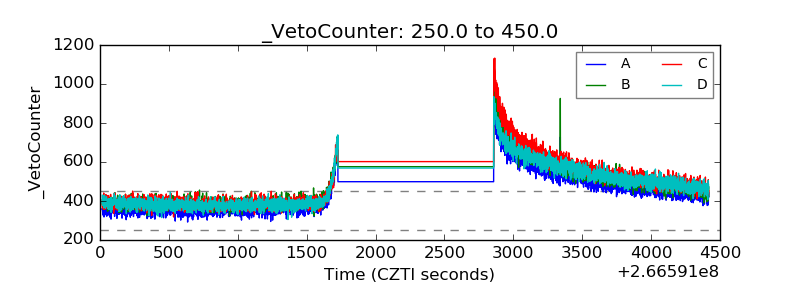 |