| Param | Original file | Final file |
|---|---|---|
| Filename | modeM0/AS1A04_148T01_9000002162_14646cztM0_level2.evt | modeM0/AS1A04_148T01_9000002162_14646cztM0_level2_quad_clean.evt |
| Size (bytes) | 570,559,680 | 76,492,800 |
| Size | 544.1 MB | 72.9 MB |
| Events in quadrant A | 5,009,786 | 459,327 |
| Events in quadrant B | 3,540,845 | 477,405 |
| Events in quadrant C | 4,446,445 | 468,693 |
| Events in quadrant D | 3,843,103 | 457,939 |
| Mode SS | |||
|---|---|---|---|
| Quadrant | BADHDUFLAG | Total packets | Discarded packets |
| A | 0 | 132 | 0 |
| B | 0 | 132 | 0 |
| C | 0 | 132 | 0 |
| D | 0 | 132 | 0 |
| Mode M9 | |||
|---|---|---|---|
| Quadrant | BADHDUFLAG | Total packets | Discarded packets |
| A | 0 | 15 | 0 |
| B | 0 | 15 | 0 |
| C | 0 | 15 | 0 |
| D | 0 | 16 | 0 |
| Mode M0 | |||
|---|---|---|---|
| Quadrant | BADHDUFLAG | Total packets | Discarded packets |
| A | 0 | 19018 | 3 |
| B | 0 | 14805 | 2 |
| C | 0 | 17782 | 2 |
| D | 0 | 15593 | 2 |
| Quadrant | Total seconds | Saturated seconds | Saturation percentage |
|---|---|---|---|
| A | 6489 | 473 | 7.289259% |
| B | 6489 | 106 | 1.633534% |
| C | 6489 | 106 | 1.633534% |
| D | 6489 | 208 | 3.205425% |
Noise dominated data is calculated using 1-second bins in cleaned event files. If a bin has >2000 counts, and if more than 50% of those come from <1% of pixels, then it is considered to be noise-dominated and hence unusable.
| Quadrant | # 1 sec bins | Bins with >0 counts | Bins with >2000 counts | High rate bins dominated by noise | Noise dominated (total time) | Noise dominated (detector-on time) | Marked lightcurve |
|---|---|---|---|---|---|---|---|
| A | 7710 | 6490 | 211 | 211 | 2.74% | 3.25% | 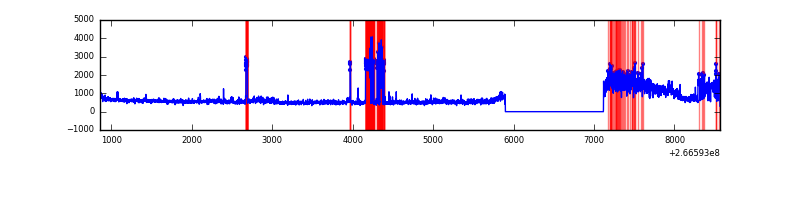 |
| B | 7710 | 6490 | 1 | 1 | 0.01% | 0.02% | 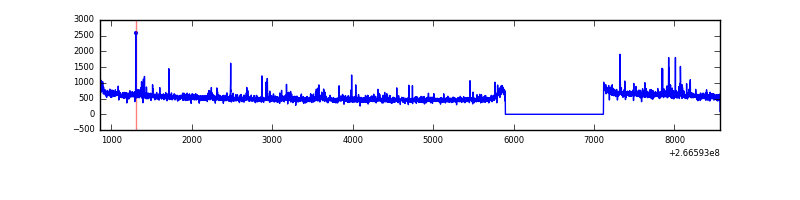 |
| C | 7710 | 6490 | 8 | 8 | 0.10% | 0.12% | 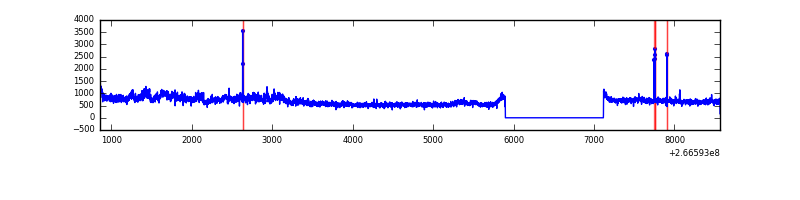 |
| D | 7710 | 6490 | 121 | 121 | 1.57% | 1.86% | 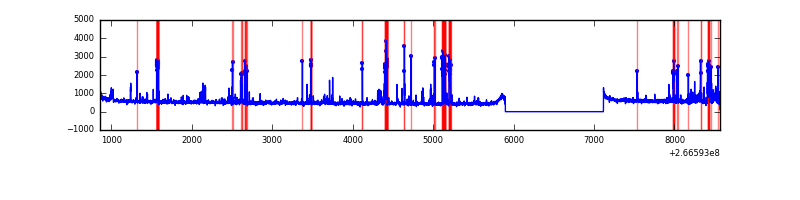 |
Top three noisy pixels from each quadrant. If the there are fewer than three noisy pixels in the level2.evt file, extra rows are filled as -1
| Pixel properties | Quadrant properties | ||||||
|---|---|---|---|---|---|---|---|
| Quadrant | DetID | PixID | Counts | Sigma | Mean | Median | Sigma |
| A | 0 | 253 | 1379555 | 8198.65 | 845 | 830 | 168.2 |
| A | 8 | 15 | 105656 | 623.35 | 845 | 830 | 168.2 |
| A | 0 | 23 | 80571 | 474.18 | 845 | 830 | 168.2 |
| B | 0 | 189 | 36305 | 222.45 | 859 | 839 | 159.4 |
| B | 0 | 219 | 26844 | 163.11 | 859 | 839 | 159.4 |
| B | 4 | 142 | 25751 | 156.26 | 859 | 839 | 159.4 |
| C | 3 | 233 | 1162164 | 6127.21 | 835 | 838 | 189.5 |
| C | 0 | 207 | 27928 | 142.93 | 835 | 838 | 189.5 |
| C | 13 | 61 | 6171 | 28.14 | 835 | 838 | 189.5 |
| D | 15 | 0 | 238112 | 1082.48 | 833 | 815 | 219.2 |
| D | 10 | 199 | 122060 | 553.08 | 833 | 815 | 219.2 |
| D | 12 | 110 | 73826 | 333.05 | 833 | 815 | 219.2 |
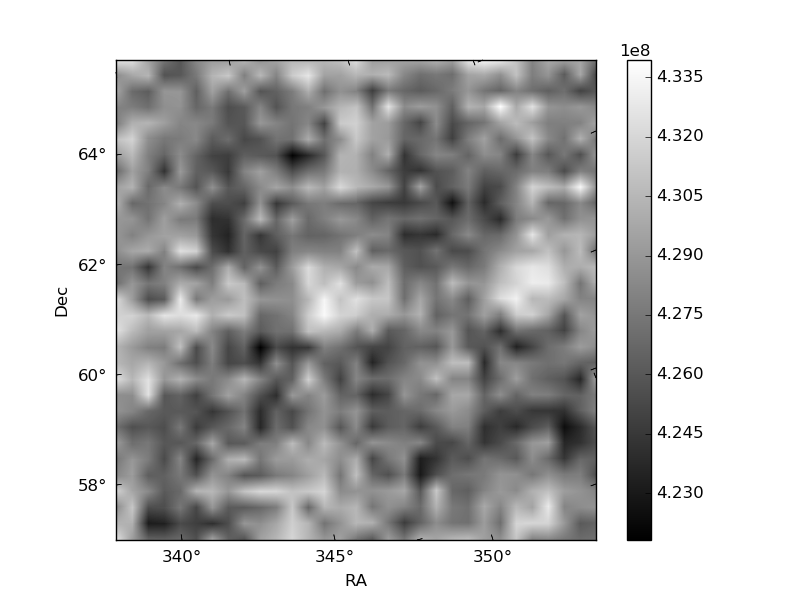
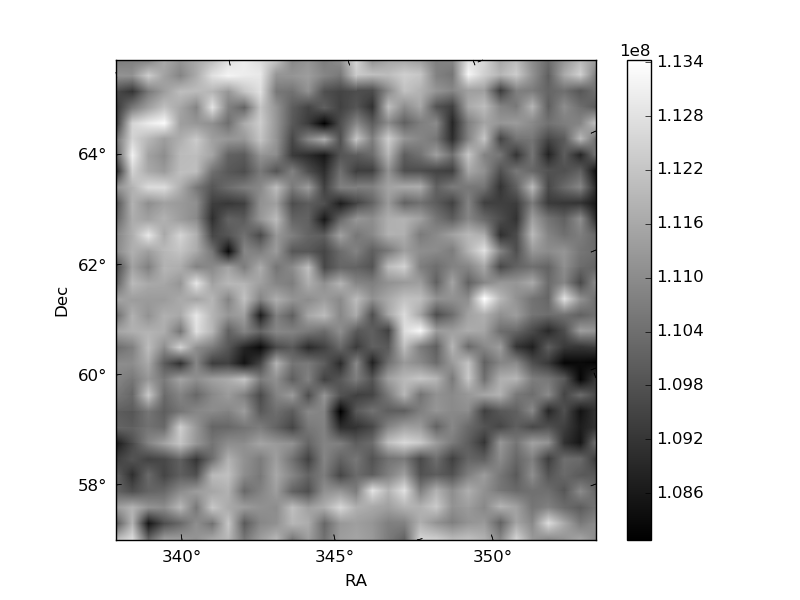
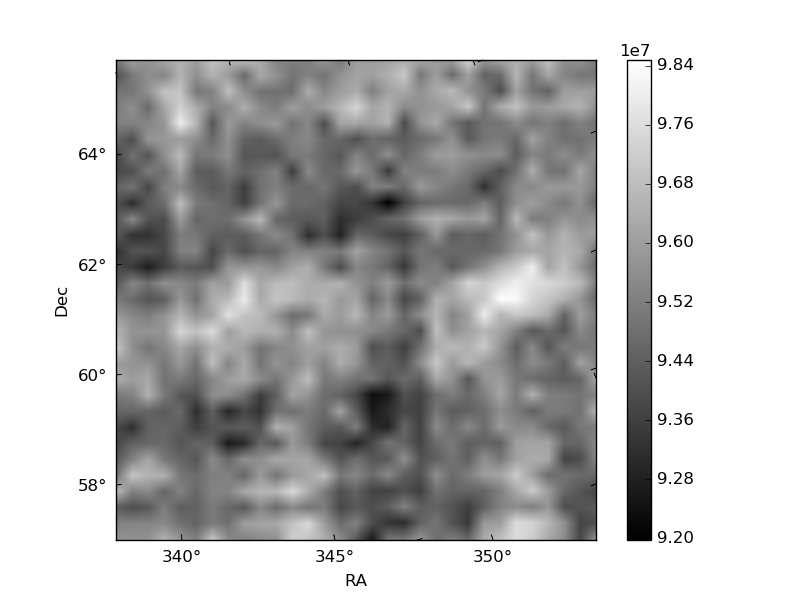
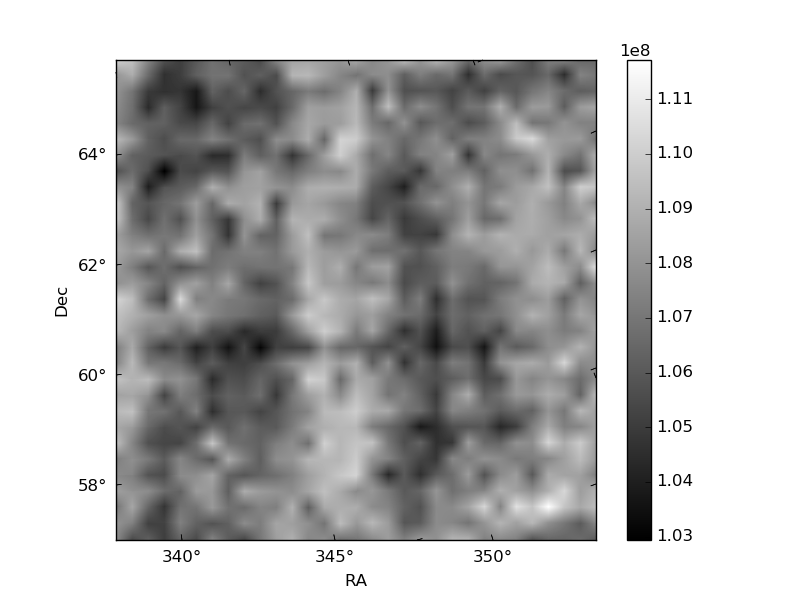
Histogram calculated using DETX and DETY for each event in the final _common_clean file
| Quadrant A | 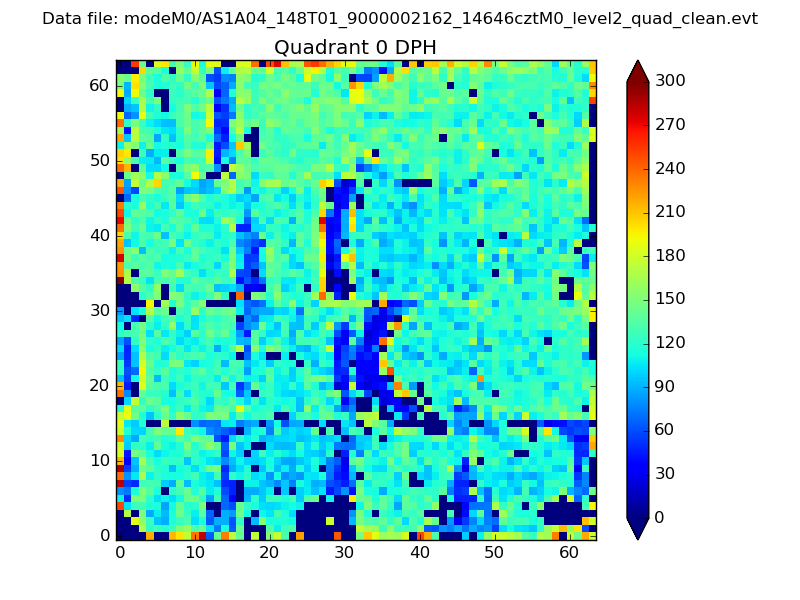 |
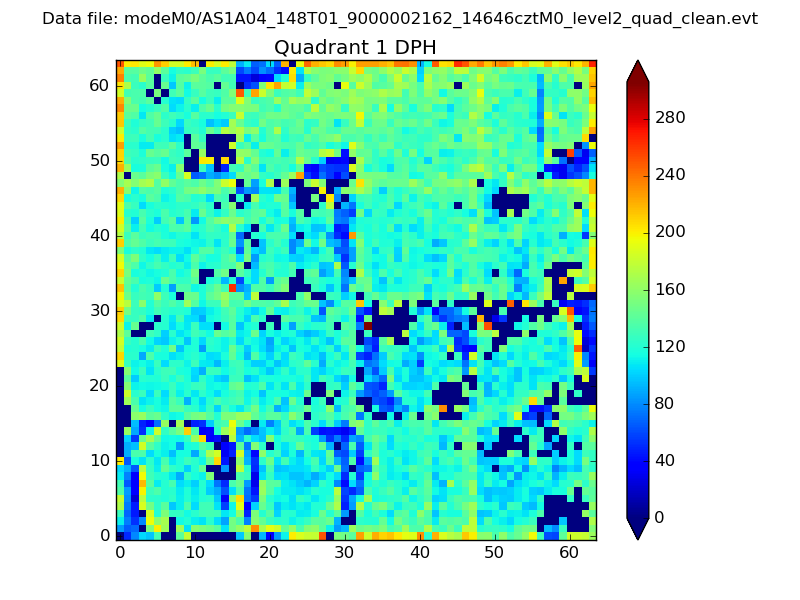 |
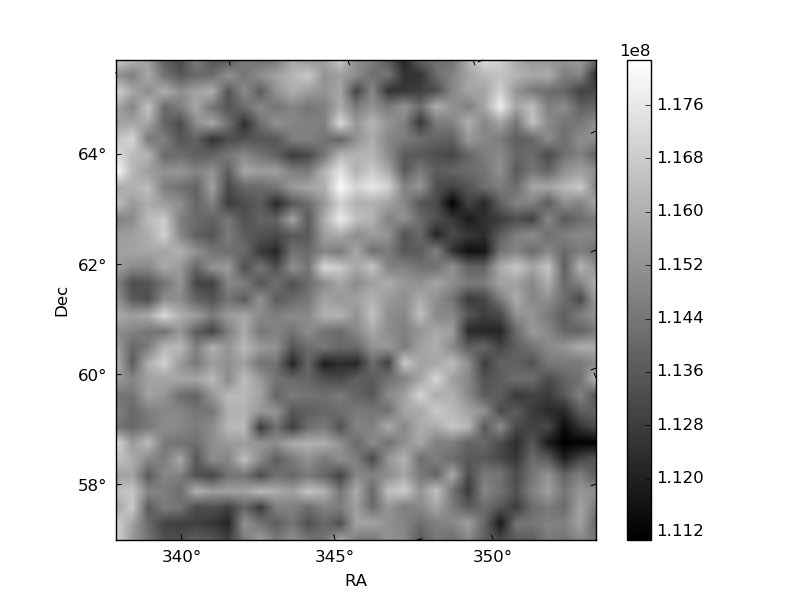
Quadrant B |
|---|---|---|---|
| Quadrant D | 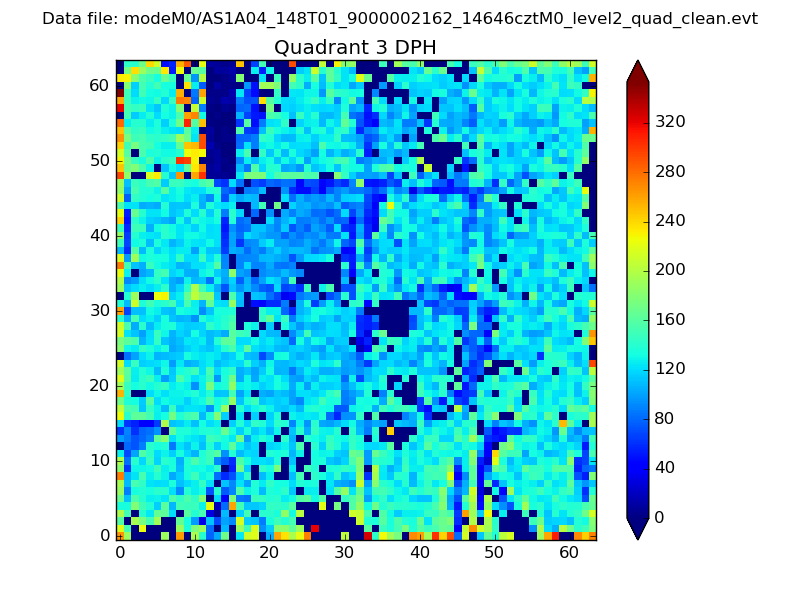 |
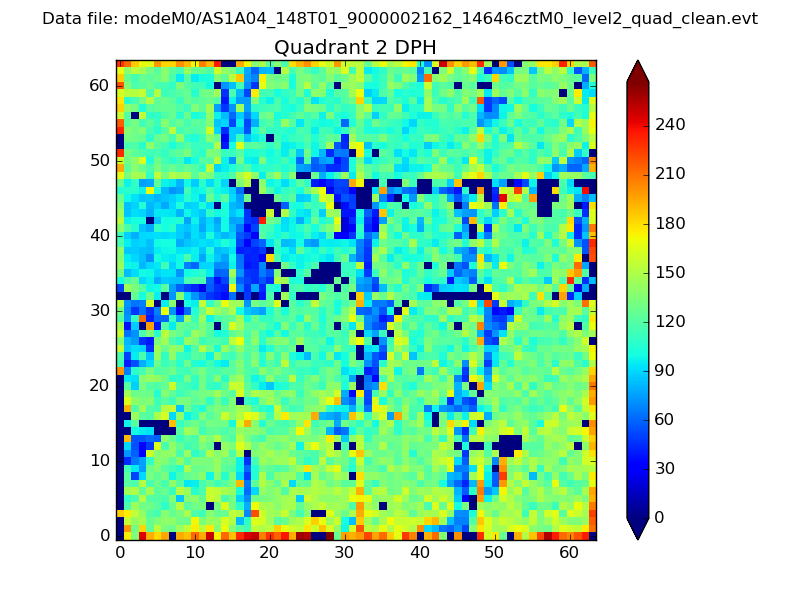 |
Quadrant C |
| Plot type | Count rate plots | Images |
|---|---|---|
| Comparison with Poisson distribution Blue bars denote a histogram of data divided into 1 sec bins. Red curve is a Poisson curve with rate = median count rate of data. |
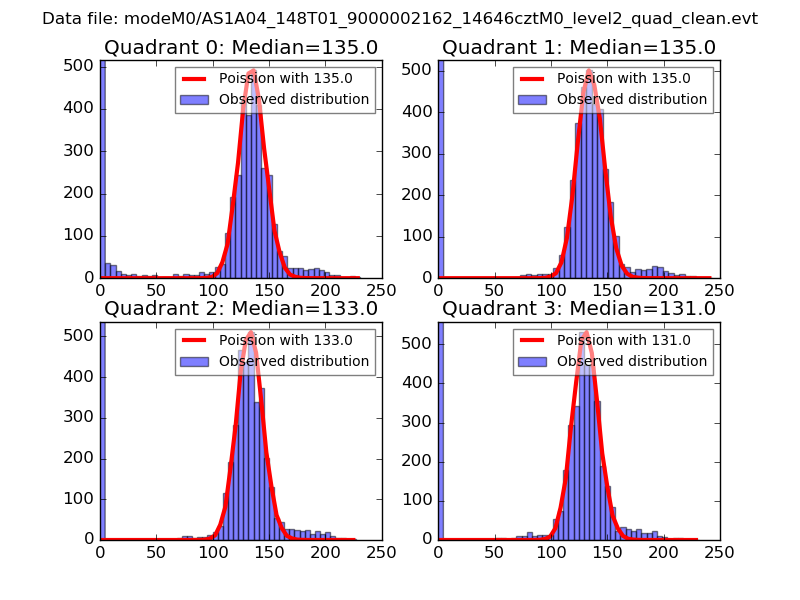 |
 |
| Quadrant-wise count rates Data is divided into 100 sec bins |
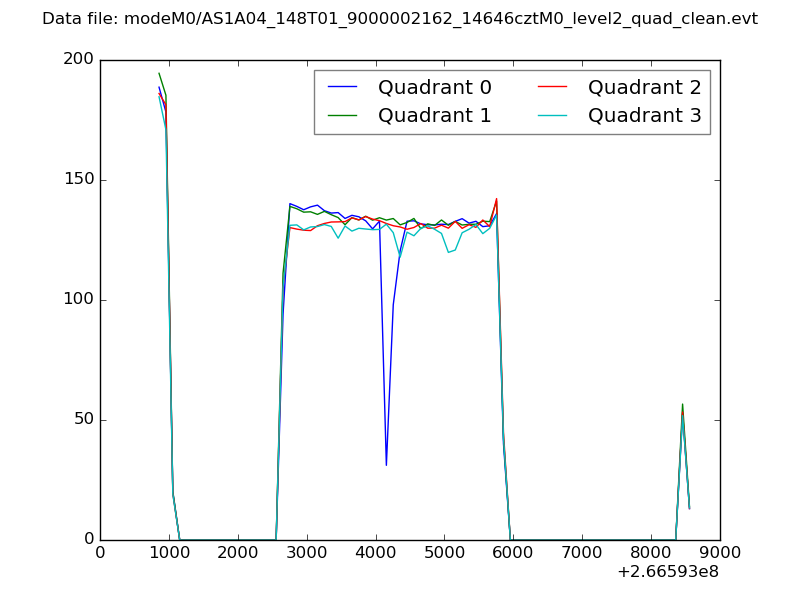 |
|
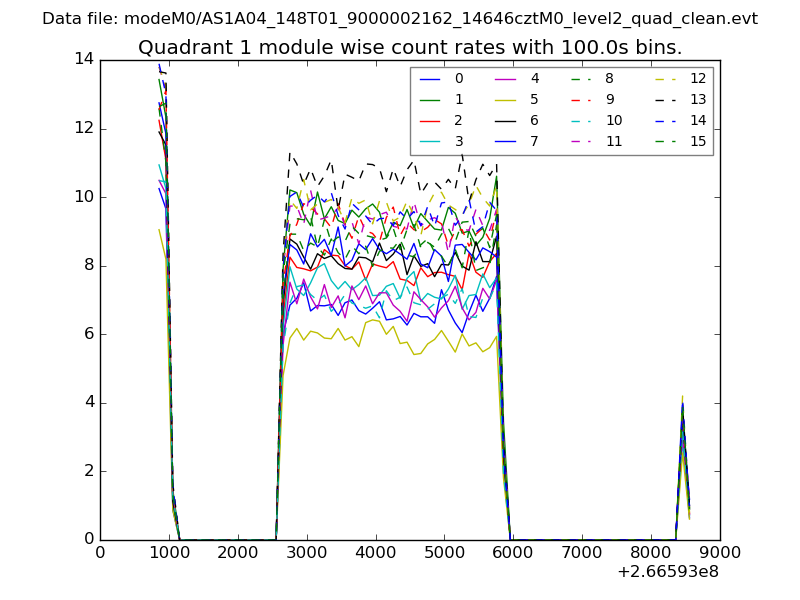
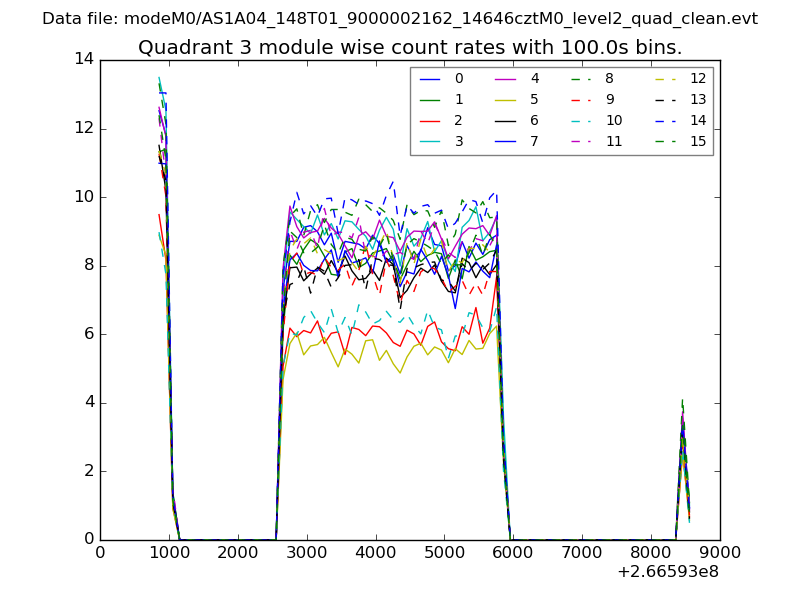
| Module-wise count rates for Quadrant A Data is divided into 100 sec bins |
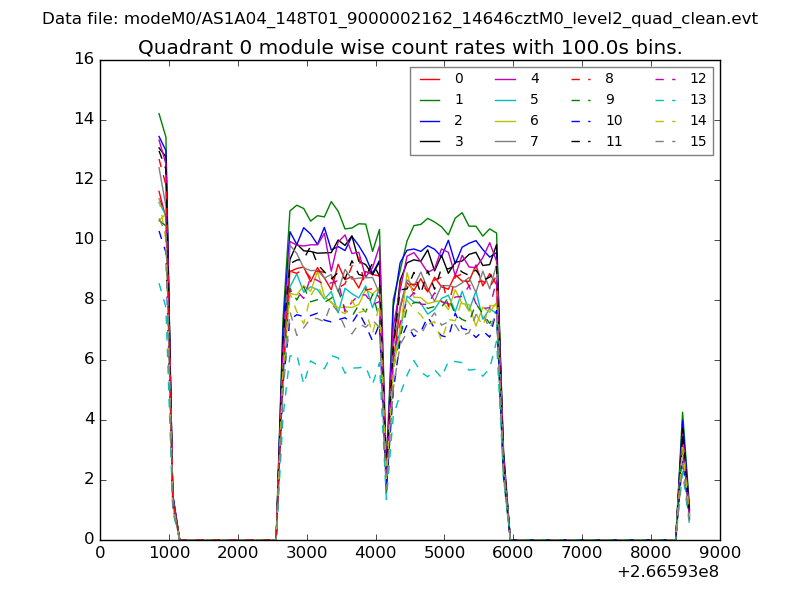 |
 |
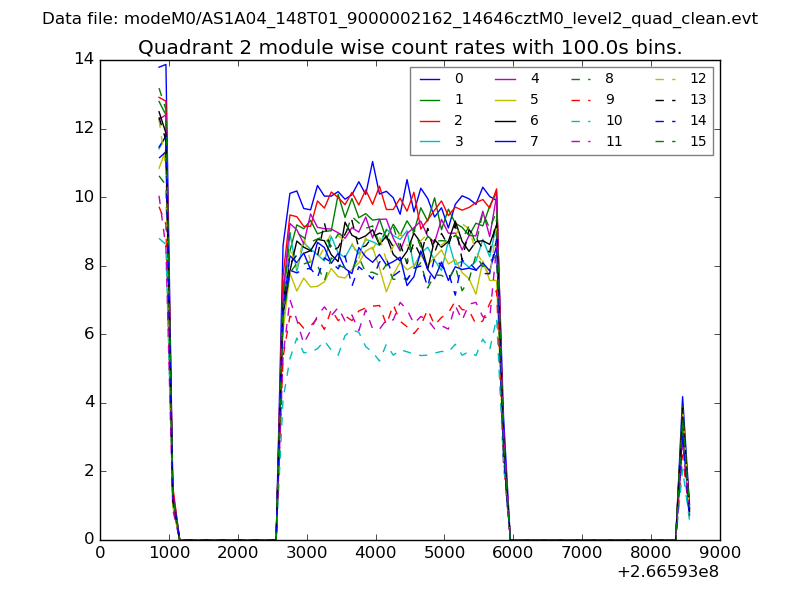
| Module-wise count rates for Quadrant B Data is divided into 100 sec bins |
 |
 |
| Module-wise count rates for Quadrant C Data is divided into 100 sec bins |
 |
 |
| Module-wise count rates for Quadrant D Data is divided into 100 sec bins |
 |
 |
| Parameter | Plot |
|---|---|
| CZT HV Monitor | 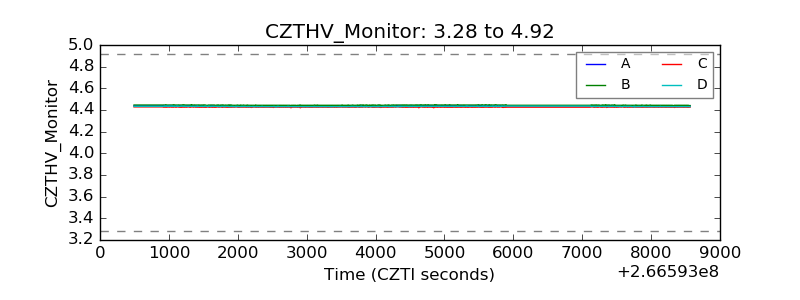 |
| D_VDD | 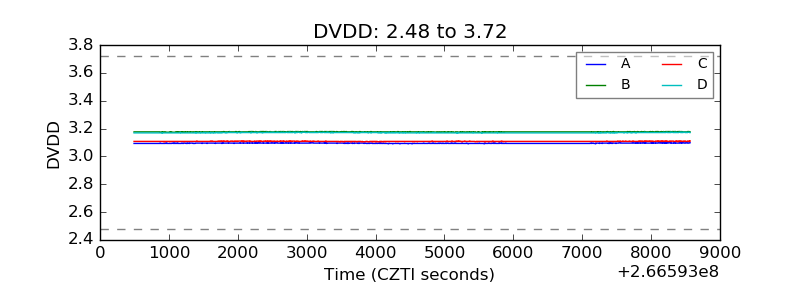 |
| Temperature 1 | 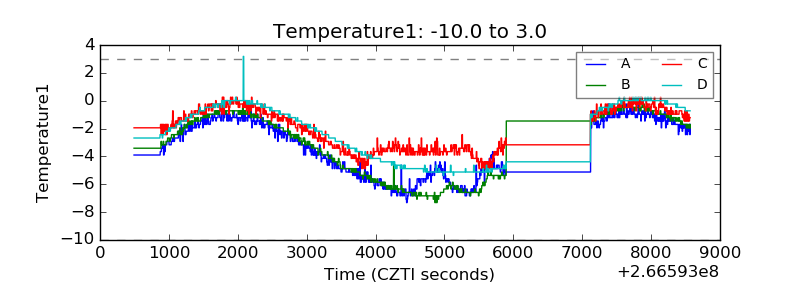 |
| Veto HV Monitor | 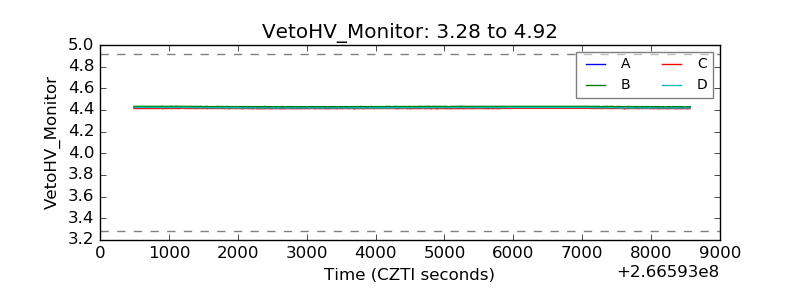 |
| Veto LLD | 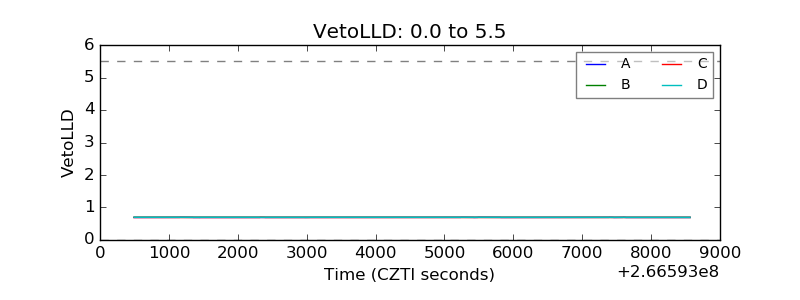 |
| Alpha Counter | 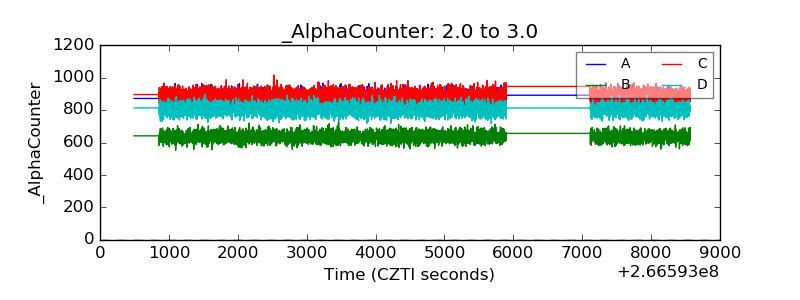 |
| _CPM_Rate | 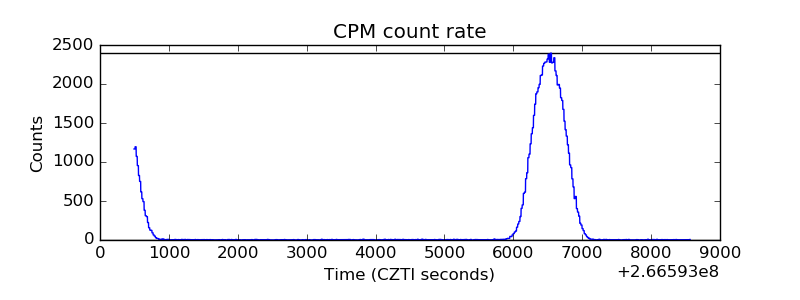 |
| CZT Counter |  |
| +2.5 Volts monitor |  |
| +5 Volts monitor | 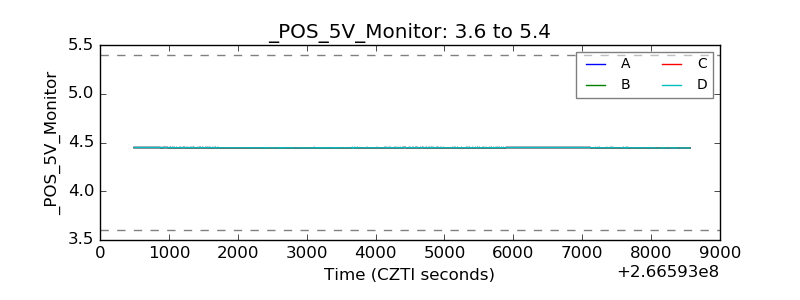 |
| _ROLL_ROT | 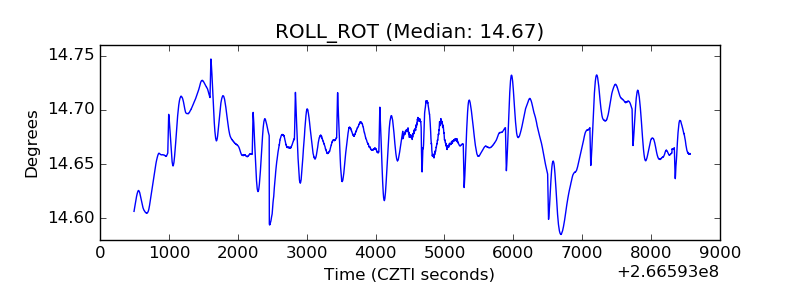 |
| _Roll_DEC | 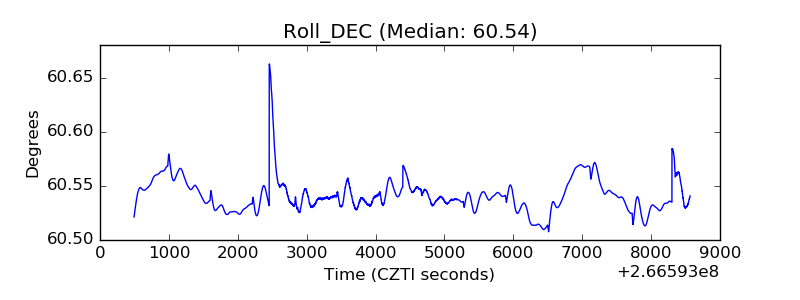 |
| _Roll_RA | 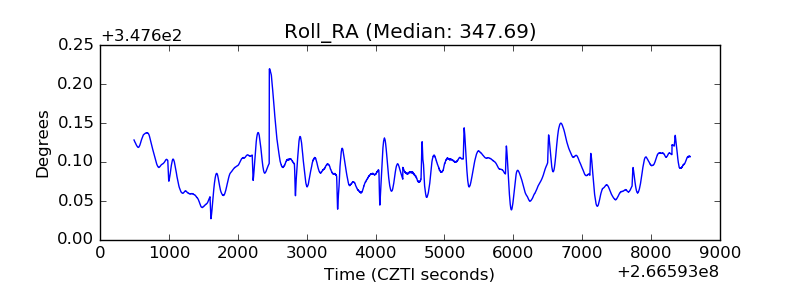 |
| Veto Counter | 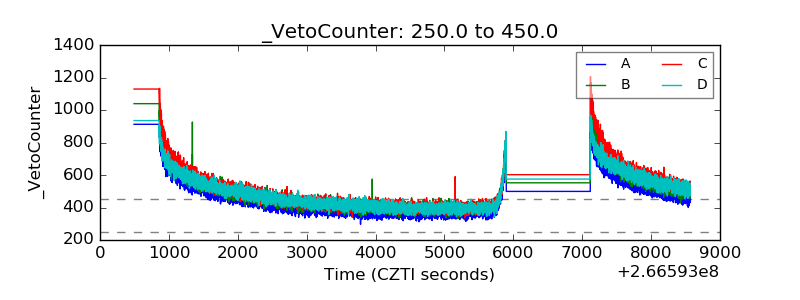 |