| Param | Original file | Final file |
|---|---|---|
| Filename | modeM0/AS1G08_076T02_9000002164cztM0_level2.fits | modeM0/AS1G08_076T02_9000002164cztM0_level2_quad_clean.evt |
| Size (bytes) | 235,100,160 | 182,160,000 |
| Size | 224.2 MB | 173.7 MB |
| Events in quadrant A | 1,345,734 | 917,478 |
| Events in quadrant B | 1,408,974 | 1,034,976 |
| Events in quadrant C | 1,430,246 | 971,597 |
| Events in quadrant D | 1,242,668 | 899,837 |
| Mode M9 | |||
|---|---|---|---|
| Quadrant | BADHDUFLAG | Total packets | Discarded packets |
| A | 0 | 45 | 0 |
| B | 0 | 45 | 0 |
| C | 0 | 45 | 0 |
| D | 0 | 45 | 0 |
| Mode SS | |||
|---|---|---|---|
| Quadrant | BADHDUFLAG | Total packets | Discarded packets |
| A | 0 | 502 | 0 |
| B | 0 | 502 | 0 |
| C | 0 | 502 | 0 |
| D | 0 | 502 | 0 |
| Mode M0 | |||
|---|---|---|---|
| Quadrant | BADHDUFLAG | Total packets | Discarded packets |
| A | 0 | 106189 | 0 |
| B | 0 | 52838 | 0 |
| C | 0 | 58991 | 0 |
| D | 0 | 57043 | 0 |
| Quadrant | Total seconds | Saturated seconds | Saturation percentage |
|---|---|---|---|
| A | 24584 | 2964 | 12.056622% |
| B | 24585 | 235 | 0.955867% |
| C | 24585 | 153 | 0.622331% |
| D | 24585 | 476 | 1.936140% |
Noise dominated data is calculated using 1-second bins in cleaned event files. If a bin has >2000 counts, and if more than 50% of those come from <1% of pixels, then it is considered to be noise-dominated and hence unusable.
| Quadrant | # 1 sec bins | Bins with >0 counts | Bins with >2000 counts | High rate bins dominated by noise | Noise dominated (total time) | Noise dominated (detector-on time) | Marked lightcurve |
|---|---|---|---|---|---|---|---|
| A | 32924 | 24578 | 0 | 0 | 0.00% | 0.00% | 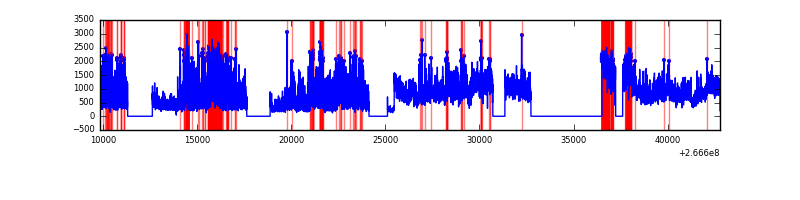 |
| B | 32924 | 24586 | 0 | 0 | 0.00% | 0.00% |  |
| C | 32924 | 24586 | 0 | 0 | 0.00% | 0.00% |  |
| D | 32924 | 24583 | 0 | 0 | 0.00% | 0.00% | 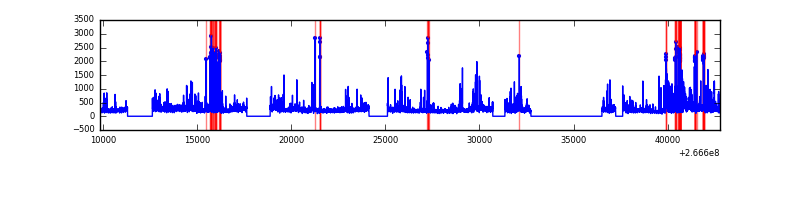 |
Top three noisy pixels from each quadrant. If the there are fewer than three noisy pixels in the level2.evt file, extra rows are filled as -1
| Pixel properties | Quadrant properties | ||||||
|---|---|---|---|---|---|---|---|
| Quadrant | DetID | PixID | Counts | Sigma | Mean | Median | Sigma |
| A | 0 | 29 | 1296 | 10.89 | 350 | 329 | 88.8 |
| A | 7 | 110 | 1112 | 8.81 | 350 | 329 | 88.8 |
| A | 9 | 19 | 983 | 7.36 | 350 | 329 | 88.8 |
| B | 2 | 9 | 1151 | 10.57 | 372 | 355 | 75.3 |
| B | 14 | 254 | 949 | 7.89 | 372 | 355 | 75.3 |
| B | 3 | 80 | 934 | 7.69 | 372 | 355 | 75.3 |
| C | 1 | 80 | 1086 | 7.4 | 378 | 352 | 99.1 |
| C | 1 | 81 | 1073 | 7.27 | 378 | 352 | 99.1 |
| C | 9 | 233 | 989 | 6.43 | 378 | 352 | 99.1 |
| D | 6 | 231 | 943 | 6.34 | 355 | 323 | 97.9 |
| D | 3 | 14 | 939 | 6.29 | 355 | 323 | 97.9 |
| D | 10 | 189 | 872 | 5.61 | 355 | 323 | 97.9 |
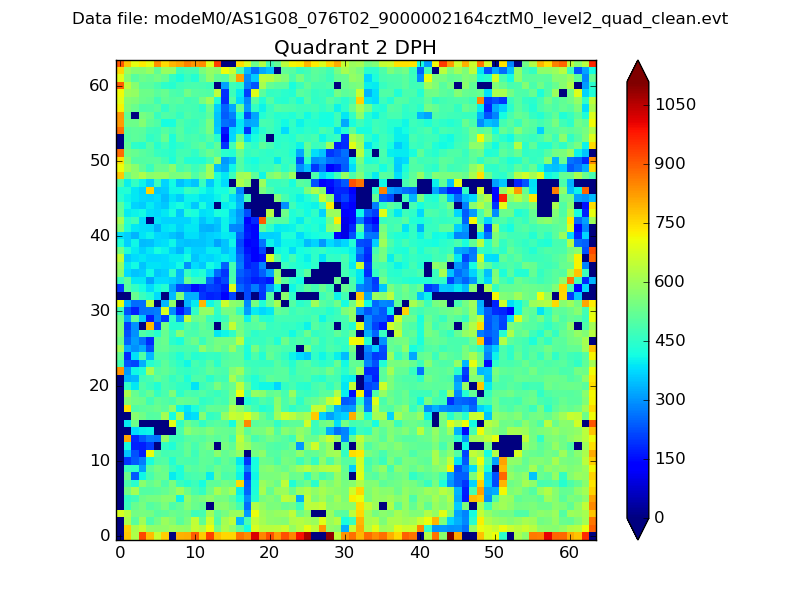
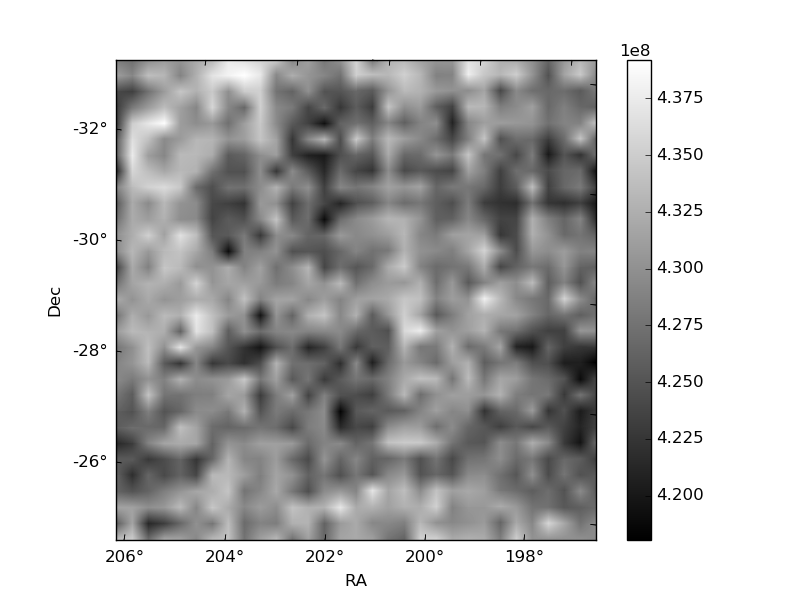
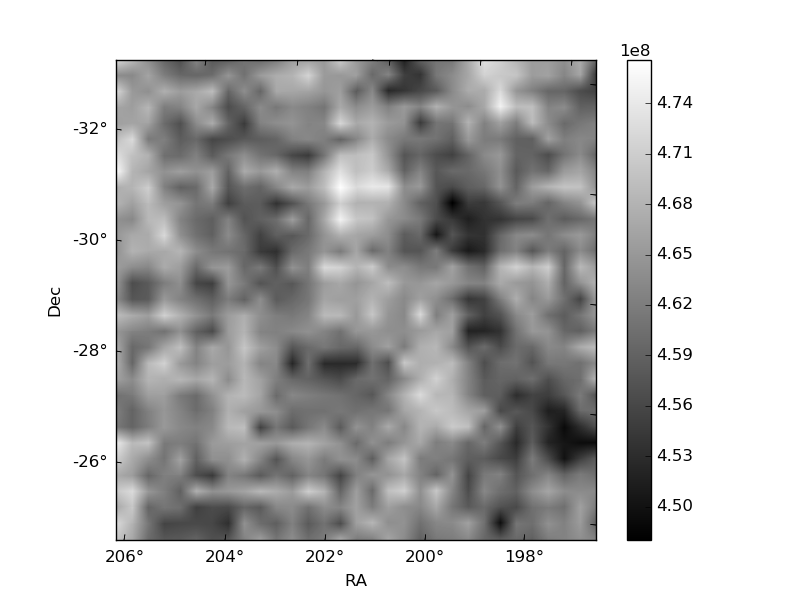
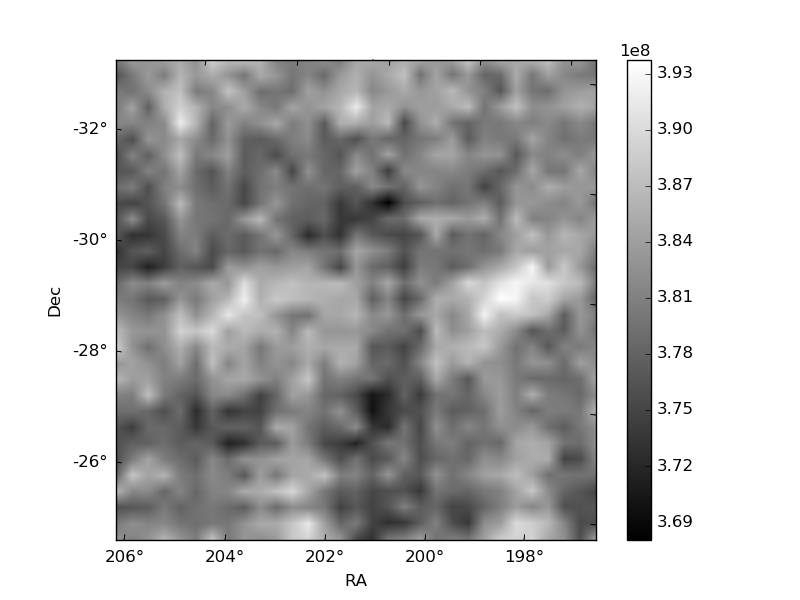
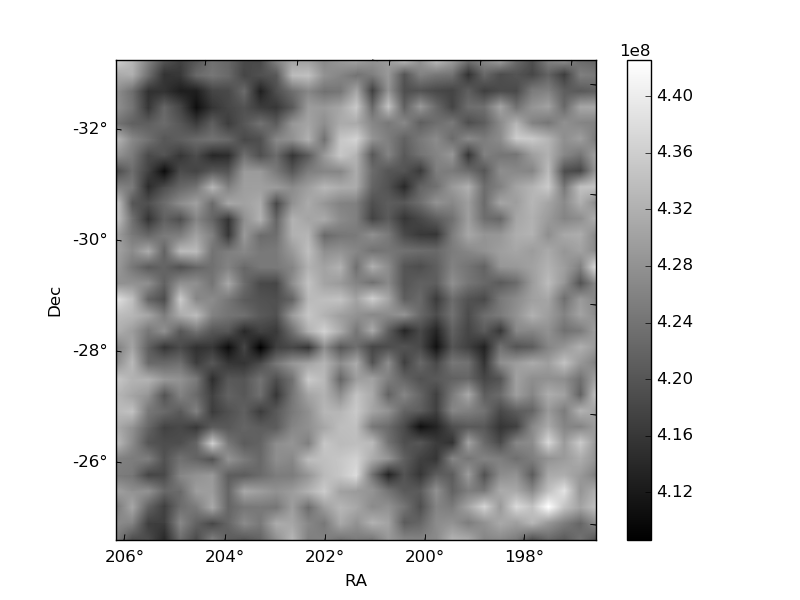
Histogram calculated using DETX and DETY for each event in the final _common_clean file
| Quadrant A | 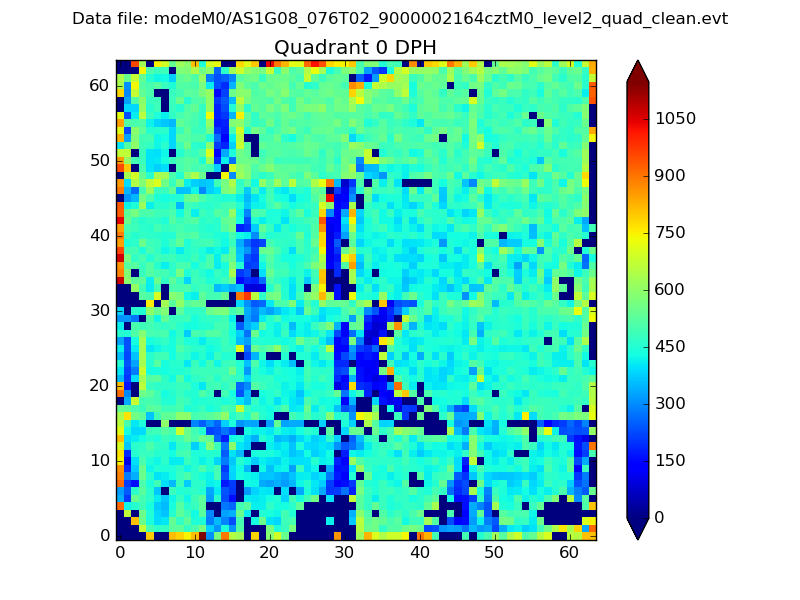 |
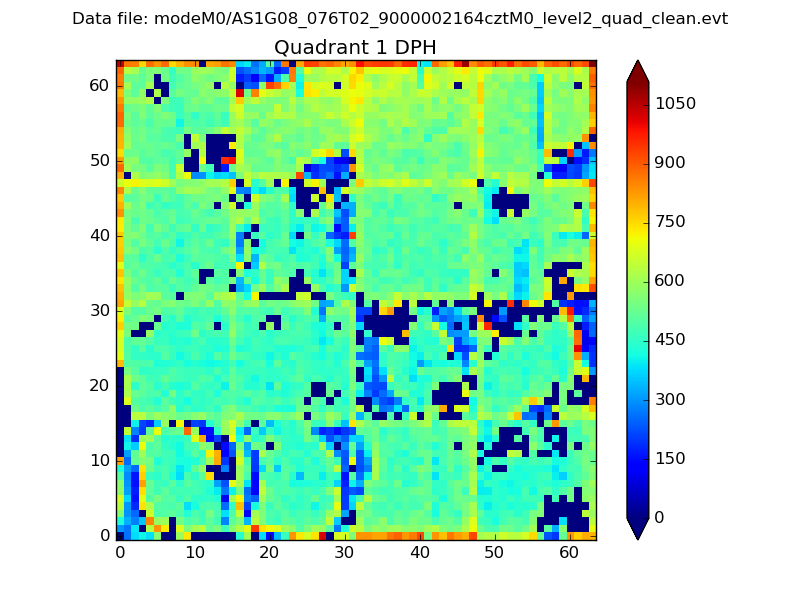 |
Quadrant B |
|---|---|---|---|
| Quadrant D | 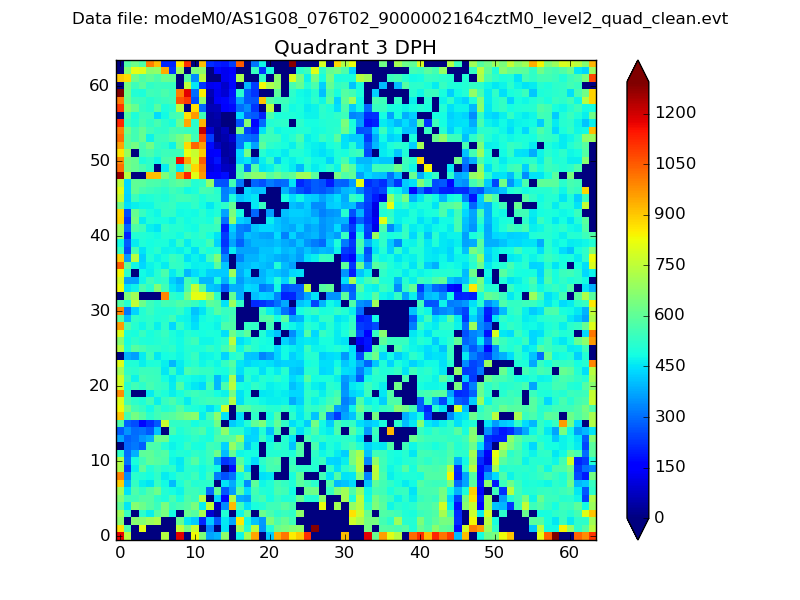 |
 |
Quadrant C |
| Plot type | Count rate plots | Images |
|---|---|---|
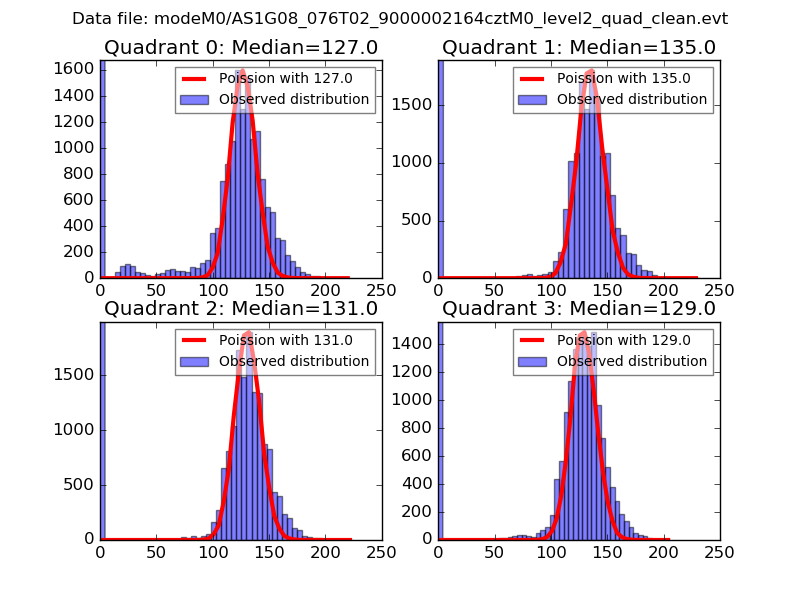
| Comparison with Poisson distribution Blue bars denote a histogram of data divided into 1 sec bins. Red curve is a Poisson curve with rate = median count rate of data. |
 |
 |
| Quadrant-wise count rates Data is divided into 100 sec bins |
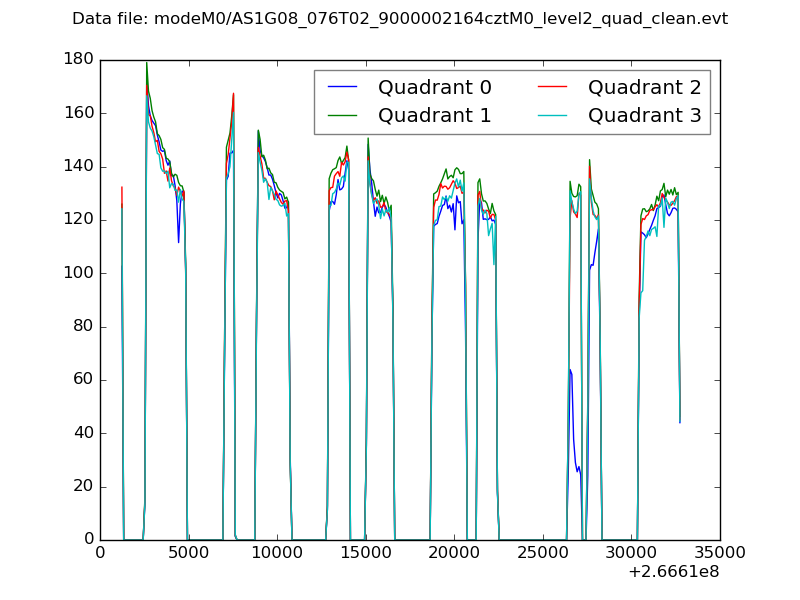 |
|
| Module-wise count rates for Quadrant A Data is divided into 100 sec bins |
 |
 |
| Module-wise count rates for Quadrant B Data is divided into 100 sec bins |
 |
 |
| Module-wise count rates for Quadrant C Data is divided into 100 sec bins |
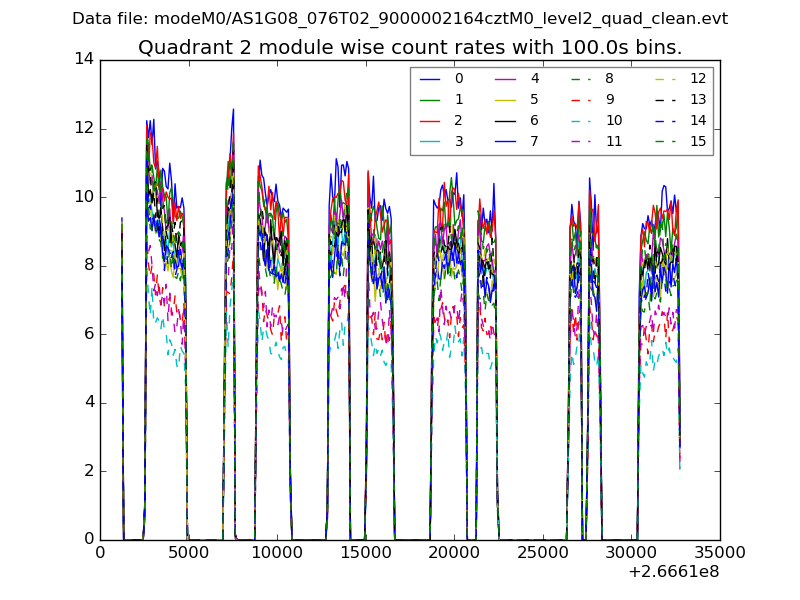 |
 |
| Module-wise count rates for Quadrant D Data is divided into 100 sec bins |
 |
 |
| Parameter | Plot |
|---|---|
| CZT HV Monitor | 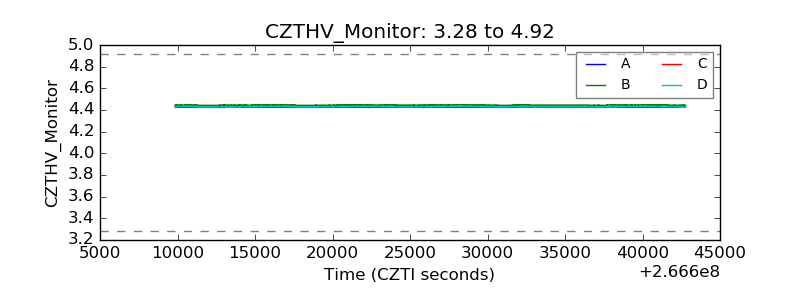 |
| D_VDD | 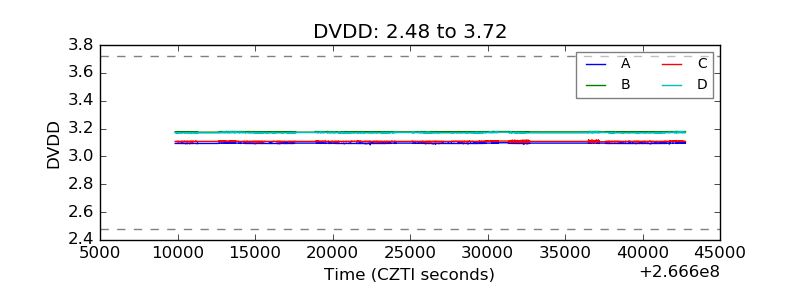 |
| Temperature 1 |  |
| Veto HV Monitor |  |
| Veto LLD | 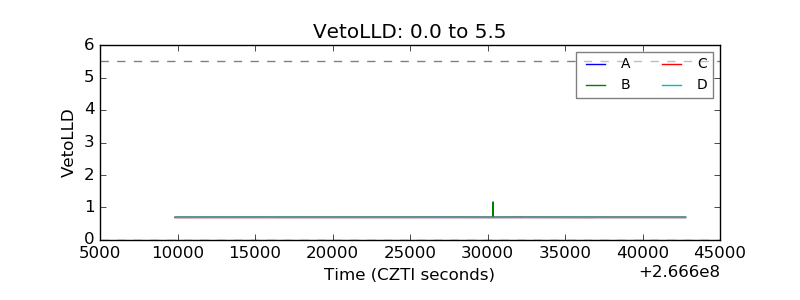 |
| Alpha Counter | 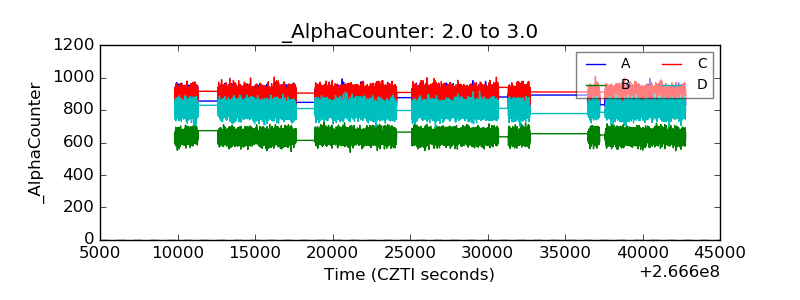 |
| _CPM_Rate | 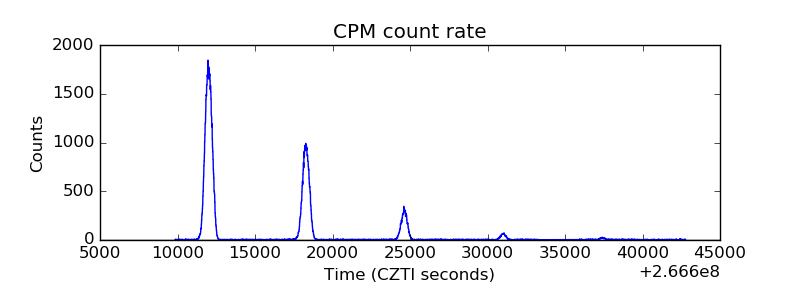 |
| CZT Counter |  |
| +2.5 Volts monitor |  |
| +5 Volts monitor |  |
| _ROLL_ROT |  |
| _Roll_DEC |  |
| _Roll_RA | 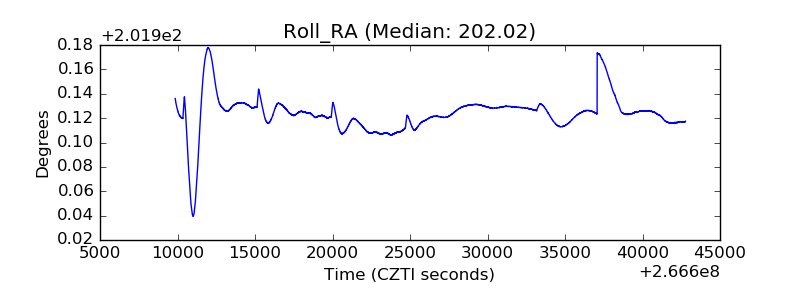 |
| Veto Counter | 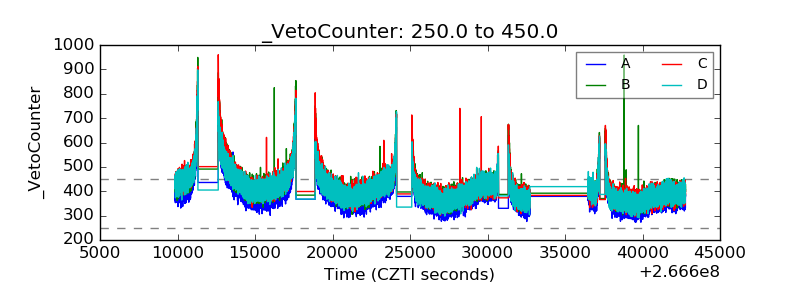 |