| Param | Original file | Final file |
|---|---|---|
| Filename | modeM0/AS1G08_076T02_9000002164_14649cztM0_level2.evt | modeM0/AS1G08_076T02_9000002164_14649cztM0_level2_quad_clean.evt |
| Size (bytes) | 599,797,440 | 93,571,200 |
| Size | 572.0 MB | 89.2 MB |
| Events in quadrant A | 6,803,105 | 596,772 |
| Events in quadrant B | 3,388,209 | 614,341 |
| Events in quadrant C | 3,860,131 | 594,574 |
| Events in quadrant D | 3,681,885 | 582,803 |
| Mode M9 | |||
|---|---|---|---|
| Quadrant | BADHDUFLAG | Total packets | Discarded packets |
| A | 0 | 19 | 0 |
| B | 0 | 19 | 0 |
| C | 0 | 19 | 0 |
| D | 0 | 20 | 0 |
| Mode SS | |||
|---|---|---|---|
| Quadrant | BADHDUFLAG | Total packets | Discarded packets |
| A | 0 | 130 | 0 |
| B | 0 | 130 | 0 |
| C | 0 | 130 | 0 |
| D | 0 | 130 | 0 |
| Mode M0 | |||
|---|---|---|---|
| Quadrant | BADHDUFLAG | Total packets | Discarded packets |
| A | 0 | 24707 | 3 |
| B | 0 | 14061 | 2 |
| C | 0 | 15748 | 2 |
| D | 0 | 14990 | 2 |
| Quadrant | Total seconds | Saturated seconds | Saturation percentage |
|---|---|---|---|
| A | 6379 | 676 | 10.597272% |
| B | 6379 | 67 | 1.050321% |
| C | 6379 | 38 | 0.595705% |
| D | 6379 | 149 | 2.335789% |
Noise dominated data is calculated using 1-second bins in cleaned event files. If a bin has >2000 counts, and if more than 50% of those come from <1% of pixels, then it is considered to be noise-dominated and hence unusable.
| Quadrant | # 1 sec bins | Bins with >0 counts | Bins with >2000 counts | High rate bins dominated by noise | Noise dominated (total time) | Noise dominated (detector-on time) | Marked lightcurve |
|---|---|---|---|---|---|---|---|
| A | 7625 | 6380 | 500 | 500 | 6.56% | 7.84% | 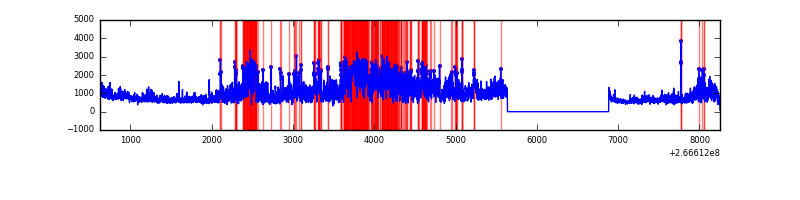 |
| B | 7625 | 6381 | 3 | 3 | 0.04% | 0.05% | 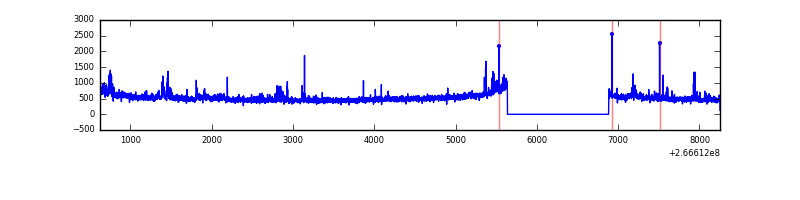 |
| C | 7625 | 6381 | 3 | 3 | 0.04% | 0.05% | 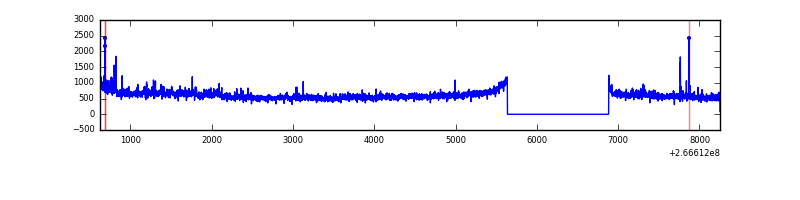 |
| D | 7625 | 6381 | 121 | 121 | 1.59% | 1.90% | 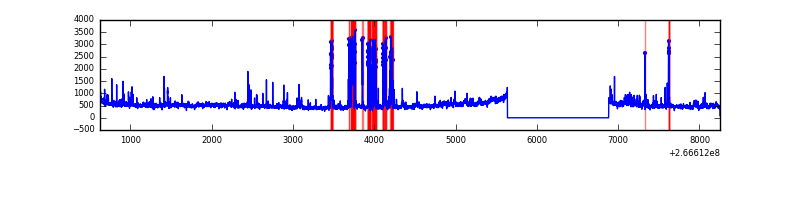 |
Top three noisy pixels from each quadrant. If the there are fewer than three noisy pixels in the level2.evt file, extra rows are filled as -1
| Pixel properties | Quadrant properties | ||||||
|---|---|---|---|---|---|---|---|
| Quadrant | DetID | PixID | Counts | Sigma | Mean | Median | Sigma |
| A | 0 | 253 | 3587206 | 22062.39 | 794 | 778 | 162.6 |
| A | 0 | 23 | 47850 | 289.57 | 794 | 778 | 162.6 |
| A | 12 | 189 | 38961 | 234.89 | 794 | 778 | 162.6 |
| B | 0 | 189 | 117364 | 765.42 | 810 | 793 | 152.3 |
| B | 0 | 190 | 26587 | 169.37 | 810 | 793 | 152.3 |
| B | 0 | 230 | 18628 | 117.11 | 810 | 793 | 152.3 |
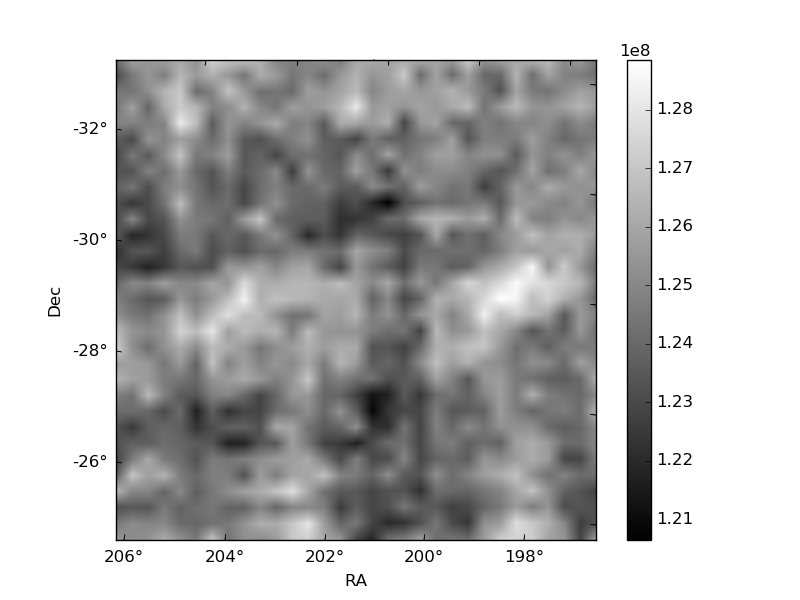
| C | 3 | 233 | 783650 | 4352.33 | 778 | 784 | 179.9 |
| C | 0 | 207 | 22907 | 122.99 | 778 | 784 | 179.9 |
| C | 5 | 223 | 20077 | 107.26 | 778 | 784 | 179.9 |
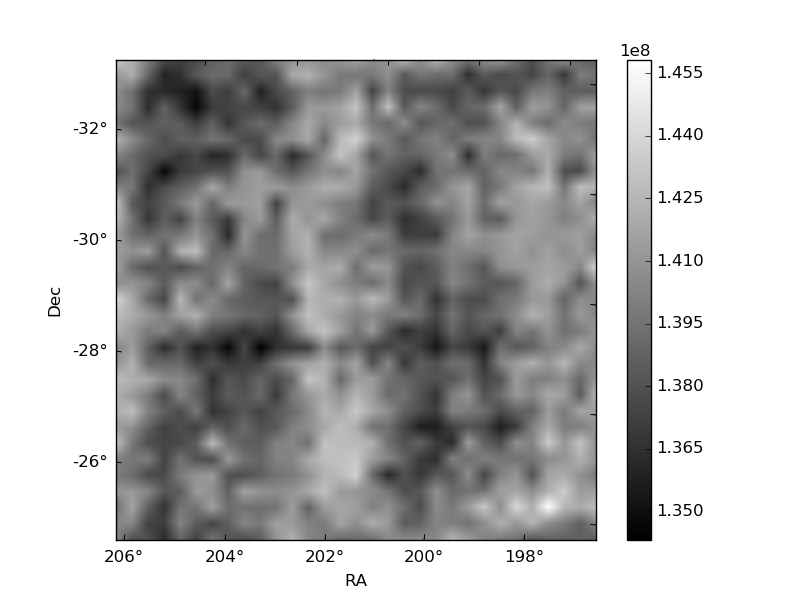
| D | 10 | 199 | 406336 | 1985.83 | 769 | 752 | 204.2 |
| D | 13 | 122 | 161894 | 788.99 | 769 | 752 | 204.2 |
| D | 15 | 0 | 68014 | 329.33 | 769 | 752 | 204.2 |
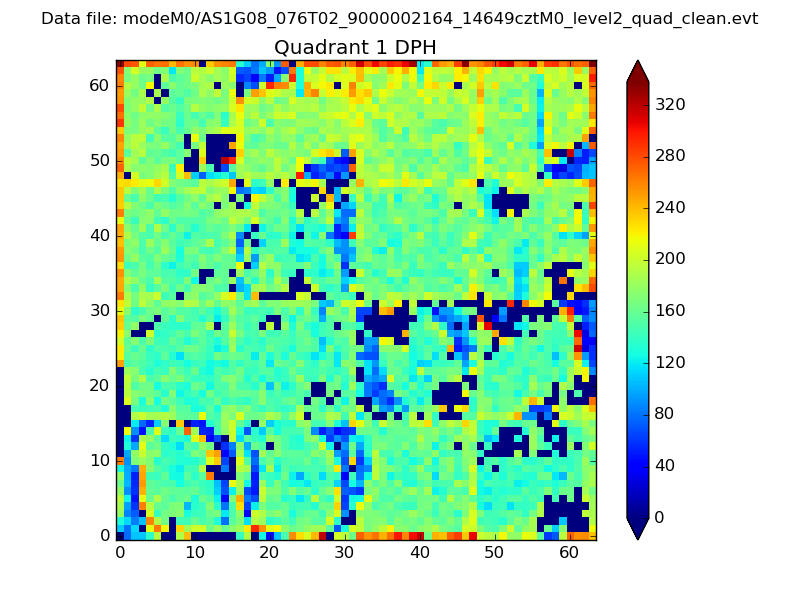
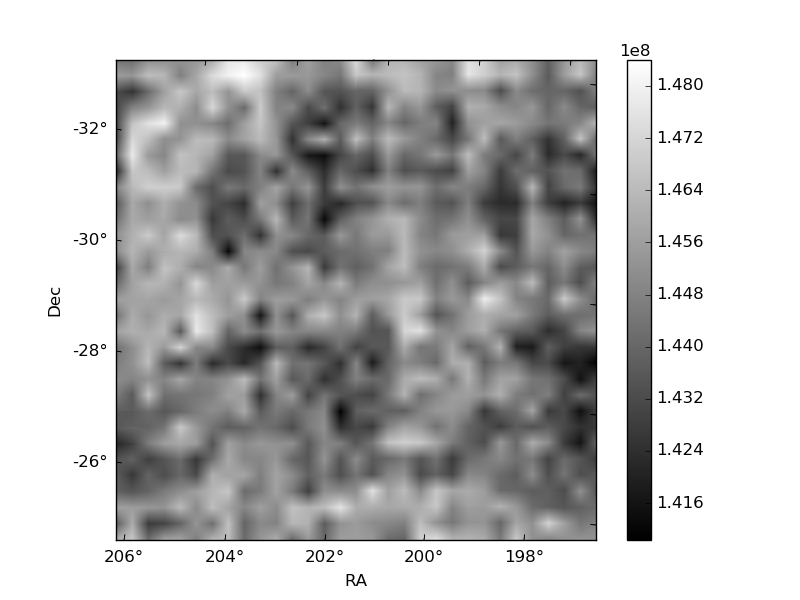
Histogram calculated using DETX and DETY for each event in the final _common_clean file
| Quadrant A |  |
 |
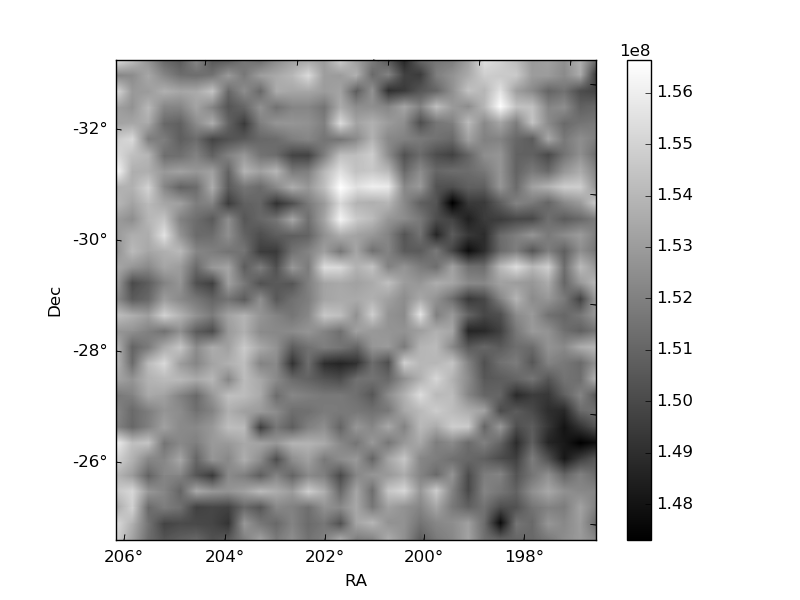
Quadrant B |
|---|---|---|---|
| Quadrant D | 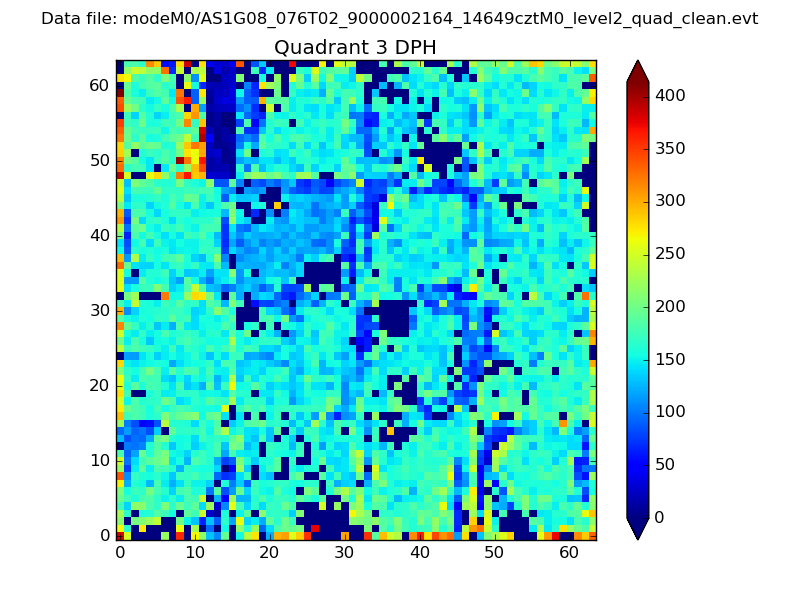 |
 |
Quadrant C |
| Plot type | Count rate plots | Images |
|---|---|---|
| Comparison with Poisson distribution Blue bars denote a histogram of data divided into 1 sec bins. Red curve is a Poisson curve with rate = median count rate of data. |
 |
 |
| Quadrant-wise count rates Data is divided into 100 sec bins |
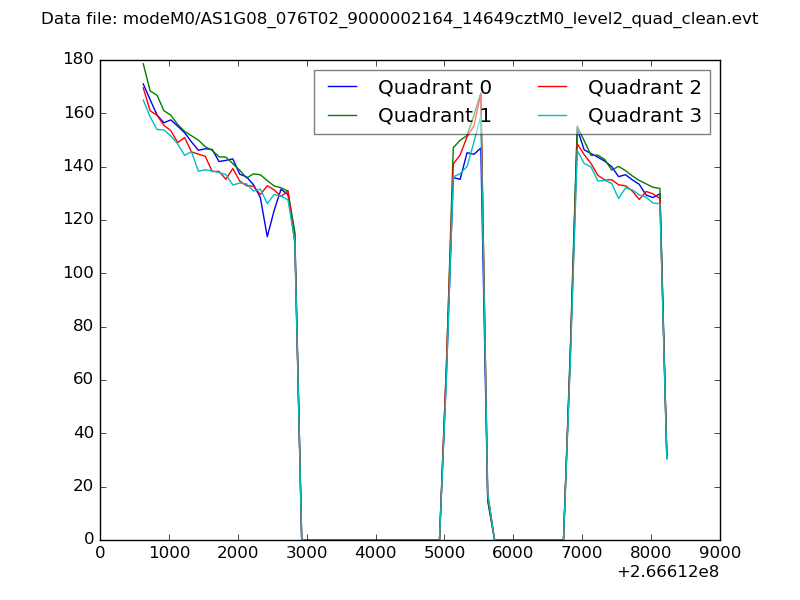 |
|
| Module-wise count rates for Quadrant A Data is divided into 100 sec bins |
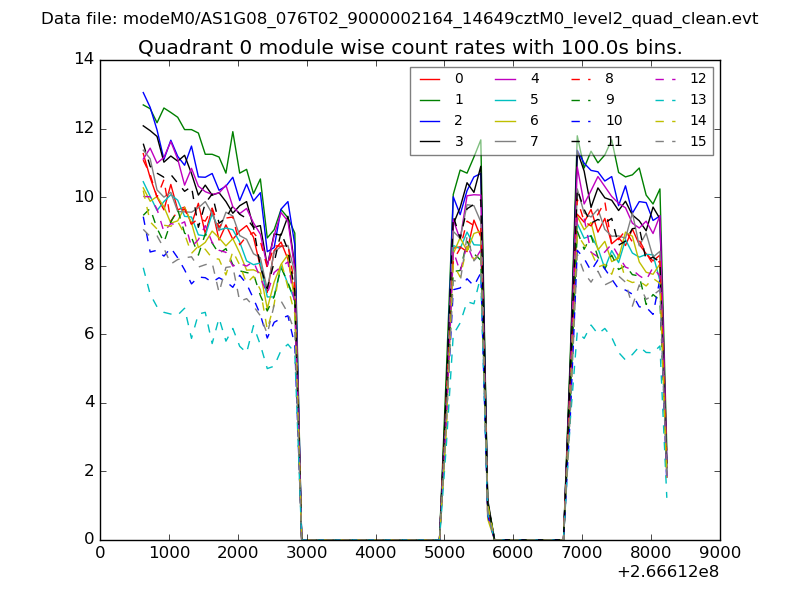 |
 |
| Module-wise count rates for Quadrant B Data is divided into 100 sec bins |
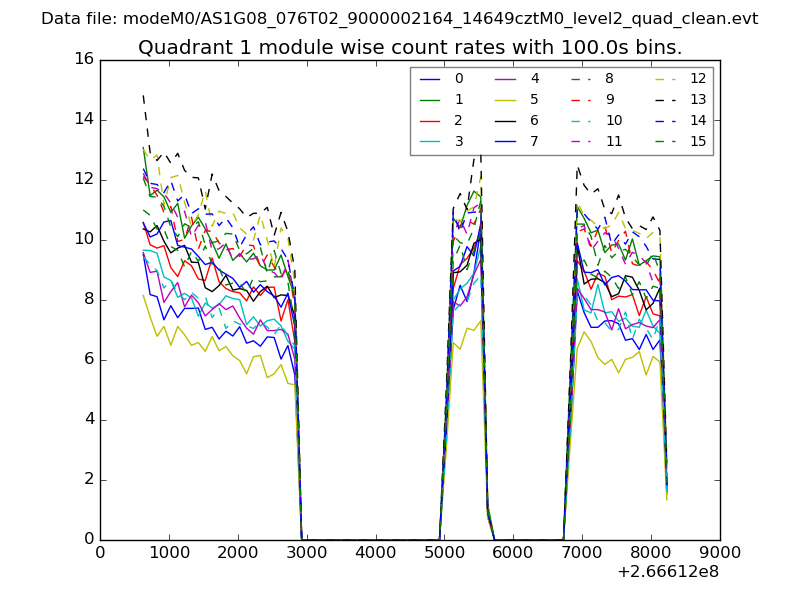 |
 |
| Module-wise count rates for Quadrant C Data is divided into 100 sec bins |
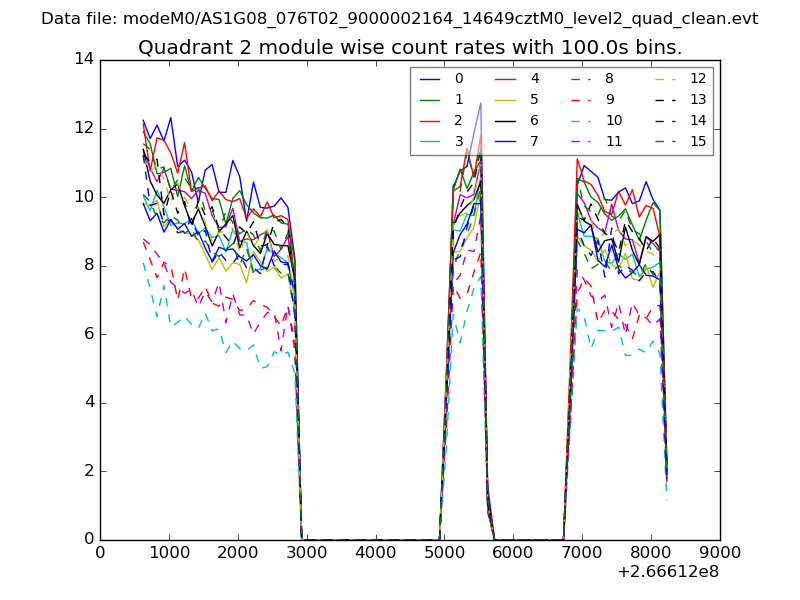 |
 |
| Module-wise count rates for Quadrant D Data is divided into 100 sec bins |
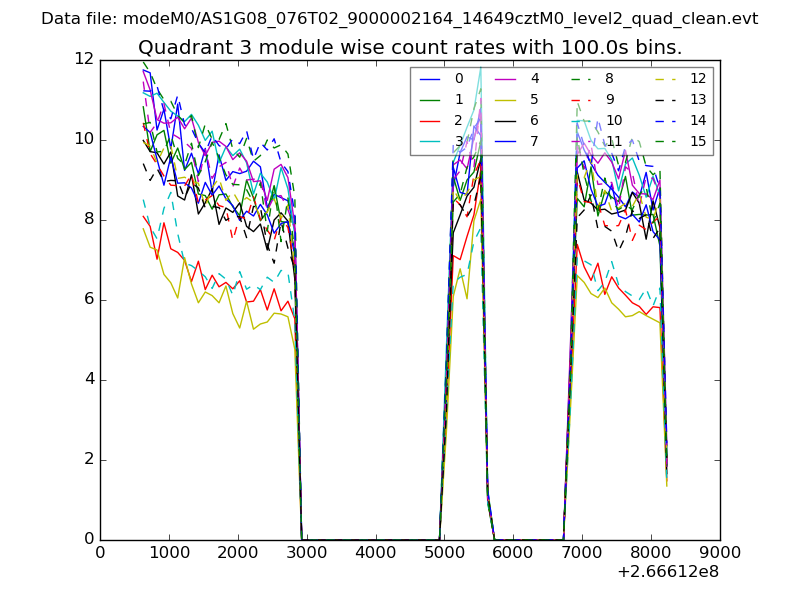 |
 |
| Parameter | Plot |
|---|---|
| CZT HV Monitor | 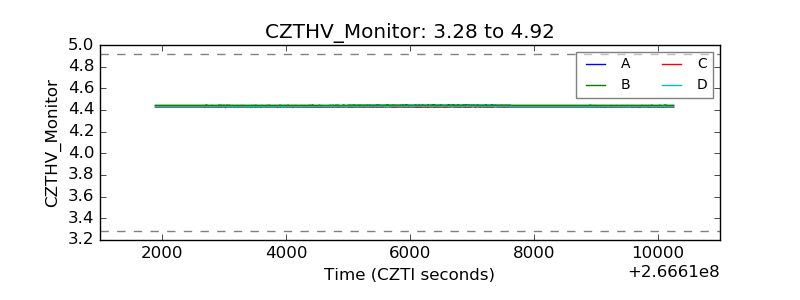 |
| D_VDD | 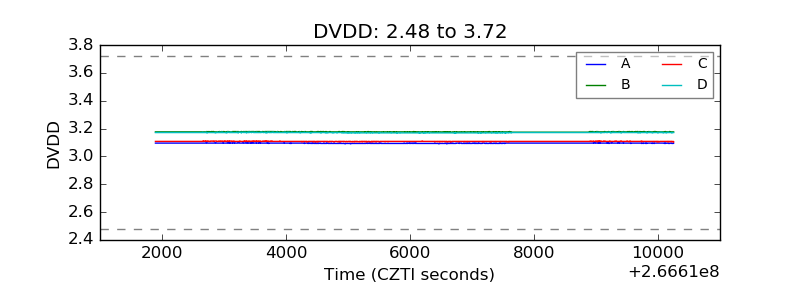 |
| Temperature 1 | 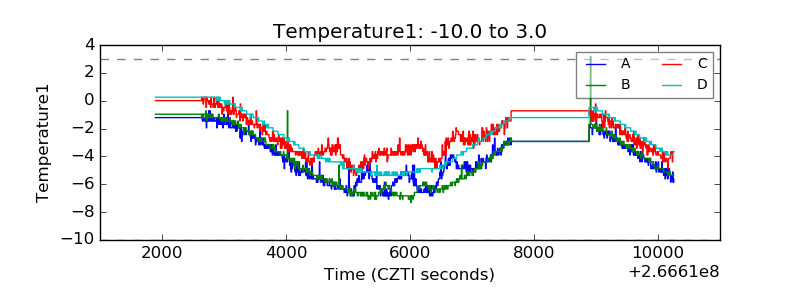 |
| Veto HV Monitor | 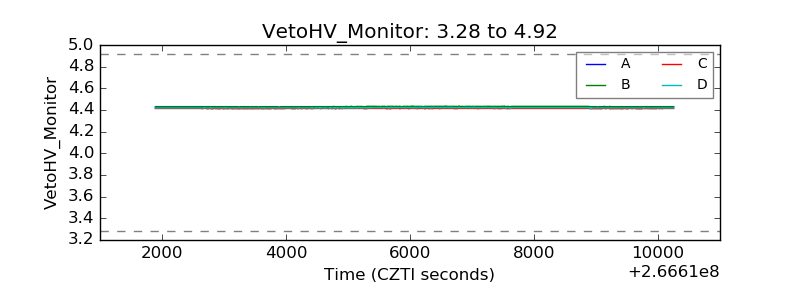 |
| Veto LLD | 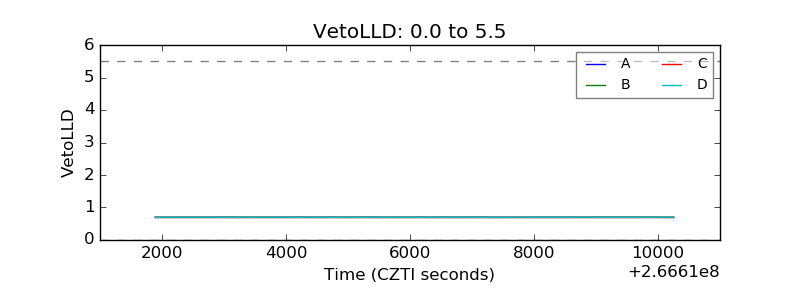 |
| Alpha Counter | 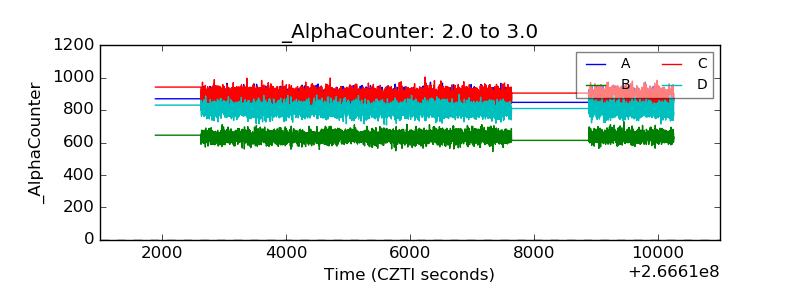 |
| _CPM_Rate | 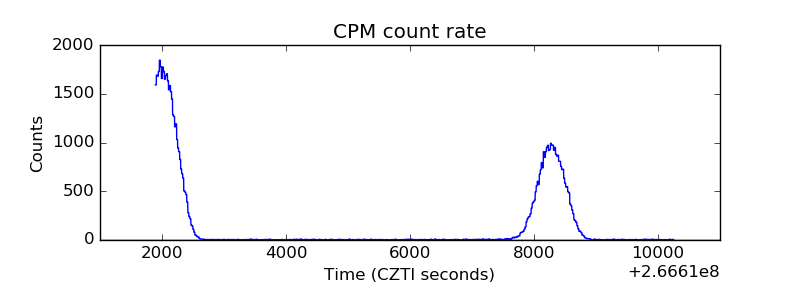 |
| CZT Counter | 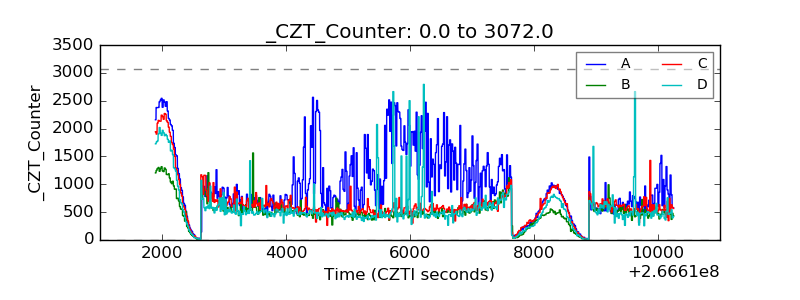 |
| +2.5 Volts monitor |  |
| +5 Volts monitor |  |
| _ROLL_ROT | 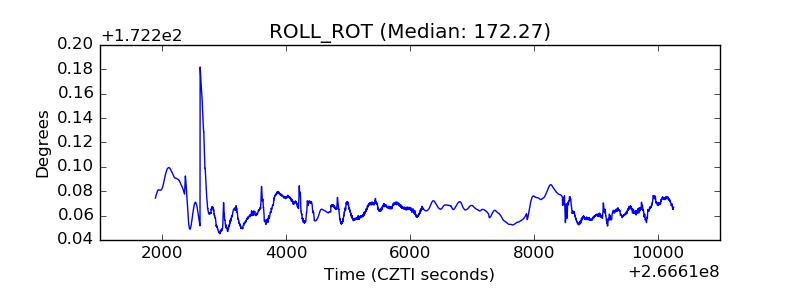 |
| _Roll_DEC | 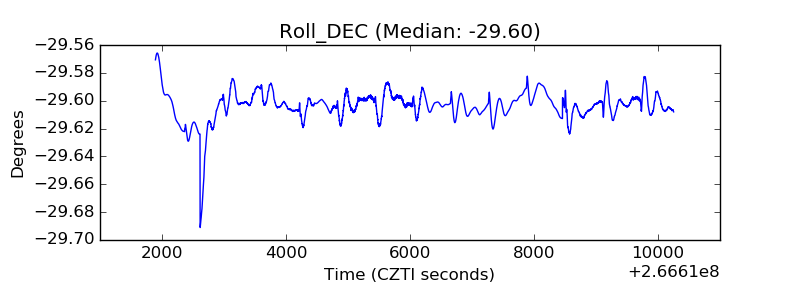 |
| _Roll_RA | 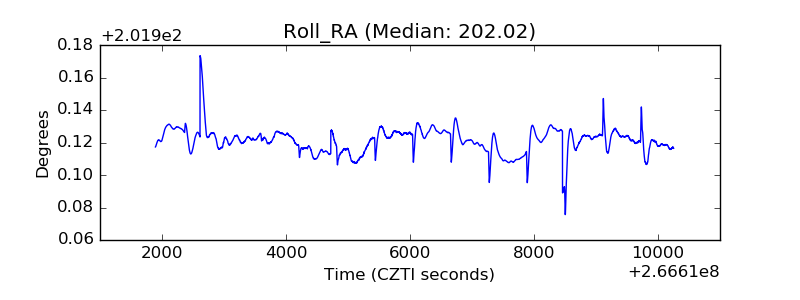 |
| Veto Counter | 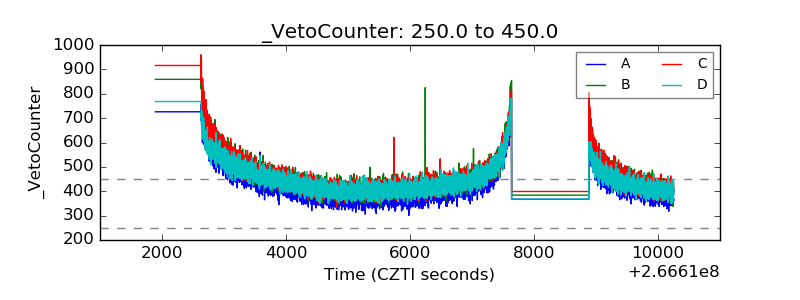 |