| Param | Original file | Final file |
|---|---|---|
| Filename | modeM0/AS1G08_076T02_9000002164_14650cztM0_level2.evt | modeM0/AS1G08_076T02_9000002164_14650cztM0_level2_quad_clean.evt |
| Size (bytes) | 571,737,600 | 92,687,040 |
| Size | 545.3 MB | 88.4 MB |
| Events in quadrant A | 6,466,330 | 583,348 |
| Events in quadrant B | 3,425,543 | 603,219 |
| Events in quadrant C | 3,679,406 | 586,468 |
| Events in quadrant D | 3,299,334 | 575,660 |
| Mode M9 | |||
|---|---|---|---|
| Quadrant | BADHDUFLAG | Total packets | Discarded packets |
| A | 0 | 18 | 0 |
| B | 0 | 18 | 0 |
| C | 0 | 18 | 0 |
| D | 0 | 19 | 0 |
| Mode SS | |||
|---|---|---|---|
| Quadrant | BADHDUFLAG | Total packets | Discarded packets |
| A | 0 | 134 | 0 |
| B | 0 | 134 | 0 |
| C | 0 | 134 | 0 |
| D | 0 | 134 | 0 |
| Mode M0 | |||
|---|---|---|---|
| Quadrant | BADHDUFLAG | Total packets | Discarded packets |
| A | 0 | 23811 | 3 |
| B | 0 | 14398 | 2 |
| C | 0 | 14943 | 2 |
| D | 0 | 14195 | 2 |
| Quadrant | Total seconds | Saturated seconds | Saturation percentage |
|---|---|---|---|
| A | 6568 | 261 | 3.973812% |
| B | 6568 | 50 | 0.761267% |
| C | 6568 | 23 | 0.350183% |
| D | 6568 | 31 | 0.471985% |
Noise dominated data is calculated using 1-second bins in cleaned event files. If a bin has >2000 counts, and if more than 50% of those come from <1% of pixels, then it is considered to be noise-dominated and hence unusable.
| Quadrant | # 1 sec bins | Bins with >0 counts | Bins with >2000 counts | High rate bins dominated by noise | Noise dominated (total time) | Noise dominated (detector-on time) | Marked lightcurve |
|---|---|---|---|---|---|---|---|
| A | 7554 | 6570 | 153 | 153 | 2.03% | 2.33% | 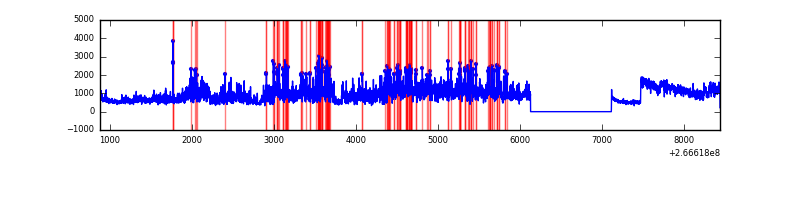 |
| B | 7554 | 6570 | 7 | 7 | 0.09% | 0.11% | 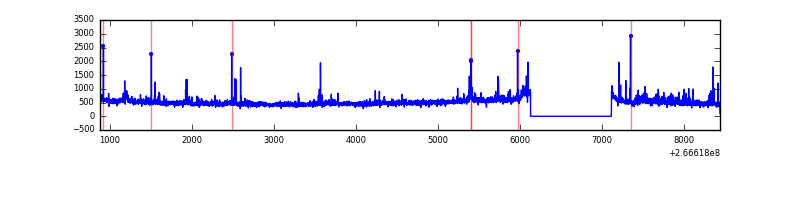 |
| C | 7554 | 6570 | 1 | 1 | 0.01% | 0.02% | 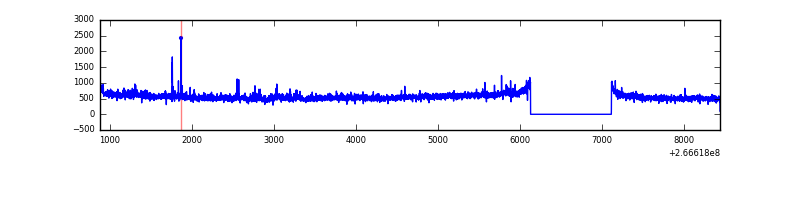 |
| D | 7554 | 6570 | 20 | 20 | 0.26% | 0.30% | 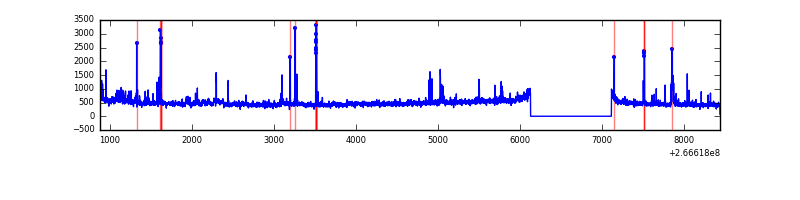 |
Top three noisy pixels from each quadrant. If the there are fewer than three noisy pixels in the level2.evt file, extra rows are filled as -1
| Pixel properties | Quadrant properties | ||||||
|---|---|---|---|---|---|---|---|
| Quadrant | DetID | PixID | Counts | Sigma | Mean | Median | Sigma |
| A | 0 | 253 | 2637280 | 16058.02 | 796 | 779 | 164.2 |
| A | 0 | 23 | 692582 | 4213.53 | 796 | 779 | 164.2 |
| A | 0 | 226 | 51747 | 310.43 | 796 | 779 | 164.2 |
| B | 0 | 189 | 68128 | 440.45 | 805 | 785 | 152.9 |
| B | 0 | 219 | 48734 | 313.6 | 805 | 785 | 152.9 |
| B | 0 | 230 | 26365 | 167.3 | 805 | 785 | 152.9 |
| C | 3 | 233 | 640855 | 3558.71 | 774 | 778 | 179.9 |
| C | 0 | 207 | 18906 | 100.79 | 774 | 778 | 179.9 |
| C | 13 | 61 | 5497 | 26.24 | 774 | 778 | 179.9 |
| D | 13 | 122 | 99047 | 484.49 | 768 | 750 | 202.9 |
| D | 15 | 0 | 61593 | 299.88 | 768 | 750 | 202.9 |
| D | 10 | 199 | 61041 | 297.16 | 768 | 750 | 202.9 |
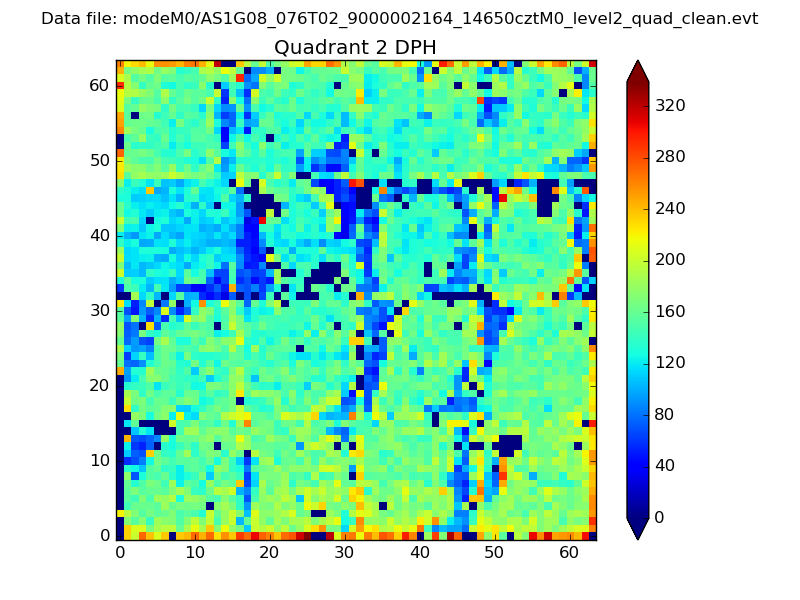
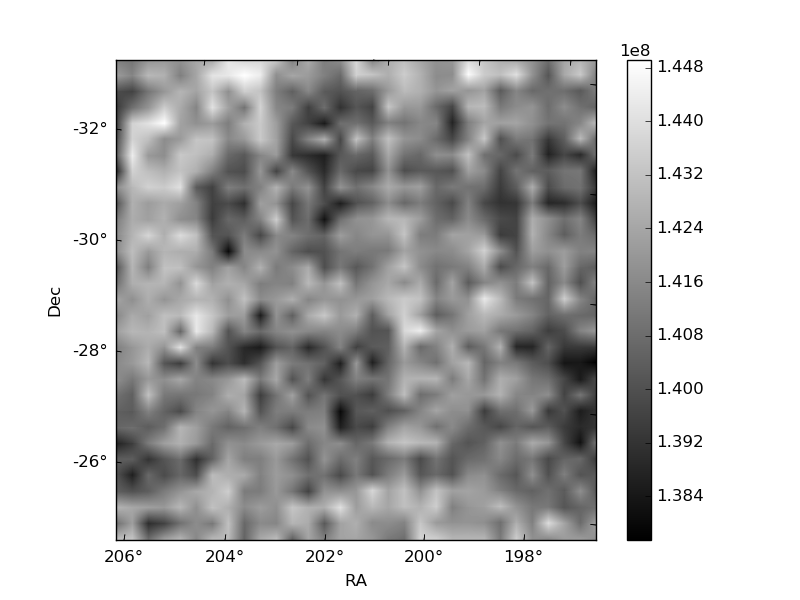
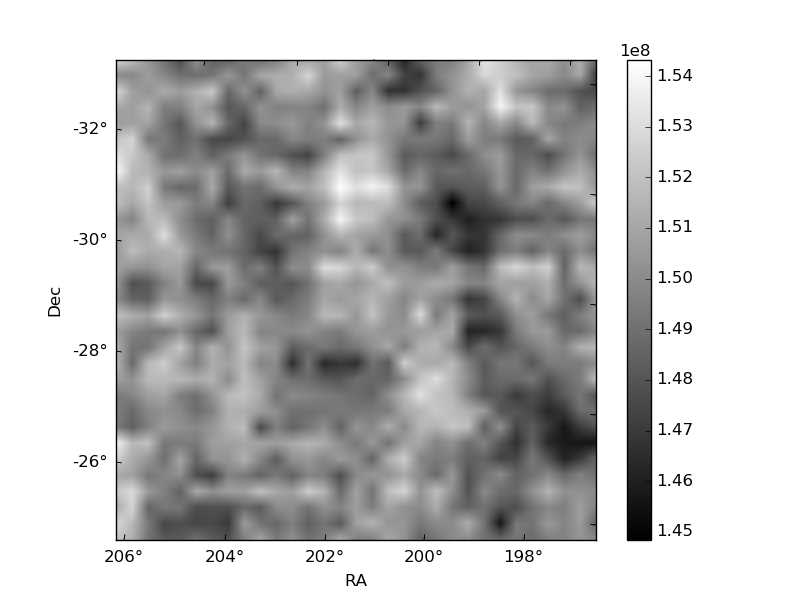
Histogram calculated using DETX and DETY for each event in the final _common_clean file
| Quadrant A |  |
 |
Quadrant B |
|---|---|---|---|
| Quadrant D | 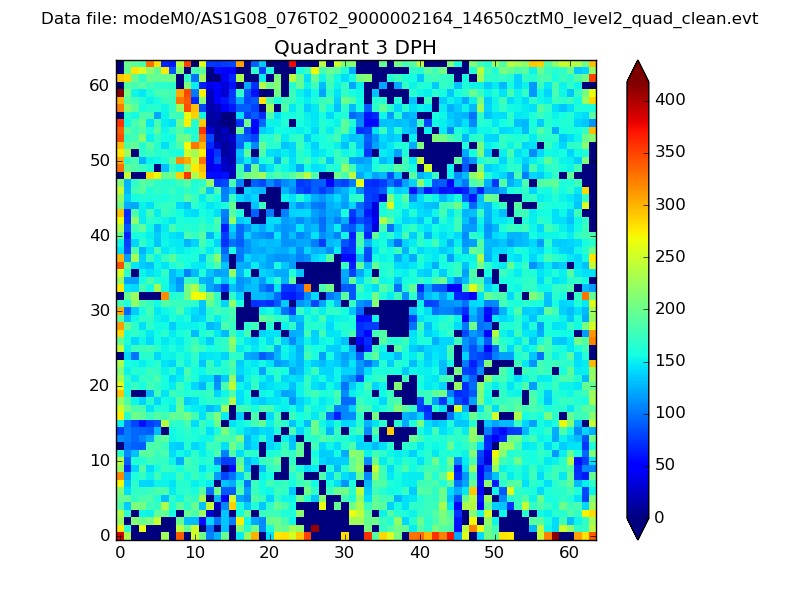 |
 |
Quadrant C |
| Plot type | Count rate plots | Images |
|---|---|---|
| Comparison with Poisson distribution Blue bars denote a histogram of data divided into 1 sec bins. Red curve is a Poisson curve with rate = median count rate of data. |
 |
 |
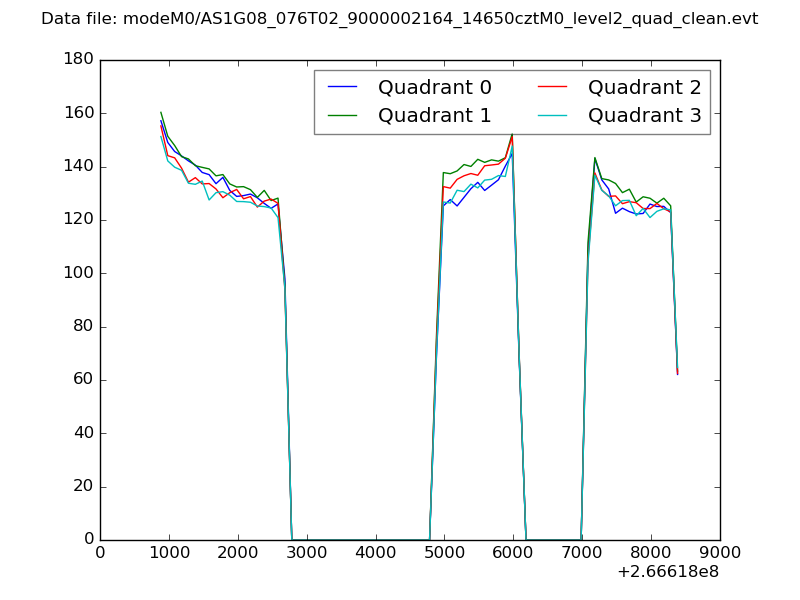
| Quadrant-wise count rates Data is divided into 100 sec bins |
 |
|
| Module-wise count rates for Quadrant A Data is divided into 100 sec bins |
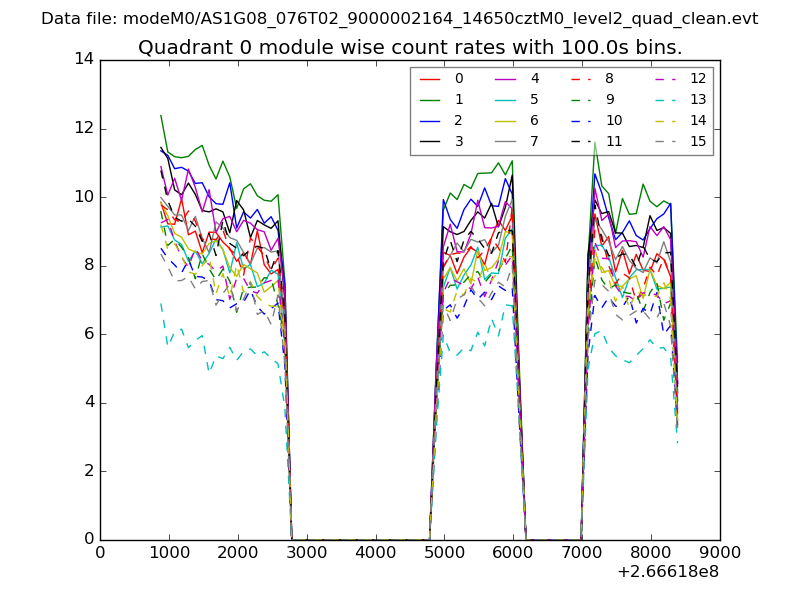 |
 |
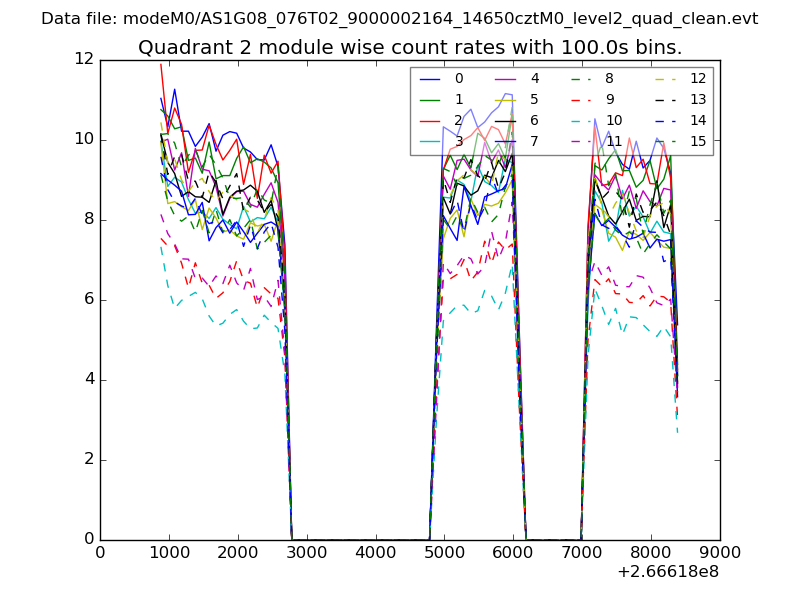
| Module-wise count rates for Quadrant B Data is divided into 100 sec bins |
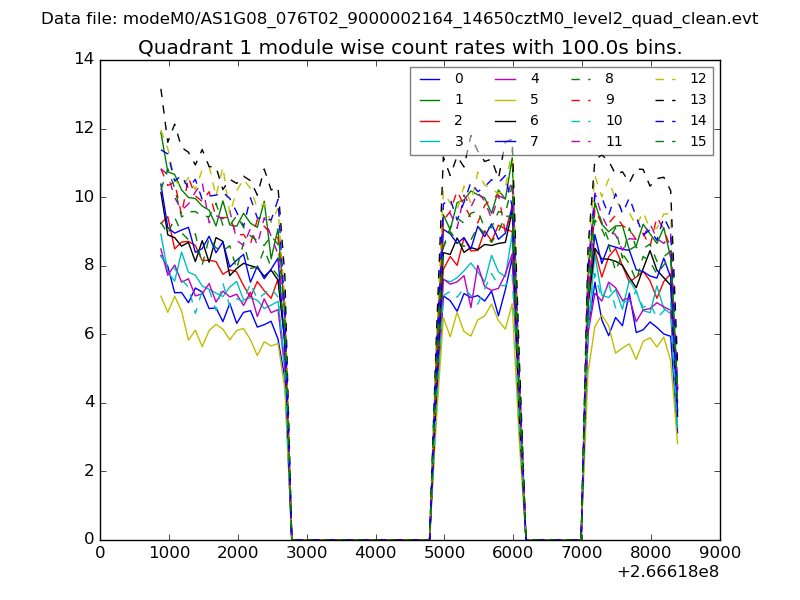 |
 |
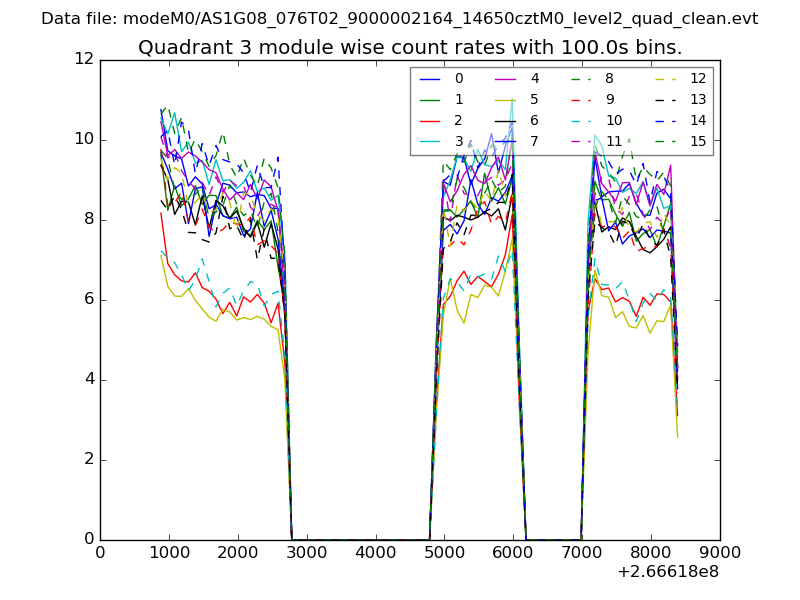
| Module-wise count rates for Quadrant C Data is divided into 100 sec bins |
 |
 |
| Module-wise count rates for Quadrant D Data is divided into 100 sec bins |
 |
 |
| Parameter | Plot |
|---|---|
| CZT HV Monitor | 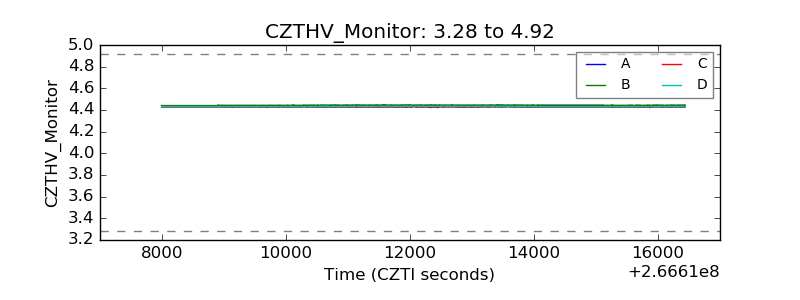 |
| D_VDD | 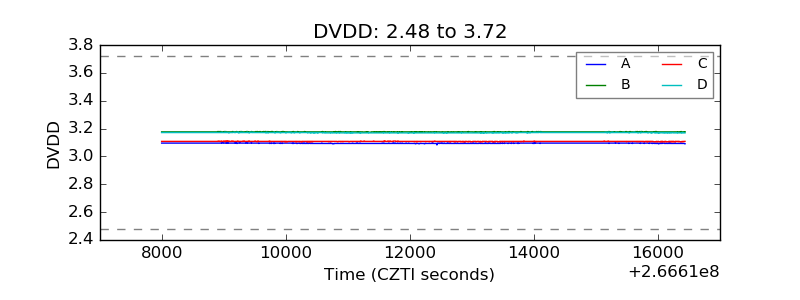 |
| Temperature 1 | 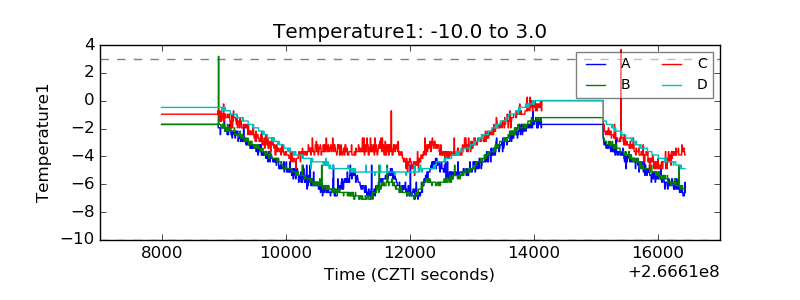 |
| Veto HV Monitor | 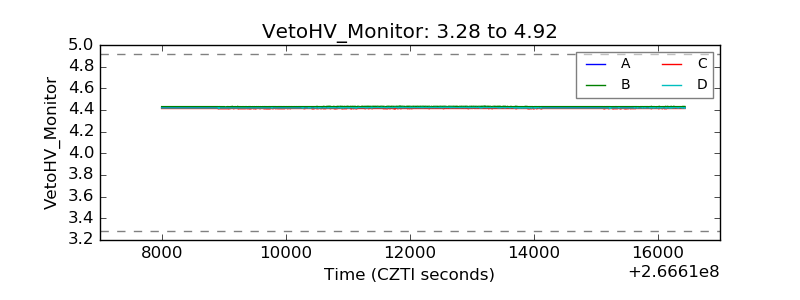 |
| Veto LLD | 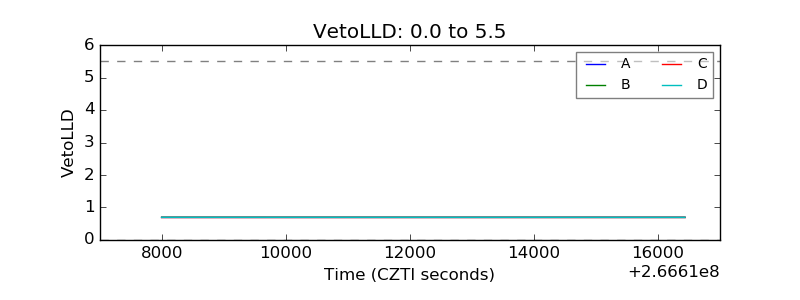 |
| Alpha Counter | 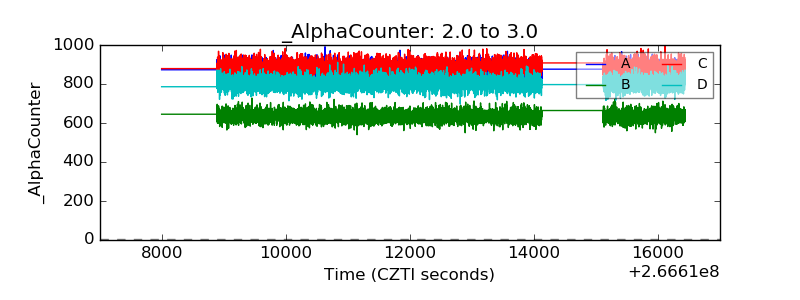 |
| _CPM_Rate | 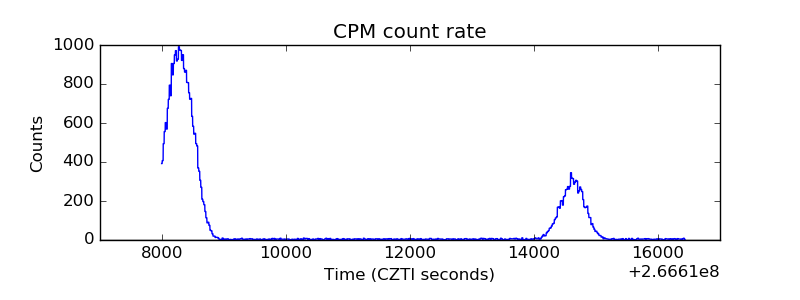 |
| CZT Counter | 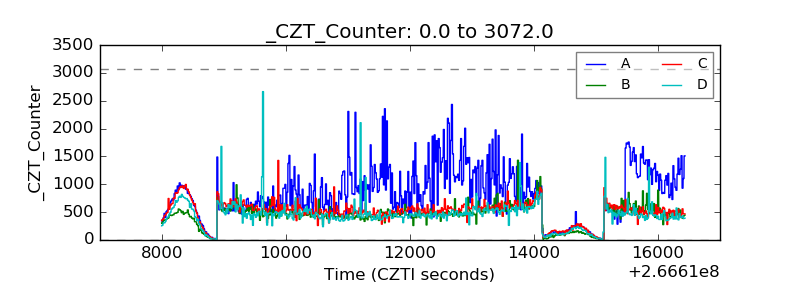 |
| +2.5 Volts monitor |  |
| +5 Volts monitor |  |
| _ROLL_ROT | 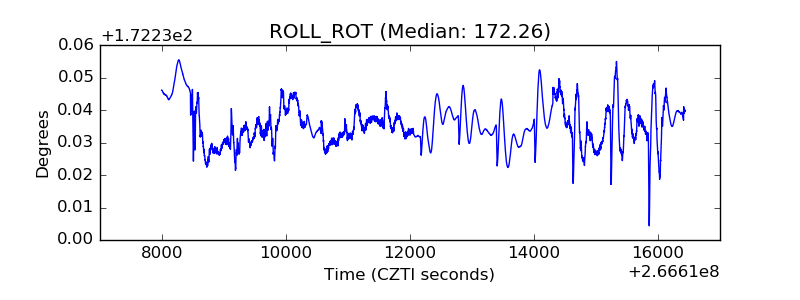 |
| _Roll_DEC | 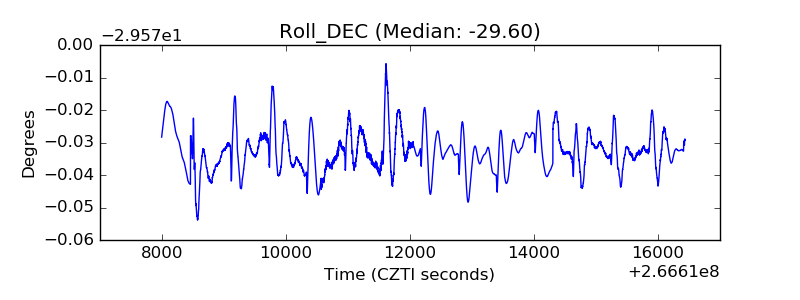 |
| _Roll_RA | 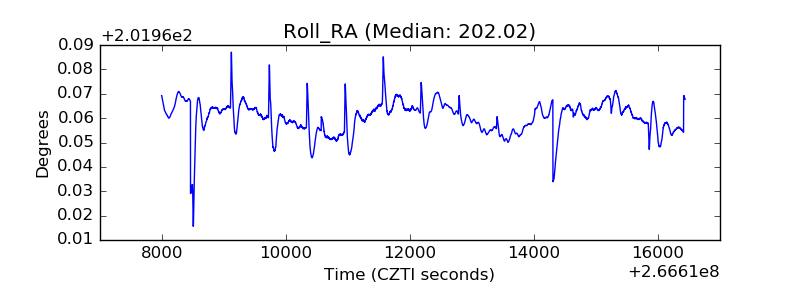 |
| Veto Counter | 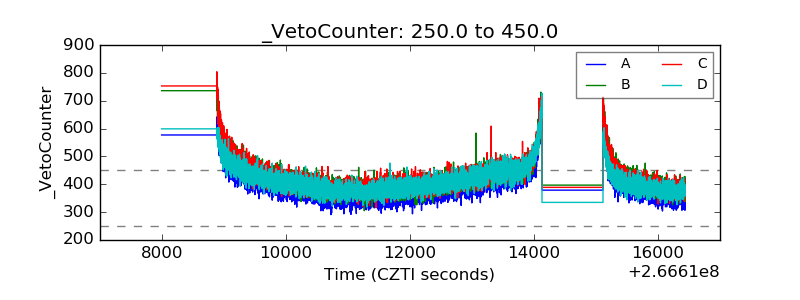 |