| Param | Original file | Final file |
|---|---|---|
| Filename | modeM0/AS1G08_076T02_9000002164_14651cztM0_level2.evt | modeM0/AS1G08_076T02_9000002164_14651cztM0_level2_quad_clean.evt |
| Size (bytes) | 675,973,440 | 92,833,920 |
| Size | 644.7 MB | 88.5 MB |
| Events in quadrant A | 8,866,099 | 564,831 |
| Events in quadrant B | 3,484,993 | 602,712 |
| Events in quadrant C | 3,903,301 | 584,058 |
| Events in quadrant D | 3,745,852 | 572,667 |
| Mode M9 | |||
|---|---|---|---|
| Quadrant | BADHDUFLAG | Total packets | Discarded packets |
| A | 0 | 16 | 0 |
| B | 0 | 16 | 0 |
| C | 0 | 16 | 0 |
| D | 0 | 16 | 0 |
| Mode SS | |||
|---|---|---|---|
| Quadrant | BADHDUFLAG | Total packets | Discarded packets |
| A | 0 | 144 | 0 |
| B | 0 | 144 | 0 |
| C | 0 | 144 | 0 |
| D | 0 | 144 | 0 |
| Mode M0 | |||
|---|---|---|---|
| Quadrant | BADHDUFLAG | Total packets | Discarded packets |
| A | 0 | 31209 | 3 |
| B | 0 | 14832 | 2 |
| C | 0 | 15992 | 2 |
| D | 0 | 16030 | 2 |
| Quadrant | Total seconds | Saturated seconds | Saturation percentage |
|---|---|---|---|
| A | 6988 | 552 | 7.899256% |
| B | 6988 | 35 | 0.500859% |
| C | 6988 | 22 | 0.314825% |
| D | 6988 | 93 | 1.330853% |
Noise dominated data is calculated using 1-second bins in cleaned event files. If a bin has >2000 counts, and if more than 50% of those come from <1% of pixels, then it is considered to be noise-dominated and hence unusable.
| Quadrant | # 1 sec bins | Bins with >0 counts | Bins with >2000 counts | High rate bins dominated by noise | Noise dominated (total time) | Noise dominated (detector-on time) | Marked lightcurve |
|---|---|---|---|---|---|---|---|
| A | 8619 | 6991 | 132 | 132 | 1.53% | 1.89% | 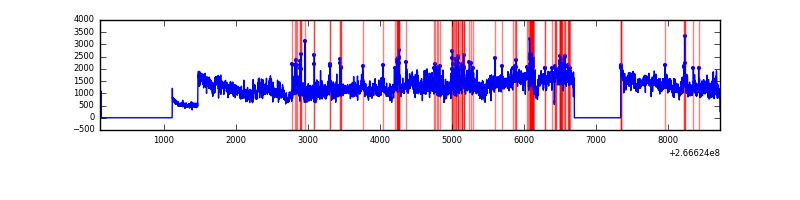 |
| B | 8619 | 6991 | 3 | 3 | 0.03% | 0.04% | 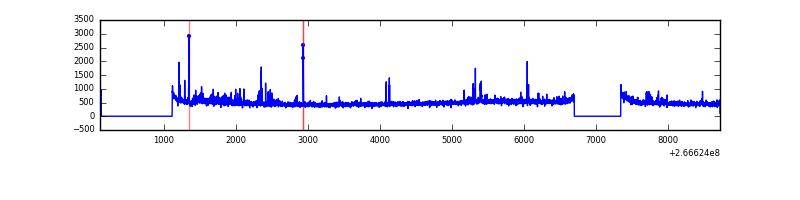 |
| C | 8619 | 6991 | 0 | 0 | 0.00% | 0.00% | 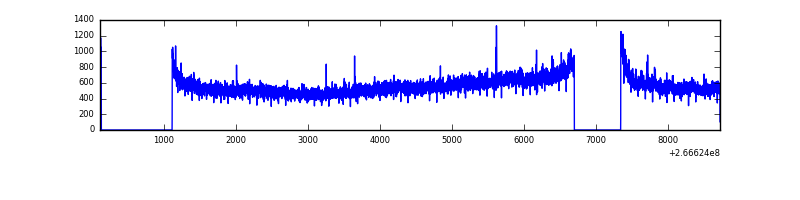 |
| D | 8619 | 6990 | 37 | 37 | 0.43% | 0.53% | 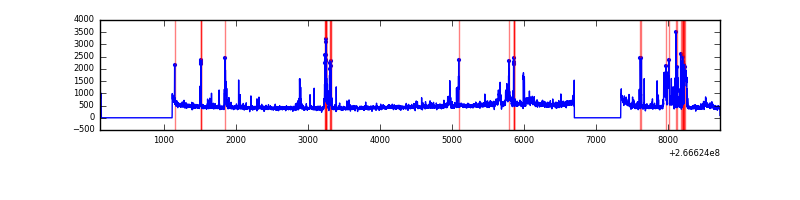 |
Top three noisy pixels from each quadrant. If the there are fewer than three noisy pixels in the level2.evt file, extra rows are filled as -1
| Pixel properties | Quadrant properties | ||||||
|---|---|---|---|---|---|---|---|
| Quadrant | DetID | PixID | Counts | Sigma | Mean | Median | Sigma |
| A | 0 | 23 | 4039032 | 23933.55 | 823 | 805 | 168.7 |
| A | 0 | 253 | 1200213 | 7108.59 | 823 | 805 | 168.7 |
| A | 0 | 226 | 260445 | 1538.82 | 823 | 805 | 168.7 |
| B | 0 | 189 | 49770 | 306.12 | 837 | 816 | 159.9 |
| B | 4 | 142 | 23021 | 138.85 | 837 | 816 | 159.9 |
| B | 0 | 219 | 22842 | 137.73 | 837 | 816 | 159.9 |
| C | 3 | 233 | 746037 | 3988.55 | 805 | 810 | 186.8 |
| C | 13 | 61 | 5785 | 26.63 | 805 | 810 | 186.8 |
| C | 3 | 234 | 5122 | 23.08 | 805 | 810 | 186.8 |
| D | 15 | 0 | 250507 | 1190.1 | 803 | 784 | 209.8 |
| D | 12 | 110 | 128669 | 609.46 | 803 | 784 | 209.8 |
| D | 10 | 199 | 108019 | 511.05 | 803 | 784 | 209.8 |
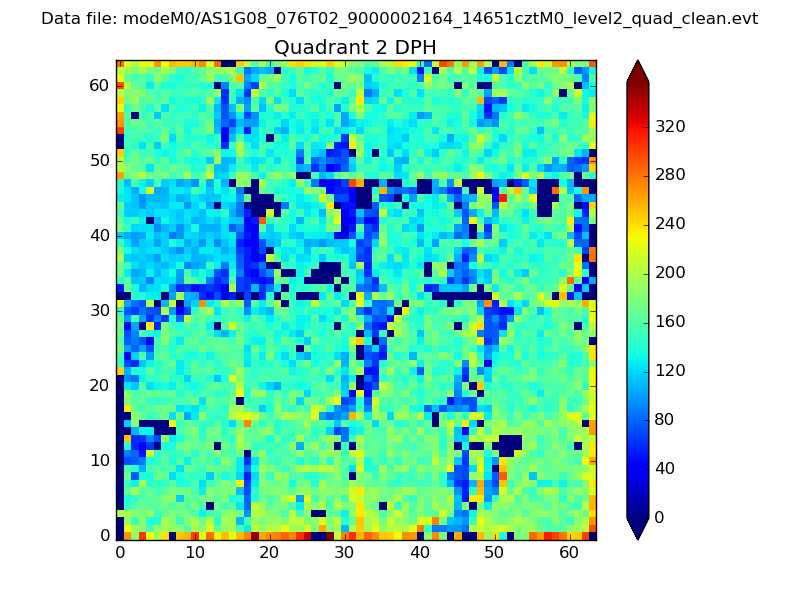
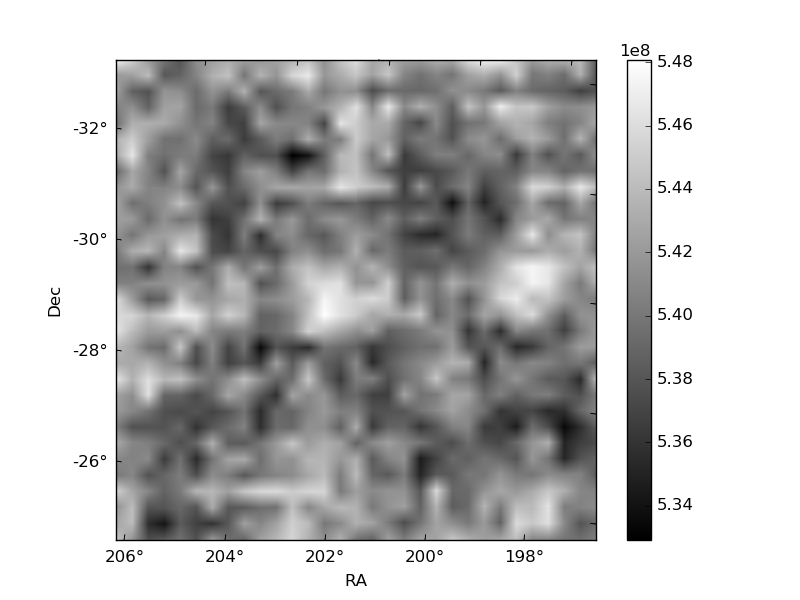
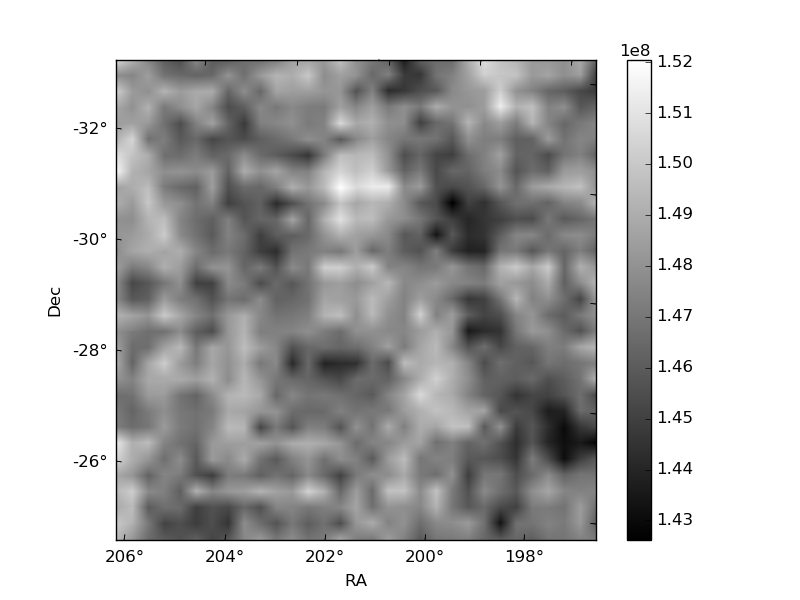
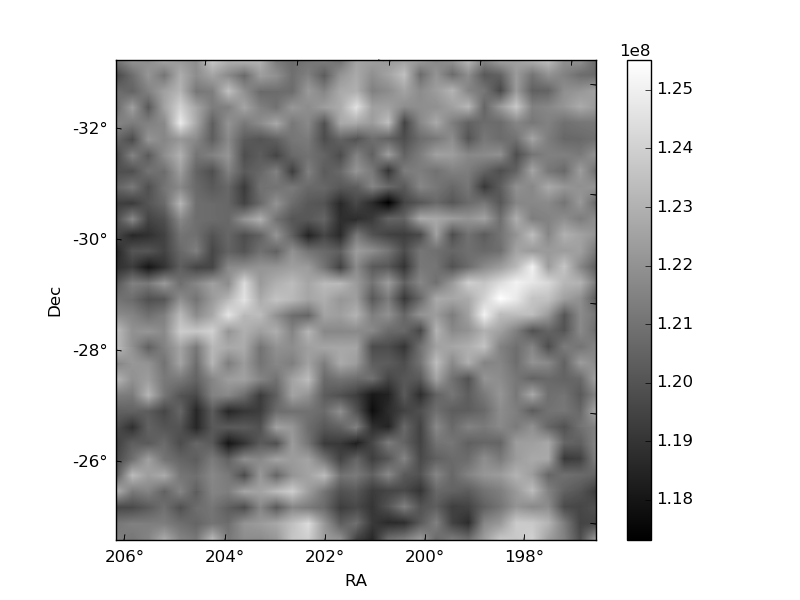
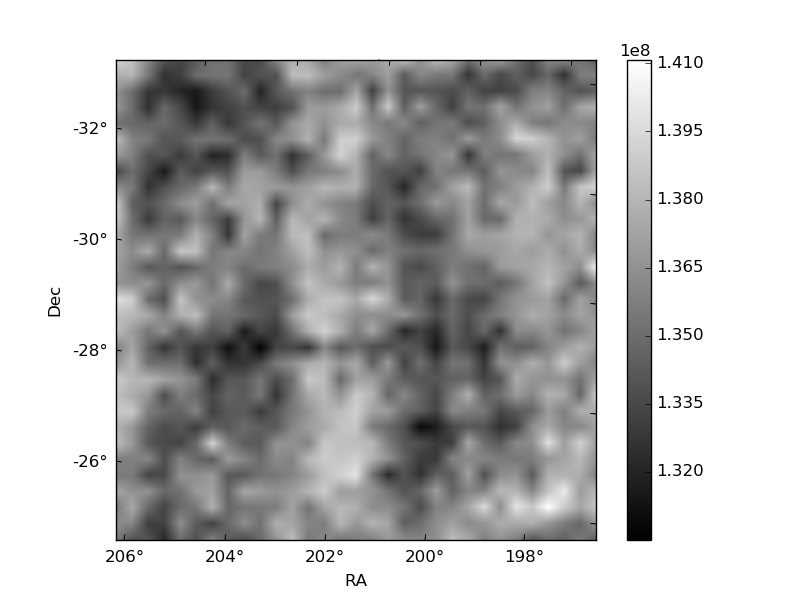
Histogram calculated using DETX and DETY for each event in the final _common_clean file
| Quadrant A | 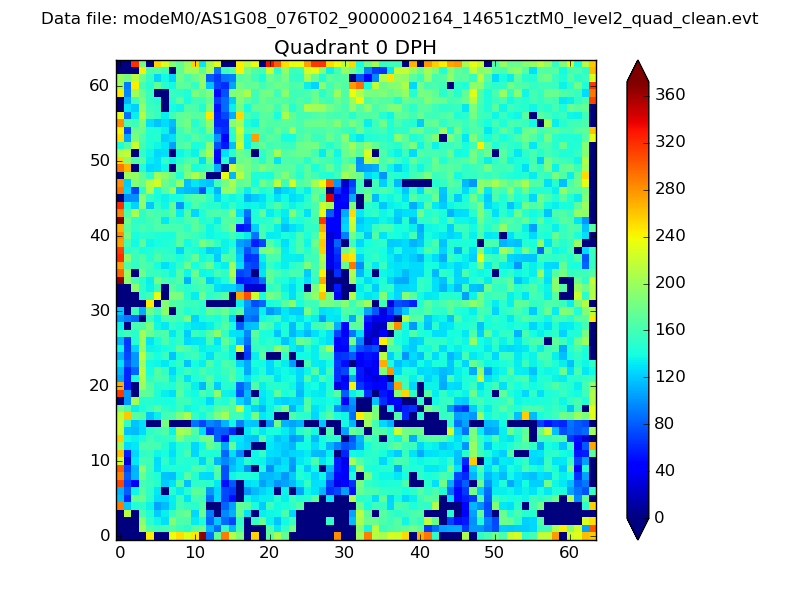 |
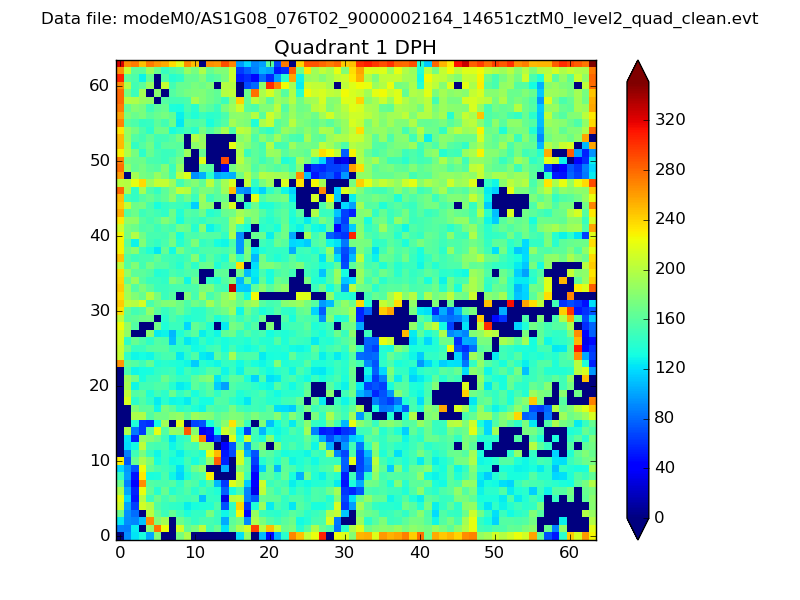 |
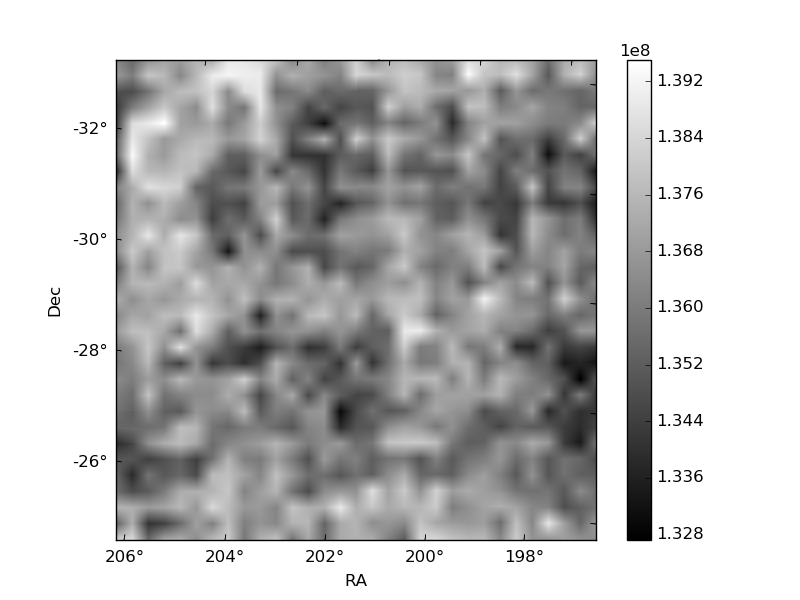
Quadrant B |
|---|---|---|---|
| Quadrant D | 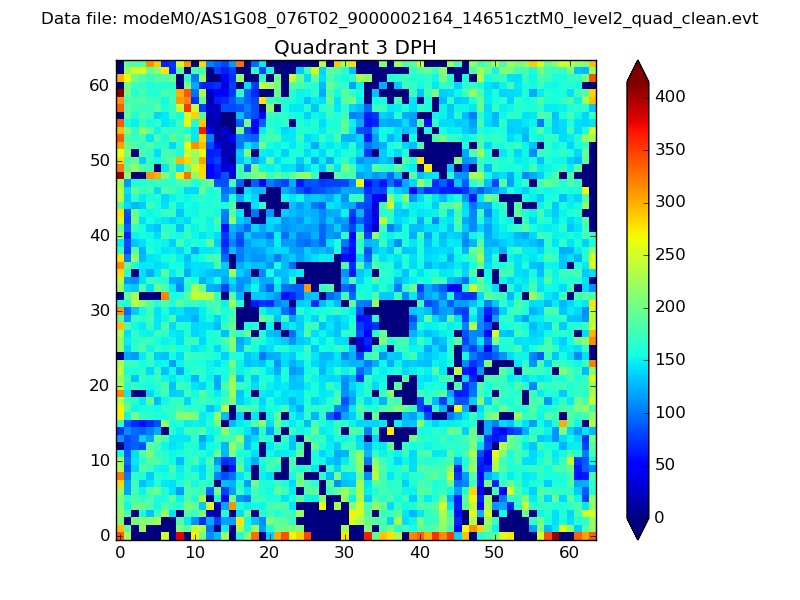 |
 |
Quadrant C |
| Plot type | Count rate plots | Images |
|---|---|---|
| Comparison with Poisson distribution Blue bars denote a histogram of data divided into 1 sec bins. Red curve is a Poisson curve with rate = median count rate of data. |
 |
 |
| Quadrant-wise count rates Data is divided into 100 sec bins |
 |
|
| Module-wise count rates for Quadrant A Data is divided into 100 sec bins |
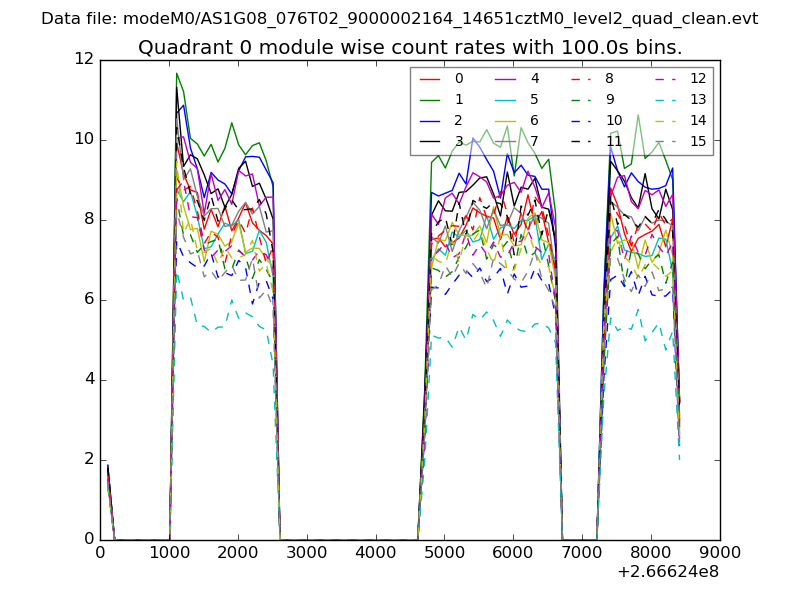 |
 |
| Module-wise count rates for Quadrant B Data is divided into 100 sec bins |
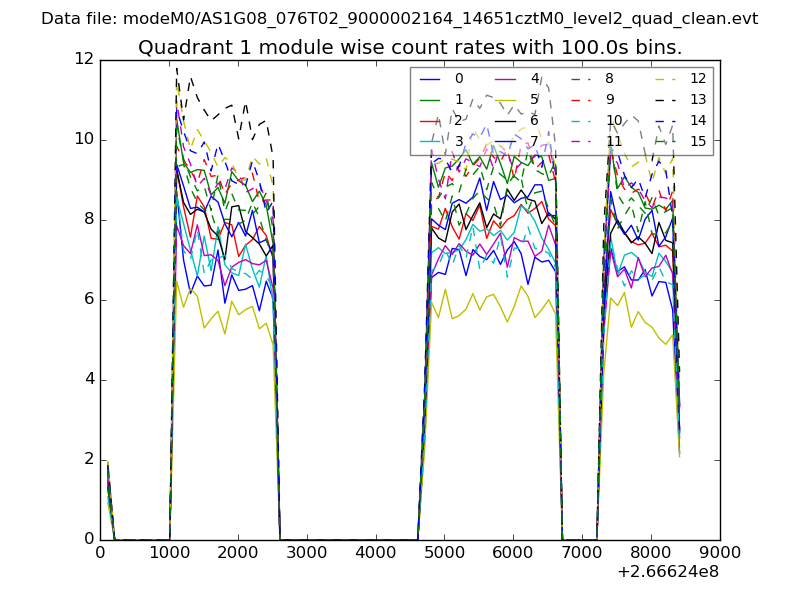 |
 |
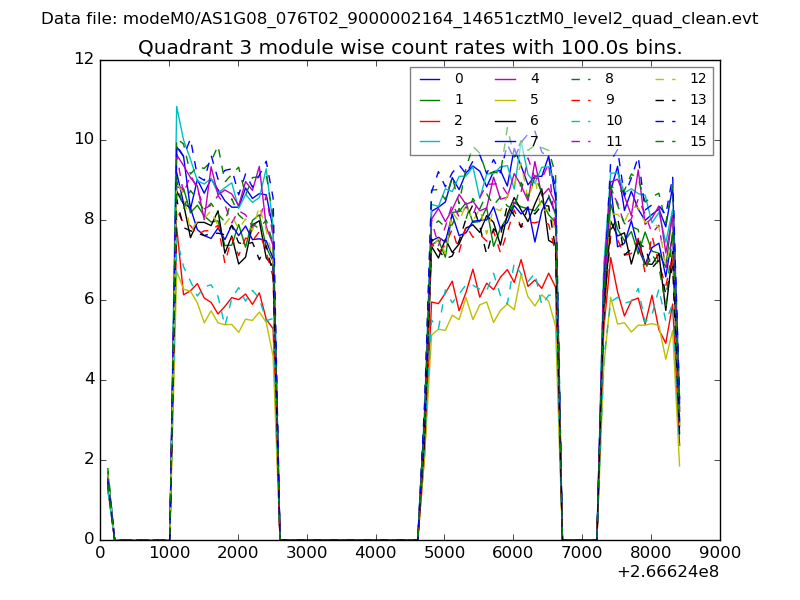
| Module-wise count rates for Quadrant C Data is divided into 100 sec bins |
 |
 |
| Module-wise count rates for Quadrant D Data is divided into 100 sec bins |
 |
 |
| Parameter | Plot |
|---|---|
| CZT HV Monitor |  |
| D_VDD | 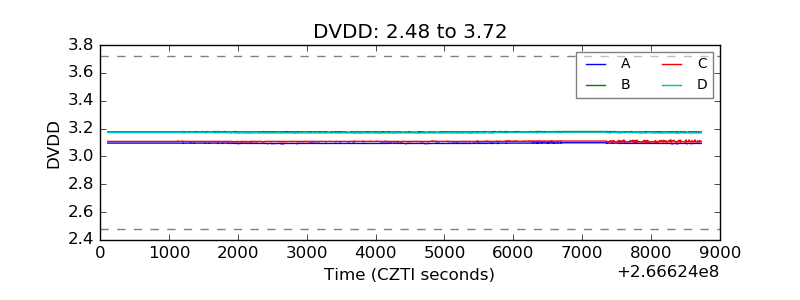 |
| Temperature 1 | 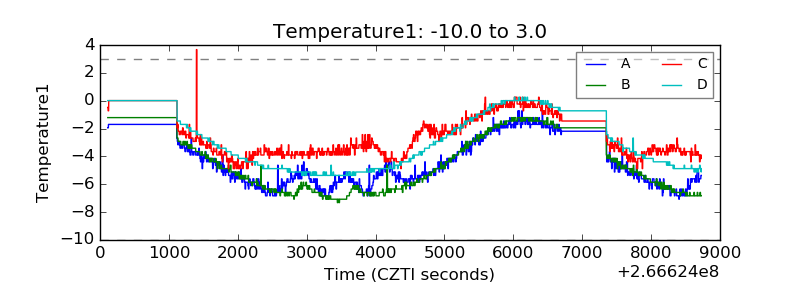 |
| Veto HV Monitor | 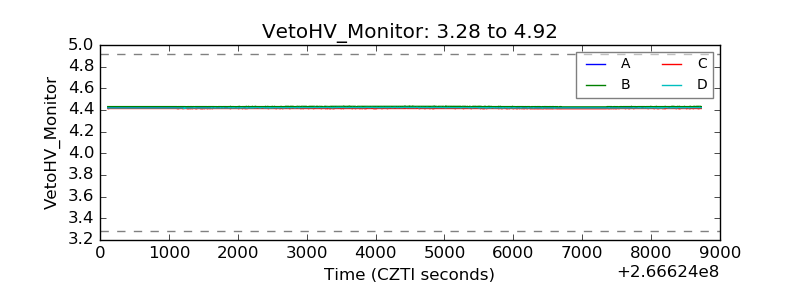 |
| Veto LLD | 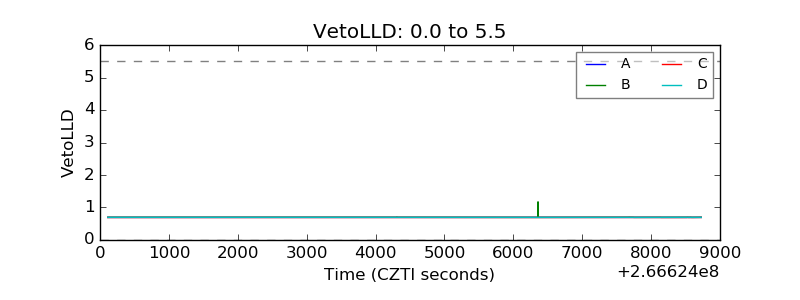 |
| Alpha Counter |  |
| _CPM_Rate | 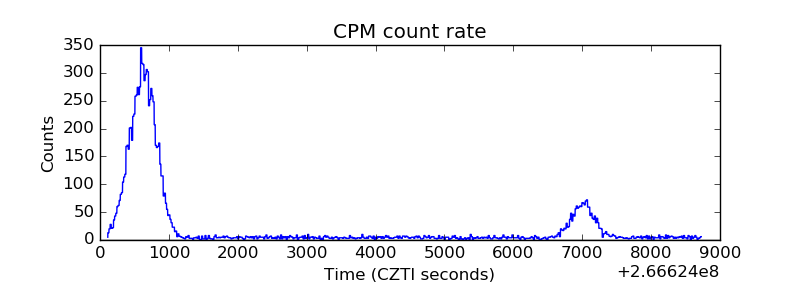 |
| CZT Counter | 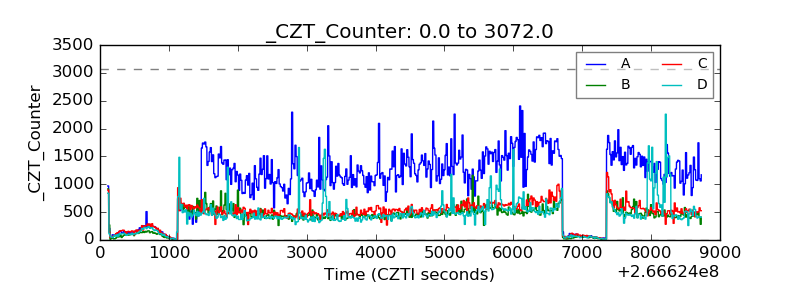 |
| +2.5 Volts monitor |  |
| +5 Volts monitor |  |
| _ROLL_ROT | 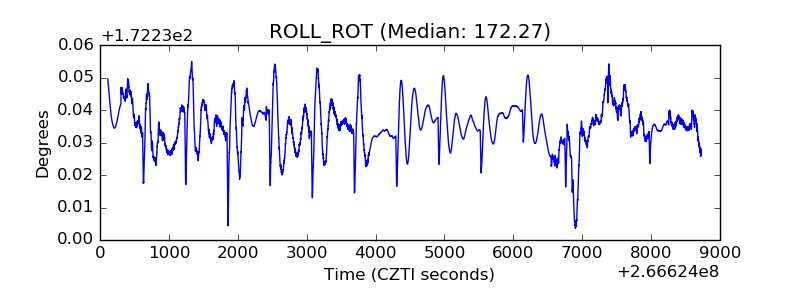 |
| _Roll_DEC | 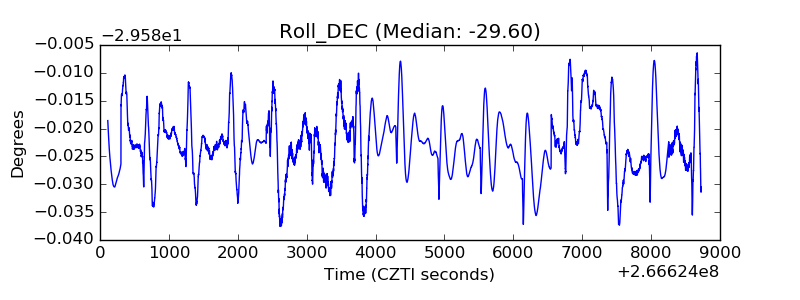 |
| _Roll_RA | 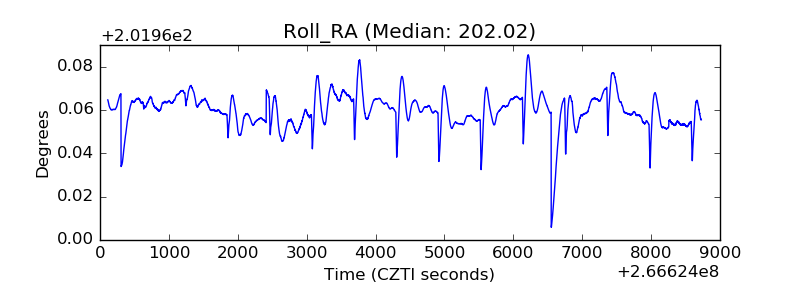 |
| Veto Counter | 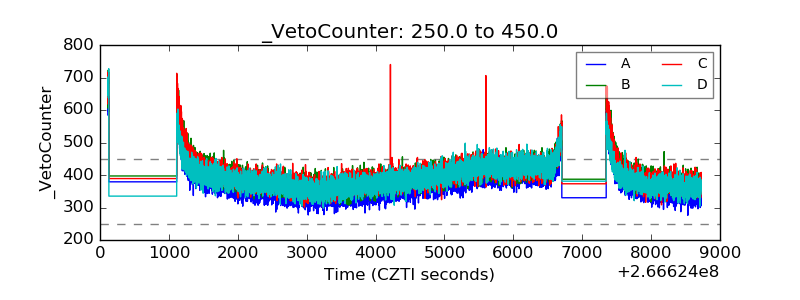 |