| Param | Original file | Final file |
|---|---|---|
| Filename | modeM0/AS1G08_019T01_9000002166cztM0_level2.fits | modeM0/AS1G08_019T01_9000002166cztM0_level2_quad_clean.evt |
| Size (bytes) | 237,833,280 | 221,607,360 |
| Size | 226.8 MB | 211.3 MB |
| Events in quadrant A | 1,425,120 | 1,308,896 |
| Events in quadrant B | 1,385,808 | 1,287,726 |
| Events in quadrant C | 1,391,106 | 1,199,140 |
| Events in quadrant D | 1,240,144 | 1,154,180 |
| Mode M9 | |||
|---|---|---|---|
| Quadrant | BADHDUFLAG | Total packets | Discarded packets |
| A | 0 | 29 | 0 |
| B | 0 | 29 | 0 |
| C | 0 | 29 | 0 |
| D | 0 | 29 | 0 |
| Mode M0 | |||
|---|---|---|---|
| Quadrant | BADHDUFLAG | Total packets | Discarded packets |
| A | 0 | 66833 | 0 |
| B | 0 | 53260 | 0 |
| C | 0 | 70775 | 0 |
| D | 0 | 57004 | 0 |
| Mode SS | |||
|---|---|---|---|
| Quadrant | BADHDUFLAG | Total packets | Discarded packets |
| A | 0 | 518 | 0 |
| B | 0 | 518 | 0 |
| C | 0 | 518 | 0 |
| D | 0 | 518 | 0 |
| Quadrant | Total seconds | Saturated seconds | Saturation percentage |
|---|---|---|---|
| A | 25606 | 331 | 1.292666% |
| B | 25606 | 255 | 0.995860% |
| C | 25606 | 210 | 0.820120% |
| D | 25606 | 351 | 1.370772% |
Noise dominated data is calculated using 1-second bins in cleaned event files. If a bin has >2000 counts, and if more than 50% of those come from <1% of pixels, then it is considered to be noise-dominated and hence unusable.
| Quadrant | # 1 sec bins | Bins with >0 counts | Bins with >2000 counts | High rate bins dominated by noise | Noise dominated (total time) | Noise dominated (detector-on time) | Marked lightcurve |
|---|---|---|---|---|---|---|---|
| A | 28456 | 25601 | 0 | 0 | 0.00% | 0.00% |  |
| B | 28456 | 25601 | 0 | 0 | 0.00% | 0.00% | 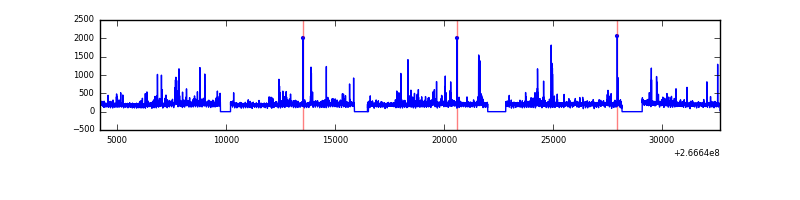 |
| C | 28456 | 25603 | 0 | 0 | 0.00% | 0.00% | 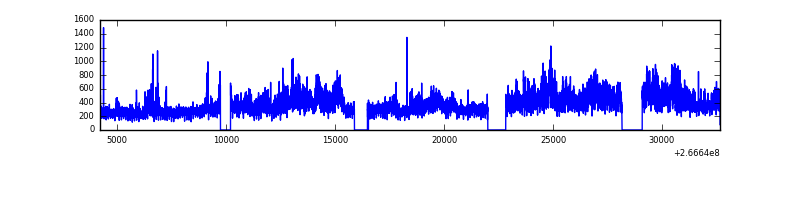 |
| D | 28456 | 25600 | 0 | 0 | 0.00% | 0.00% |  |
Top three noisy pixels from each quadrant. If the there are fewer than three noisy pixels in the level2.evt file, extra rows are filled as -1
| Pixel properties | Quadrant properties | ||||||
|---|---|---|---|---|---|---|---|
| Quadrant | DetID | PixID | Counts | Sigma | Mean | Median | Sigma |
| A | 0 | 29 | 1347 | 10.61 | 370 | 346 | 94.3 |
| A | 7 | 110 | 1187 | 8.92 | 370 | 346 | 94.3 |
| A | 15 | 236 | 1115 | 8.15 | 370 | 346 | 94.3 |
| B | 2 | 9 | 1179 | 11.11 | 365 | 348 | 74.8 |
| B | 5 | 232 | 939 | 7.9 | 365 | 348 | 74.8 |
| B | 3 | 17 | 919 | 7.63 | 365 | 348 | 74.8 |
| C | 12 | 241 | 965 | 6.51 | 367 | 340 | 96.0 |
| C | 3 | 126 | 951 | 6.37 | 367 | 340 | 96.0 |
| C | 7 | 111 | 938 | 6.23 | 367 | 340 | 96.0 |
| D | 3 | 14 | 926 | 6.26 | 354 | 321 | 96.6 |
| D | 6 | 231 | 911 | 6.11 | 354 | 321 | 96.6 |
| D | 1 | 19 | 887 | 5.86 | 354 | 321 | 96.6 |
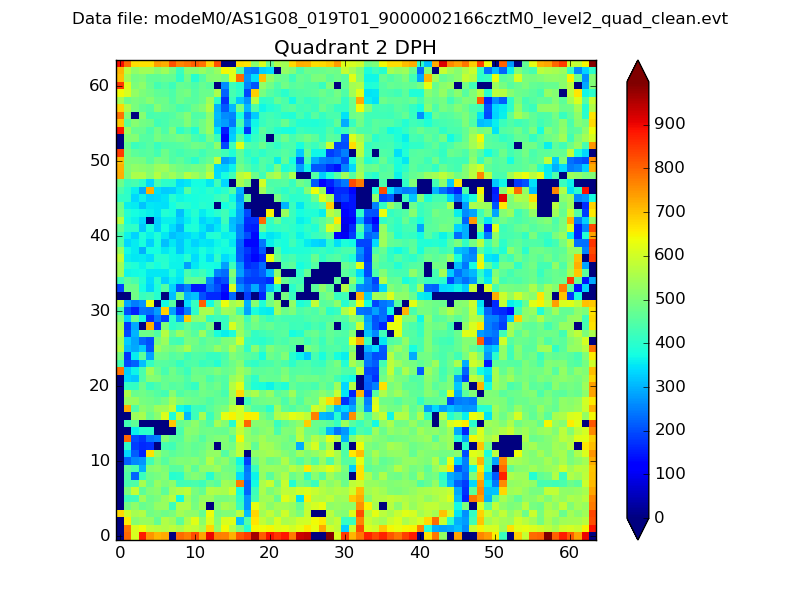
Histogram calculated using DETX and DETY for each event in the final _common_clean file
| Quadrant A |  |
 |
Quadrant B |
|---|---|---|---|
| Quadrant D | 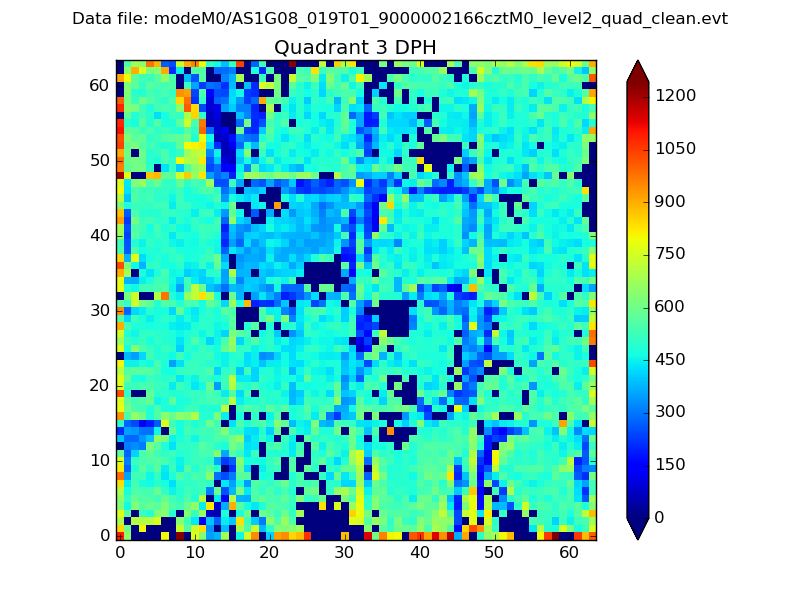 |
 |
Quadrant C |
| Plot type | Count rate plots | Images |
|---|---|---|
| Comparison with Poisson distribution Blue bars denote a histogram of data divided into 1 sec bins. Red curve is a Poisson curve with rate = median count rate of data. |
 |
 |
| Quadrant-wise count rates Data is divided into 100 sec bins |
 |
|
| Module-wise count rates for Quadrant A Data is divided into 100 sec bins |
 |
 |
| Module-wise count rates for Quadrant B Data is divided into 100 sec bins |
 |
 |
| Module-wise count rates for Quadrant C Data is divided into 100 sec bins |
 |
 |
| Module-wise count rates for Quadrant D Data is divided into 100 sec bins |
 |
 |
| Parameter | Plot |
|---|---|
| CZT HV Monitor |  |
| D_VDD | 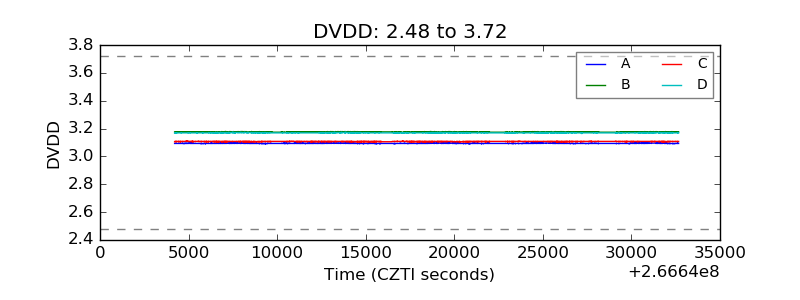 |
| Temperature 1 |  |
| Veto HV Monitor |  |
| Veto LLD |  |
| Alpha Counter |  |
| _CPM_Rate |  |
| CZT Counter |  |
| +2.5 Volts monitor |  |
| +5 Volts monitor |  |
| _ROLL_ROT |  |
| _Roll_DEC |  |
| _Roll_RA | 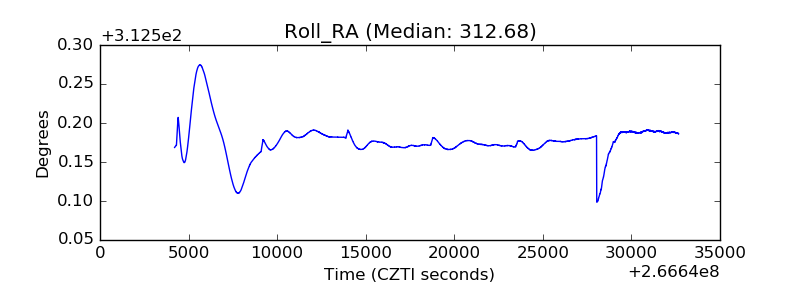 |
| Veto Counter |  |