| Param | Original file | Final file |
|---|---|---|
| Filename | modeM0/AS1G08_019T01_9000002166_14653cztM0_level2.evt | modeM0/AS1G08_019T01_9000002166_14653cztM0_level2_quad_clean.evt |
| Size (bytes) | 115,413,120 | 22,567,680 |
| Size | 110.1 MB | 21.5 MB |
| Events in quadrant A | 1,738,769 | 143,167 |
| Events in quadrant B | 534,289 | 150,029 |
| Events in quadrant C | 631,013 | 146,634 |
| Events in quadrant D | 503,690 | 149,021 |
| Mode M0 | |||
|---|---|---|---|
| Quadrant | BADHDUFLAG | Total packets | Discarded packets |
| A | 0 | 6032 | 1 |
| B | 0 | 2516 | 0 |
| C | 0 | 2576 | 0 |
| D | 0 | 2521 | 0 |
| Mode SS | |||
|---|---|---|---|
| Quadrant | BADHDUFLAG | Total packets | Discarded packets |
| A | 0 | 24 | 0 |
| B | 0 | 24 | 0 |
| C | 0 | 24 | 0 |
| D | 0 | 24 | 0 |
| Quadrant | Total seconds | Saturated seconds | Saturation percentage |
|---|---|---|---|
| A | 1251 | 28 | 2.238209% |
| B | 1251 | 0 | 0.000000% |
| C | 1251 | 1 | 0.079936% |
| D | 1251 | 0 | 0.000000% |
Noise dominated data is calculated using 1-second bins in cleaned event files. If a bin has >2000 counts, and if more than 50% of those come from <1% of pixels, then it is considered to be noise-dominated and hence unusable.
| Quadrant | # 1 sec bins | Bins with >0 counts | Bins with >2000 counts | High rate bins dominated by noise | Noise dominated (total time) | Noise dominated (detector-on time) | Marked lightcurve |
|---|---|---|---|---|---|---|---|
| A | 1252 | 1252 | 24 | 24 | 1.92% | 1.92% | 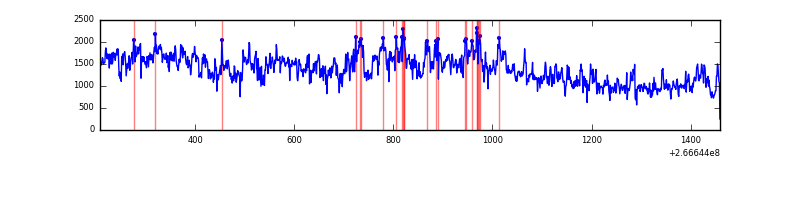 |
| B | 1252 | 1252 | 0 | 0 | 0.00% | 0.00% | 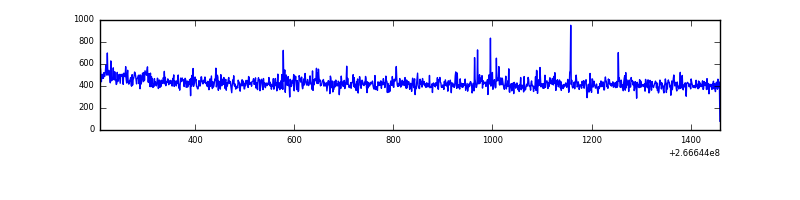 |
| C | 1252 | 1252 | 1 | 1 | 0.08% | 0.08% | 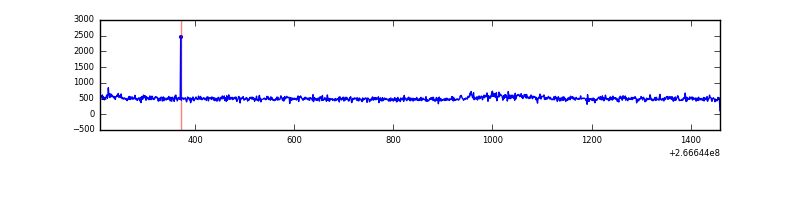 |
| D | 1252 | 1252 | 0 | 0 | 0.00% | 0.00% | 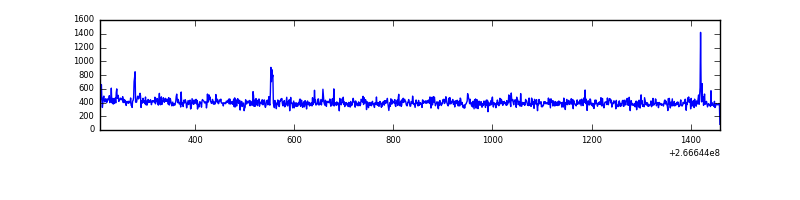 |
Top three noisy pixels from each quadrant. If the there are fewer than three noisy pixels in the level2.evt file, extra rows are filled as -1
| Pixel properties | Quadrant properties | ||||||
|---|---|---|---|---|---|---|---|
| Quadrant | DetID | PixID | Counts | Sigma | Mean | Median | Sigma |
| A | 0 | 253 | 904494 | 31629.79 | 132 | 129 | 28.6 |
| A | 0 | 23 | 299854 | 10482.76 | 132 | 129 | 28.6 |
| A | 0 | 226 | 19170 | 665.95 | 132 | 129 | 28.6 |
| B | 4 | 80 | 4352 | 151.53 | 134 | 130 | 27.9 |
| B | 0 | 214 | 4091 | 142.17 | 134 | 130 | 27.9 |
| B | 12 | 111 | 3071 | 105.56 | 134 | 130 | 27.9 |
| C | 3 | 233 | 123781 | 3904.41 | 129 | 129 | 31.7 |
| C | 14 | 234 | 2111 | 62.58 | 129 | 129 | 31.7 |
| C | 13 | 61 | 869 | 23.37 | 129 | 129 | 31.7 |
| D | 15 | 0 | 6006 | 160.11 | 128 | 125 | 36.7 |
| D | 2 | 234 | 4740 | 125.64 | 128 | 125 | 36.7 |
| D | 2 | 152 | 2769 | 71.98 | 128 | 125 | 36.7 |
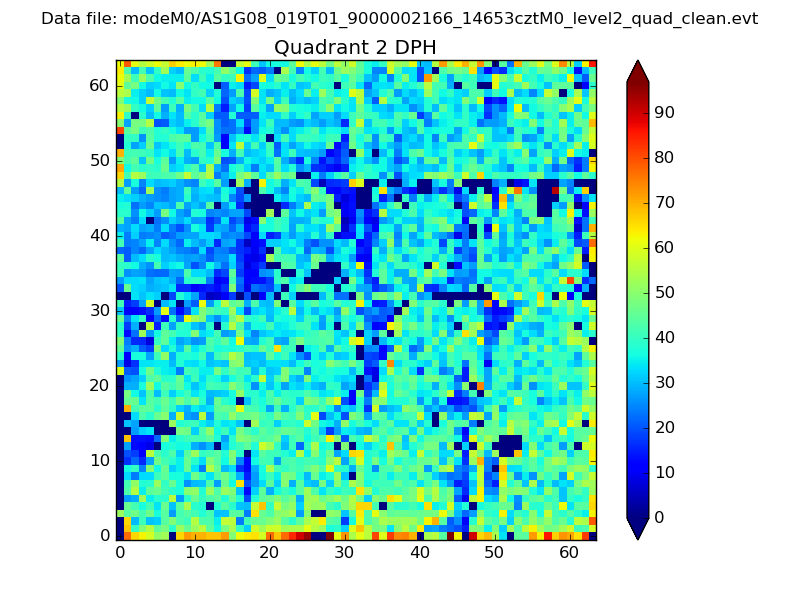
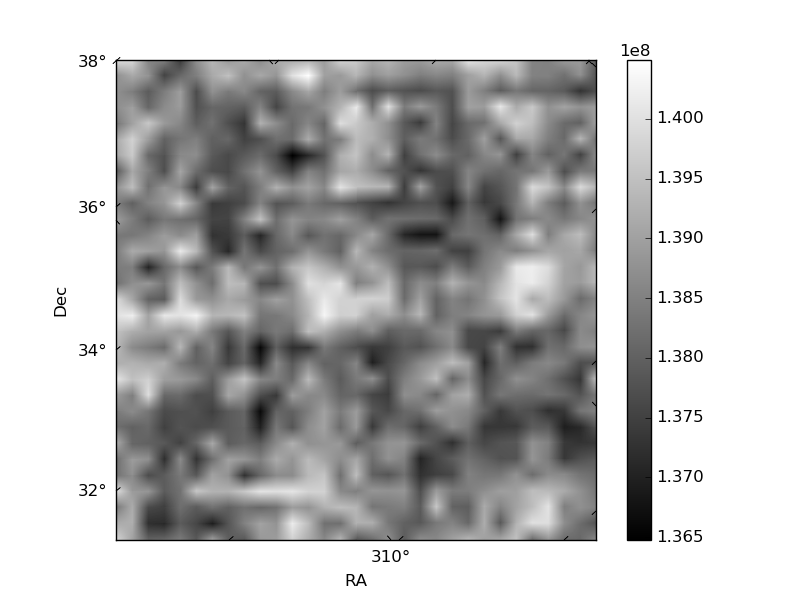
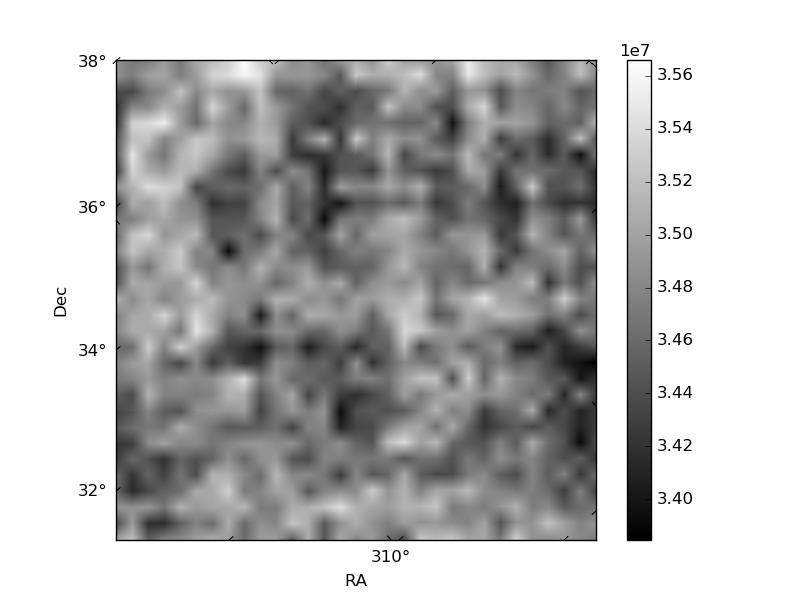
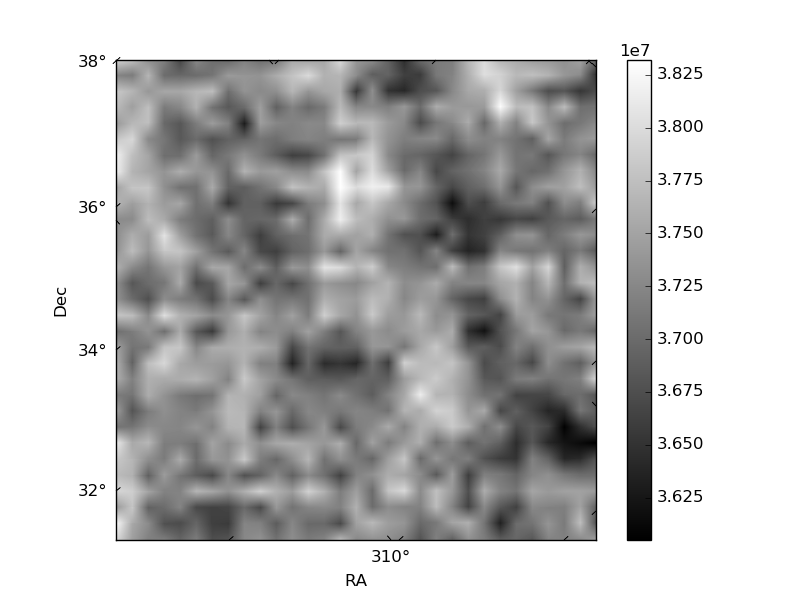
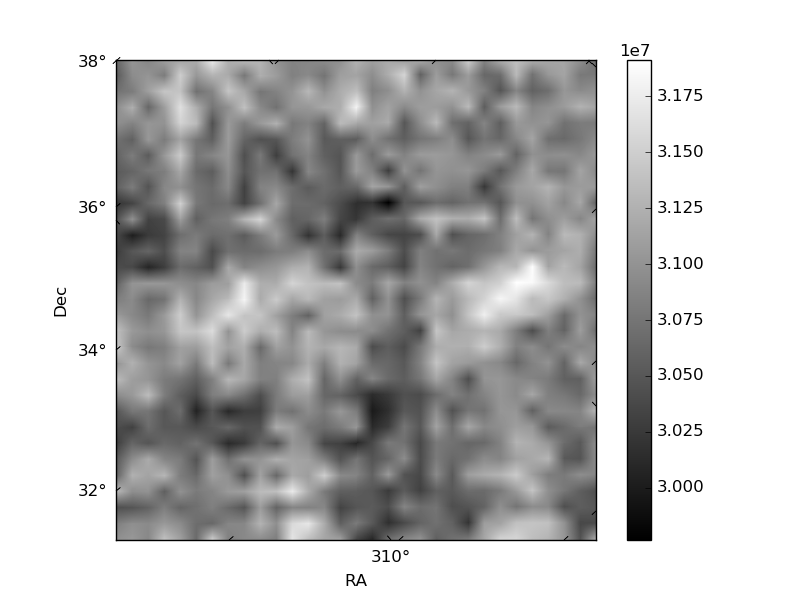
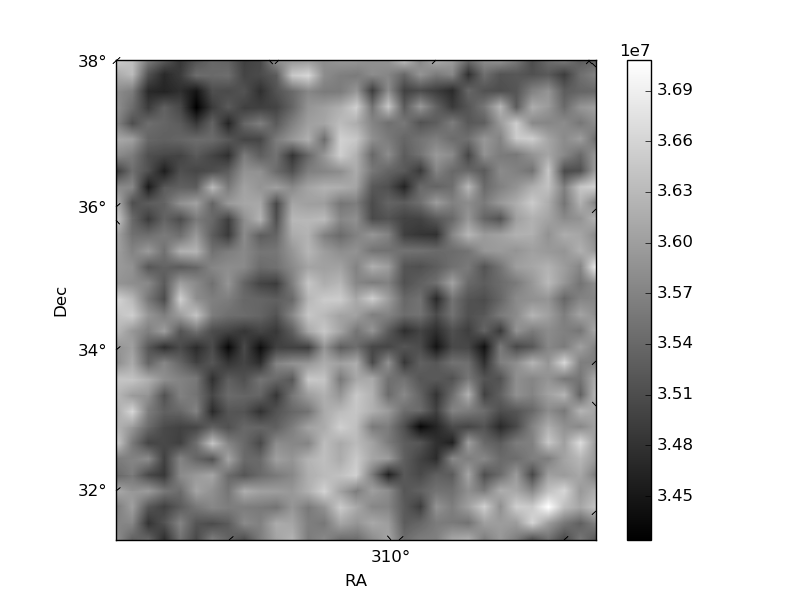
Histogram calculated using DETX and DETY for each event in the final _common_clean file
| Quadrant A | 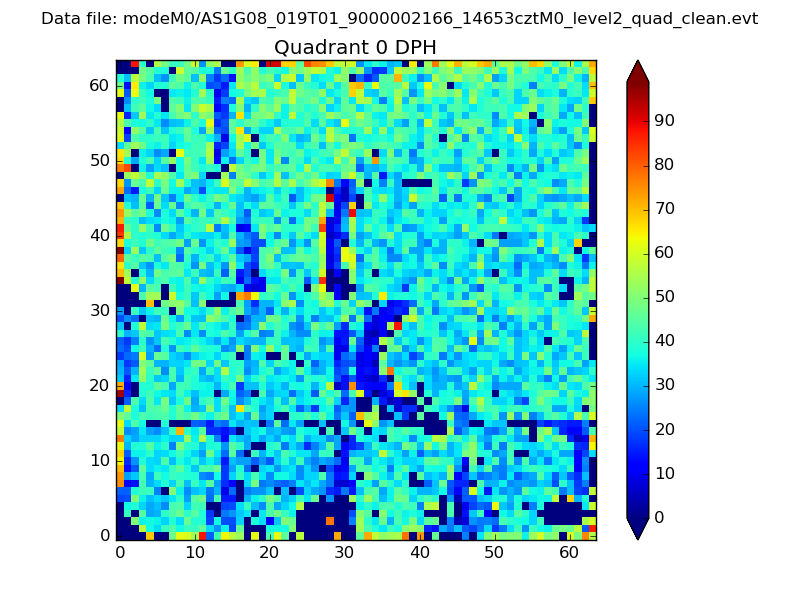 |
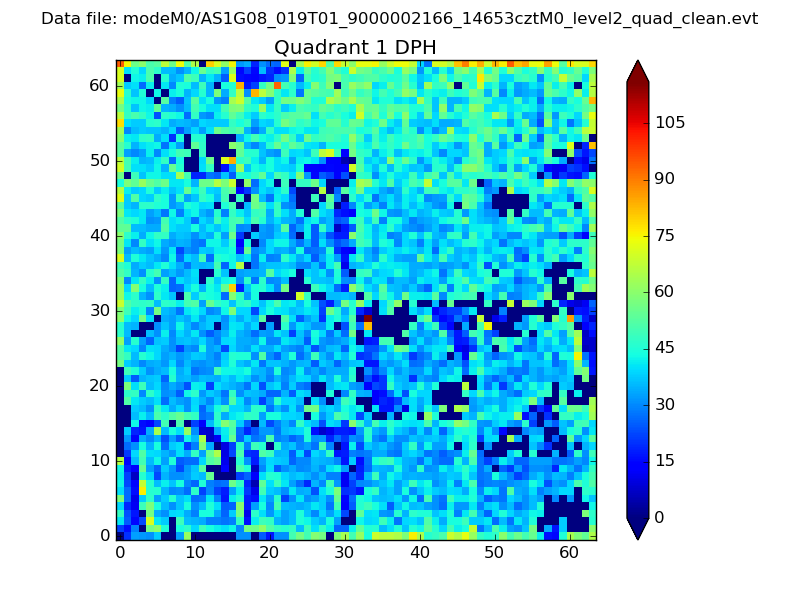 |
Quadrant B |
|---|---|---|---|
| Quadrant D | 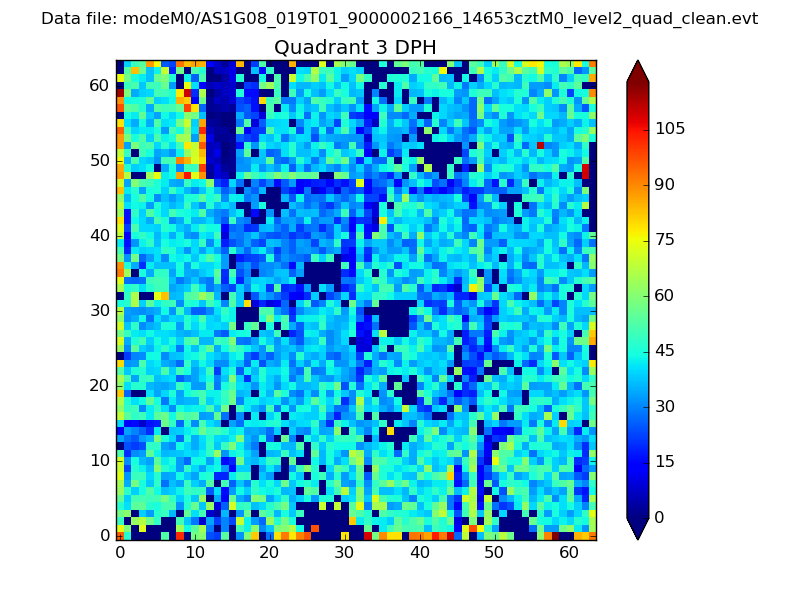 |
 |
Quadrant C |
| Plot type | Count rate plots | Images |
|---|---|---|
| Comparison with Poisson distribution Blue bars denote a histogram of data divided into 1 sec bins. Red curve is a Poisson curve with rate = median count rate of data. |
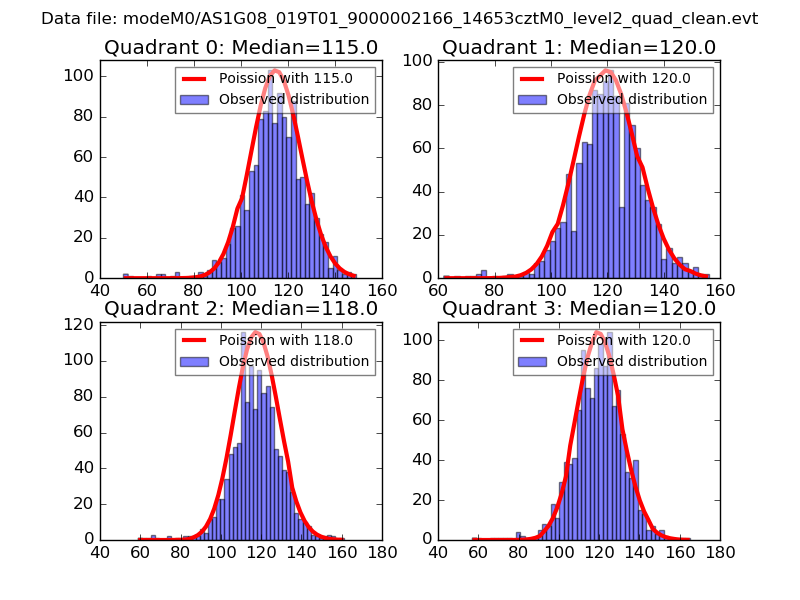 |
 |
| Quadrant-wise count rates Data is divided into 100 sec bins |
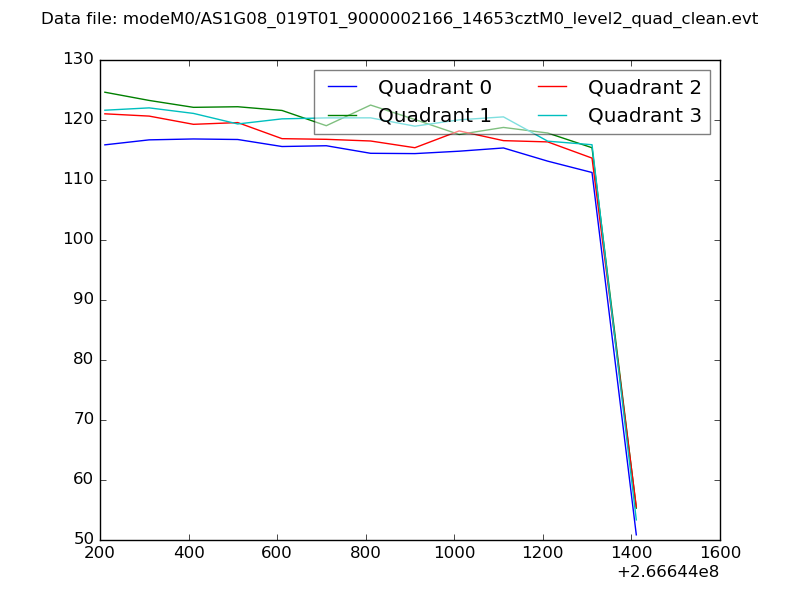 |
|
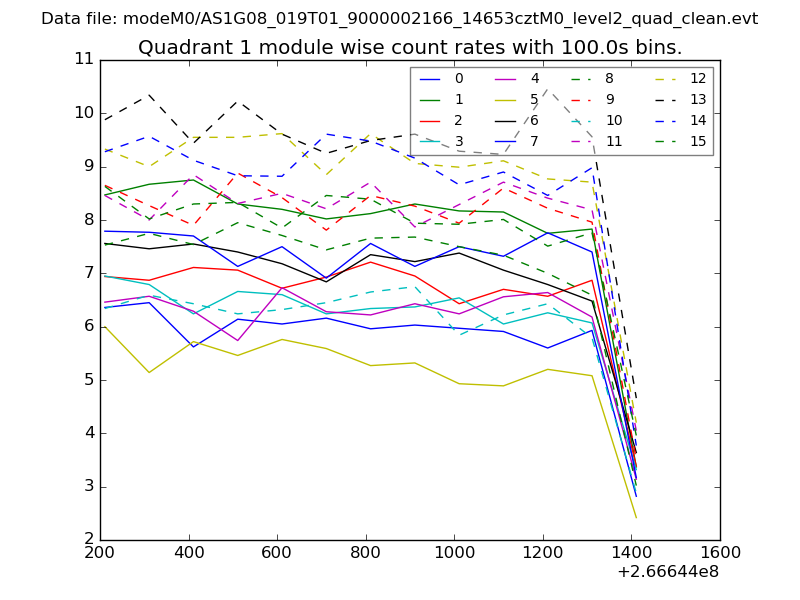
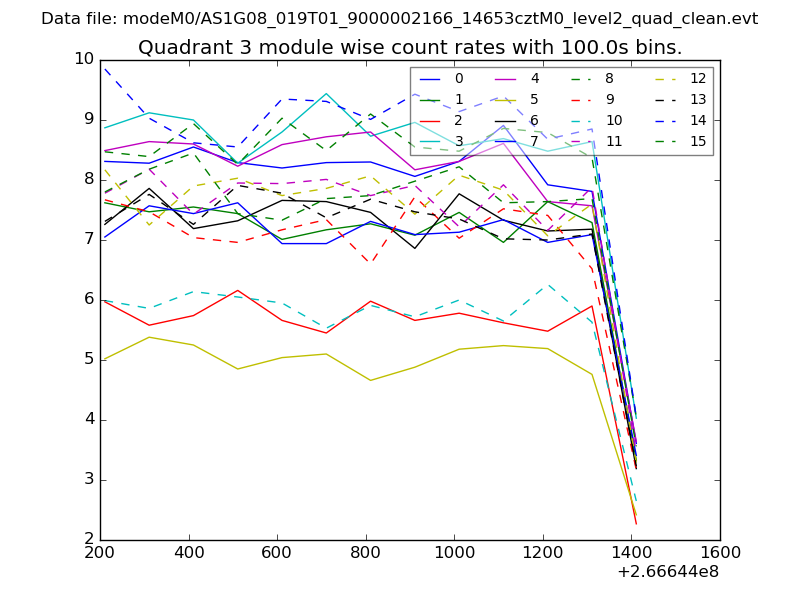
| Module-wise count rates for Quadrant A Data is divided into 100 sec bins |
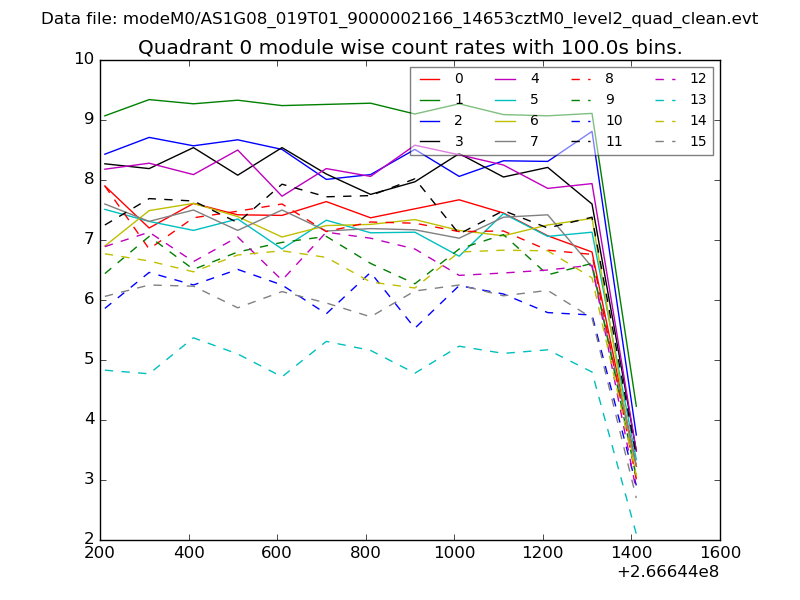 |
 |
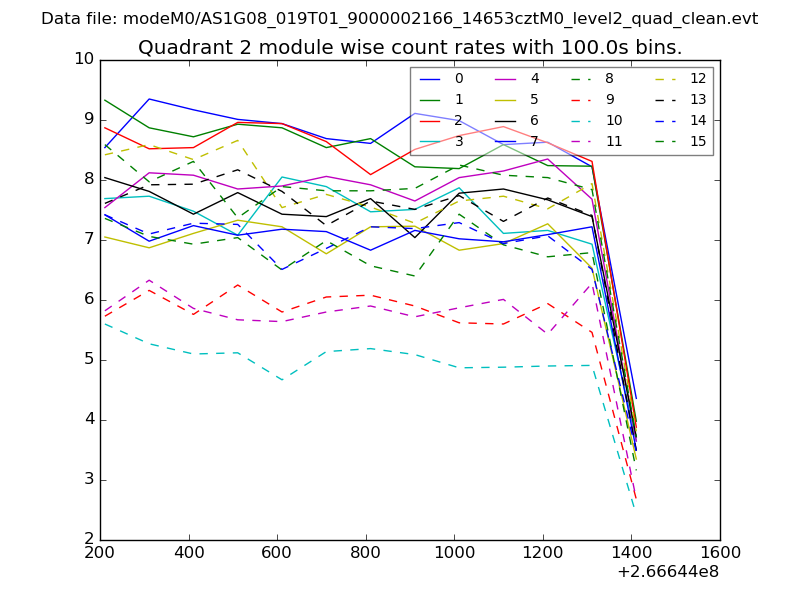
| Module-wise count rates for Quadrant B Data is divided into 100 sec bins |
 |
 |
| Module-wise count rates for Quadrant C Data is divided into 100 sec bins |
 |
 |
| Module-wise count rates for Quadrant D Data is divided into 100 sec bins |
 |
 |
| Parameter | Plot |
|---|---|
| CZT HV Monitor | 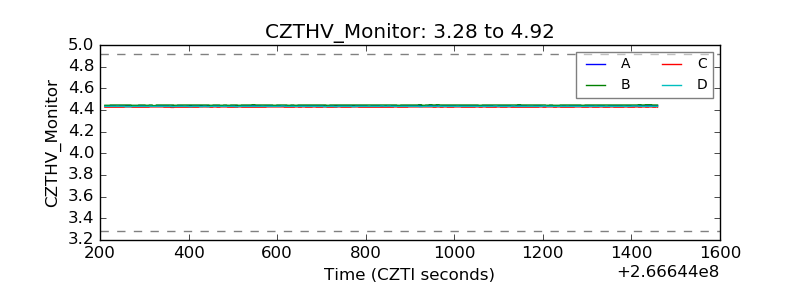 |
| D_VDD | 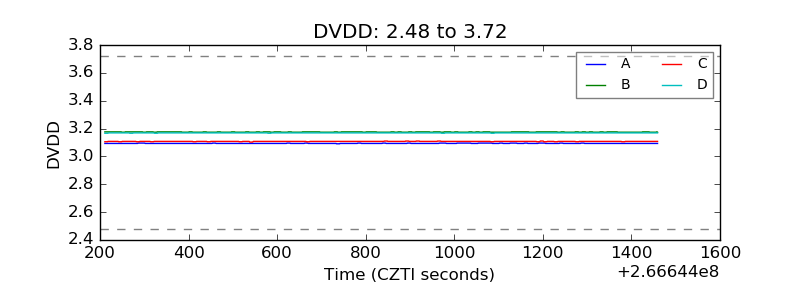 |
| Temperature 1 | 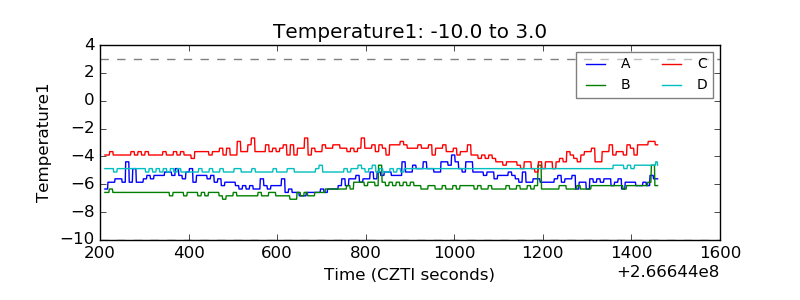 |
| Veto HV Monitor | 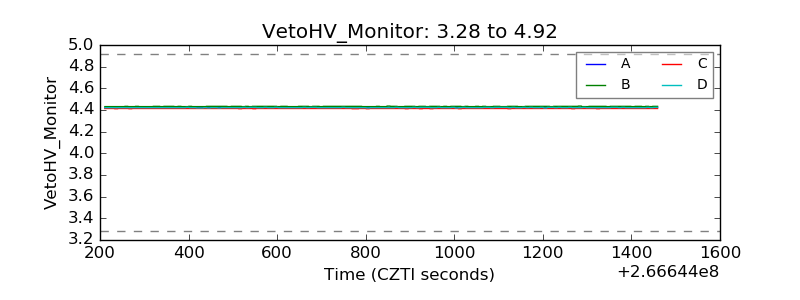 |
| Veto LLD | 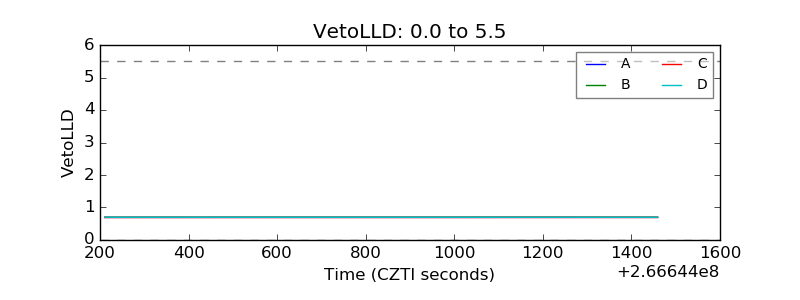 |
| Alpha Counter | 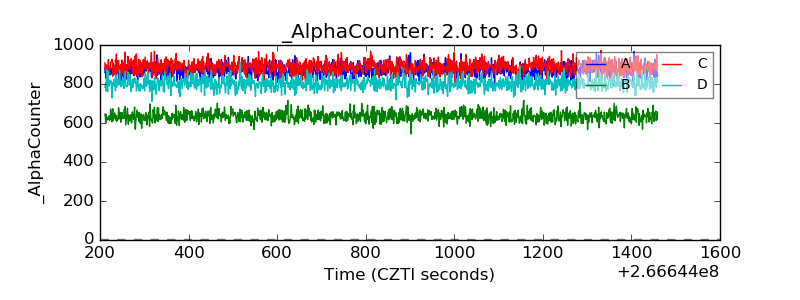 |
| _CPM_Rate | 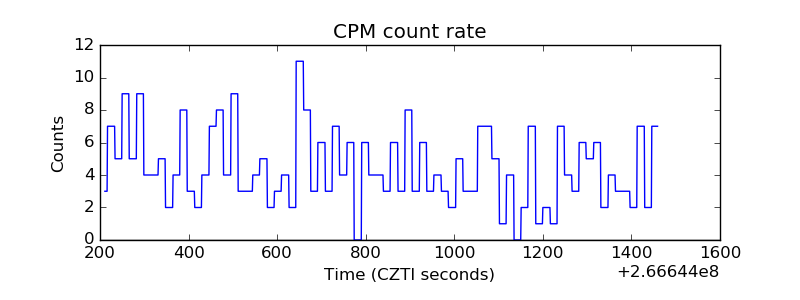 |
| CZT Counter | 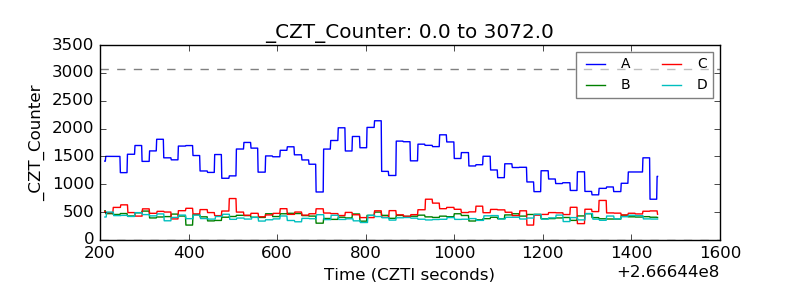 |
| +2.5 Volts monitor |  |
| +5 Volts monitor | 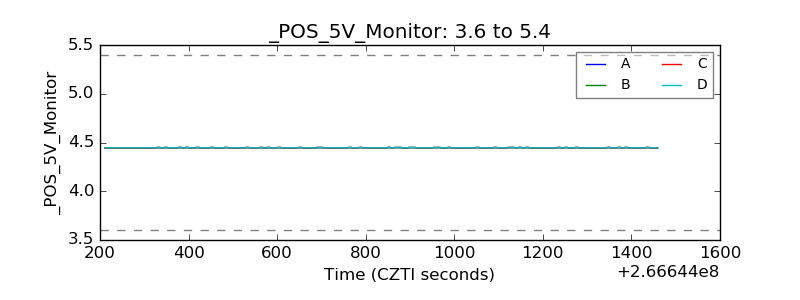 |
| _ROLL_ROT | 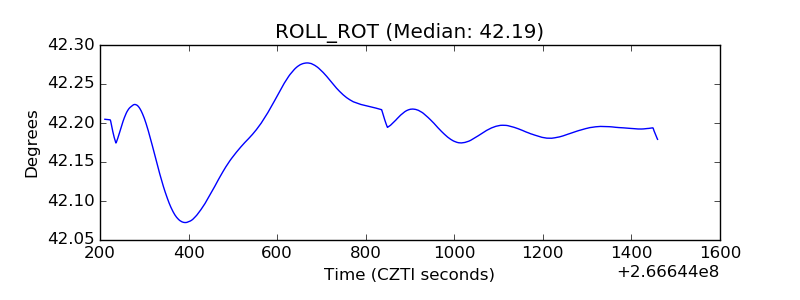 |
| _Roll_DEC | 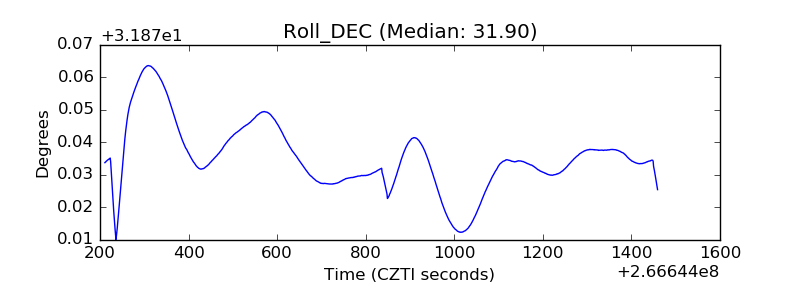 |
| _Roll_RA | 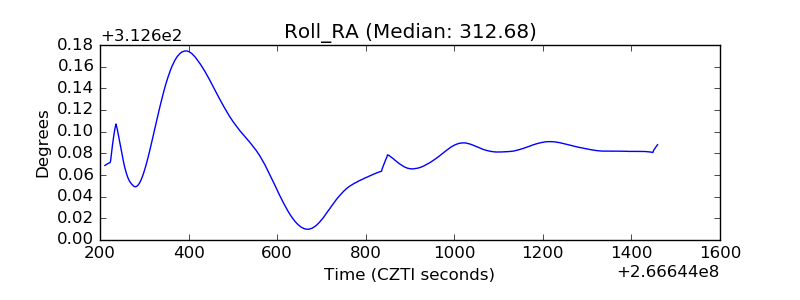 |
| Veto Counter | 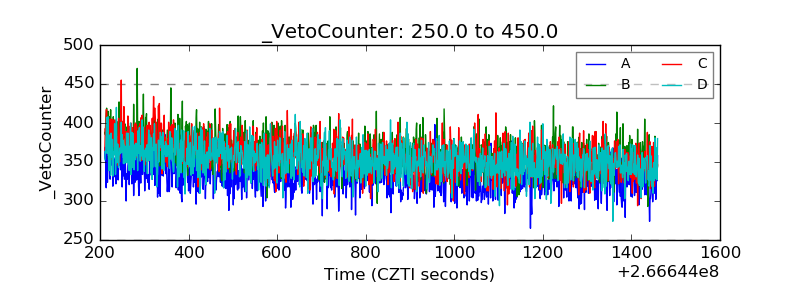 |