| Param | Original file | Final file |
|---|---|---|
| Filename | modeM0/AS1G08_019T01_9000002166_14656cztM0_level2.evt | modeM0/AS1G08_019T01_9000002166_14656cztM0_level2_quad_clean.evt |
| Size (bytes) | 1,442,960,640 | 218,465,280 |
| Size | 1.3 GB | 208.3 MB |
| Events in quadrant A | 13,038,313 | 1,349,358 |
| Events in quadrant B | 8,774,846 | 1,364,019 |
| Events in quadrant C | 11,595,406 | 1,326,205 |
| Events in quadrant D | 9,068,031 | 1,326,198 |
| Mode M9 | |||
|---|---|---|---|
| Quadrant | BADHDUFLAG | Total packets | Discarded packets |
| A | 0 | 19 | 0 |
| B | 0 | 19 | 0 |
| C | 0 | 19 | 0 |
| D | 0 | 19 | 0 |
| Mode M0 | |||
|---|---|---|---|
| Quadrant | BADHDUFLAG | Total packets | Discarded packets |
| A | 0 | 50586 | 5 |
| B | 0 | 37750 | 4 |
| C | 0 | 47080 | 4 |
| D | 0 | 39645 | 4 |
| Mode SS | |||
|---|---|---|---|
| Quadrant | BADHDUFLAG | Total packets | Discarded packets |
| A | 0 | 368 | 0 |
| B | 0 | 368 | 0 |
| C | 0 | 368 | 0 |
| D | 0 | 368 | 0 |
| Quadrant | Total seconds | Saturated seconds | Saturation percentage |
|---|---|---|---|
| A | 18150 | 257 | 1.415978% |
| B | 18150 | 177 | 0.975207% |
| C | 18150 | 119 | 0.655647% |
| D | 18150 | 267 | 1.471074% |
Noise dominated data is calculated using 1-second bins in cleaned event files. If a bin has >2000 counts, and if more than 50% of those come from <1% of pixels, then it is considered to be noise-dominated and hence unusable.
| Quadrant | # 1 sec bins | Bins with >0 counts | Bins with >2000 counts | High rate bins dominated by noise | Noise dominated (total time) | Noise dominated (detector-on time) | Marked lightcurve |
|---|---|---|---|---|---|---|---|
| A | 20071 | 18151 | 41 | 41 | 0.20% | 0.23% | 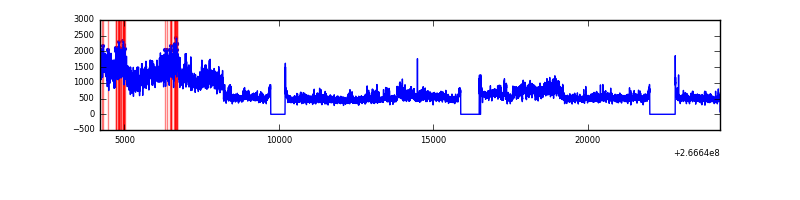 |
| B | 20071 | 18151 | 16 | 16 | 0.08% | 0.09% | 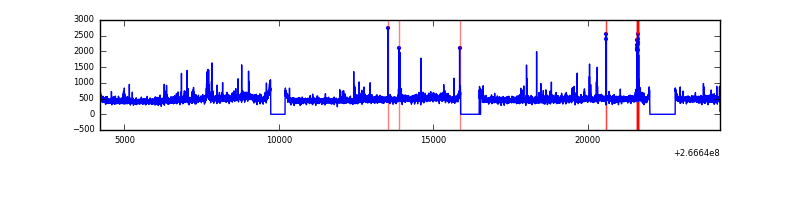 |
| C | 20071 | 18153 | 1 | 1 | 0.00% | 0.01% | 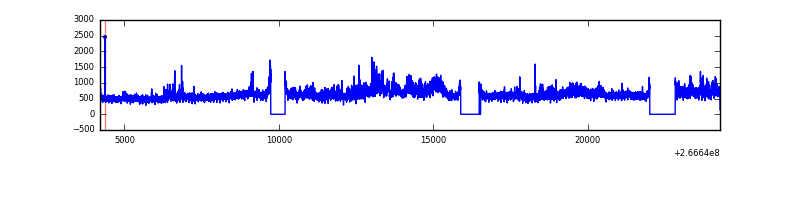 |
| D | 20071 | 18152 | 143 | 143 | 0.71% | 0.79% | 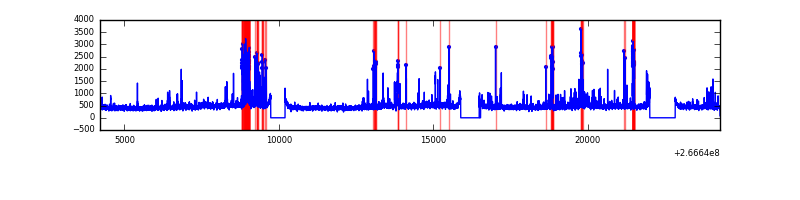 |
Top three noisy pixels from each quadrant. If the there are fewer than three noisy pixels in the level2.evt file, extra rows are filled as -1
| Pixel properties | Quadrant properties | ||||||
|---|---|---|---|---|---|---|---|
| Quadrant | DetID | PixID | Counts | Sigma | Mean | Median | Sigma |
| A | 0 | 253 | 2935065 | 6749.87 | 2148 | 2098 | 434.5 |
| A | 0 | 23 | 1434260 | 3295.95 | 2148 | 2098 | 434.5 |
| A | 1 | 162 | 125193 | 283.29 | 2148 | 2098 | 434.5 |
| B | 4 | 173 | 76397 | 181.38 | 2144 | 2088 | 409.7 |
| B | 0 | 197 | 50957 | 119.28 | 2144 | 2088 | 409.7 |
| B | 12 | 111 | 49634 | 116.05 | 2144 | 2088 | 409.7 |
| C | 3 | 233 | 3449537 | 7233.72 | 2070 | 2078 | 476.6 |
| C | 9 | 54 | 40767 | 81.18 | 2070 | 2078 | 476.6 |
| C | 3 | 234 | 25746 | 49.66 | 2070 | 2078 | 476.6 |
| D | 13 | 122 | 465411 | 919.43 | 2077 | 2025 | 504.0 |
| D | 5 | 222 | 205138 | 403.01 | 2077 | 2025 | 504.0 |
| D | 10 | 199 | 171942 | 337.14 | 2077 | 2025 | 504.0 |
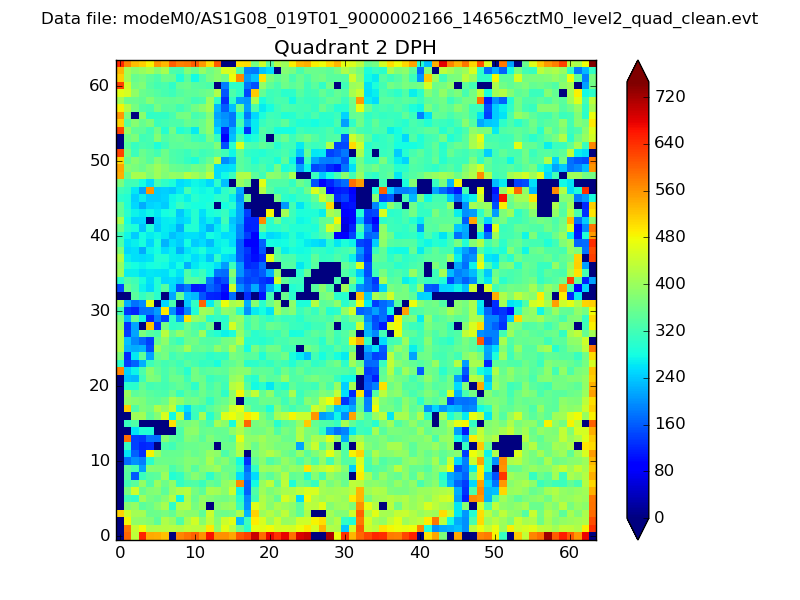
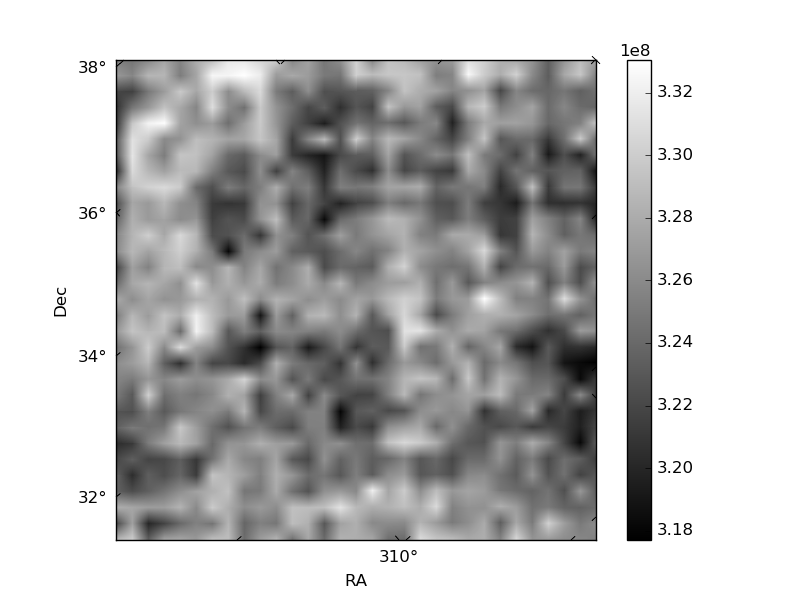
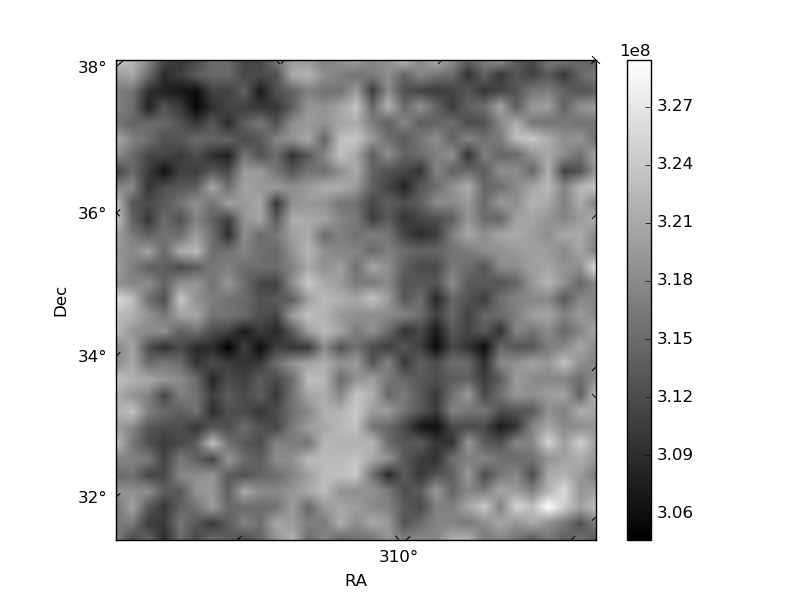
Histogram calculated using DETX and DETY for each event in the final _common_clean file
| Quadrant A |  |
 |
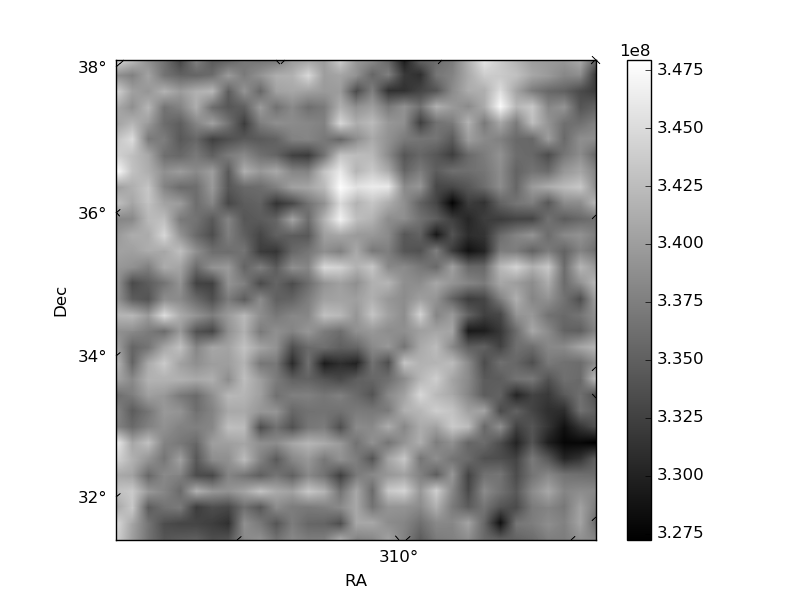
Quadrant B |
|---|---|---|---|
| Quadrant D | 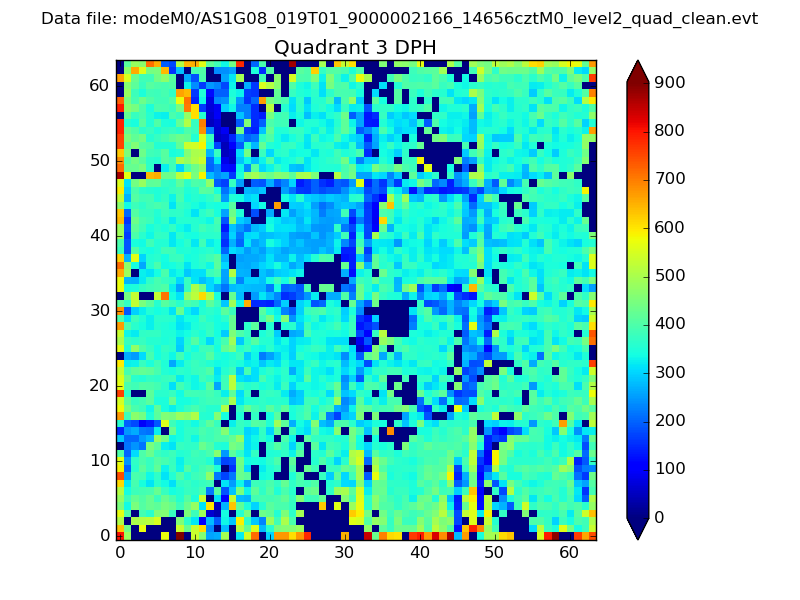 |
 |
Quadrant C |
| Plot type | Count rate plots | Images |
|---|---|---|
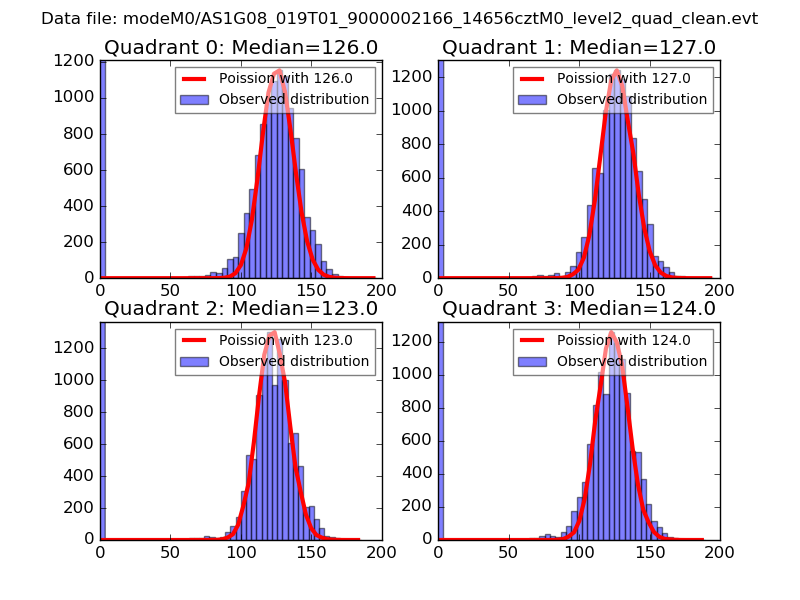
| Comparison with Poisson distribution Blue bars denote a histogram of data divided into 1 sec bins. Red curve is a Poisson curve with rate = median count rate of data. |
 |
 |
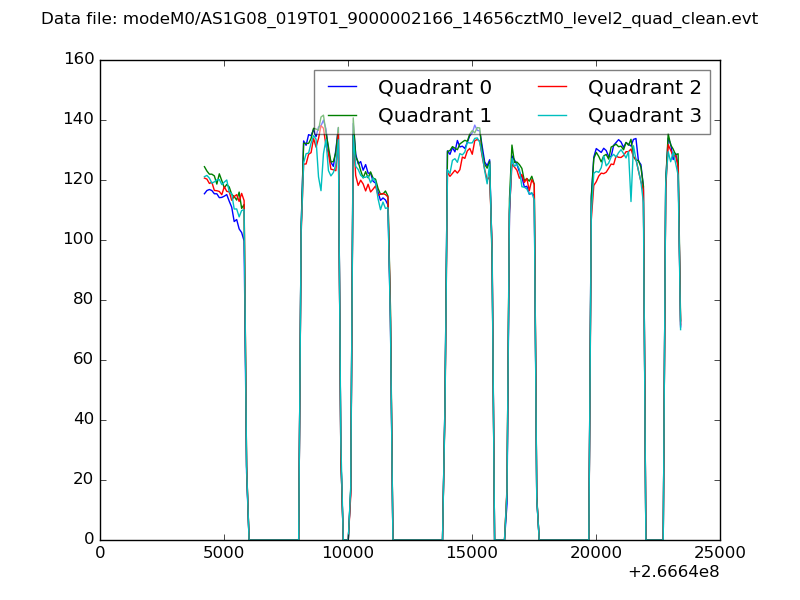
| Quadrant-wise count rates Data is divided into 100 sec bins |
 |
|
| Module-wise count rates for Quadrant A Data is divided into 100 sec bins |
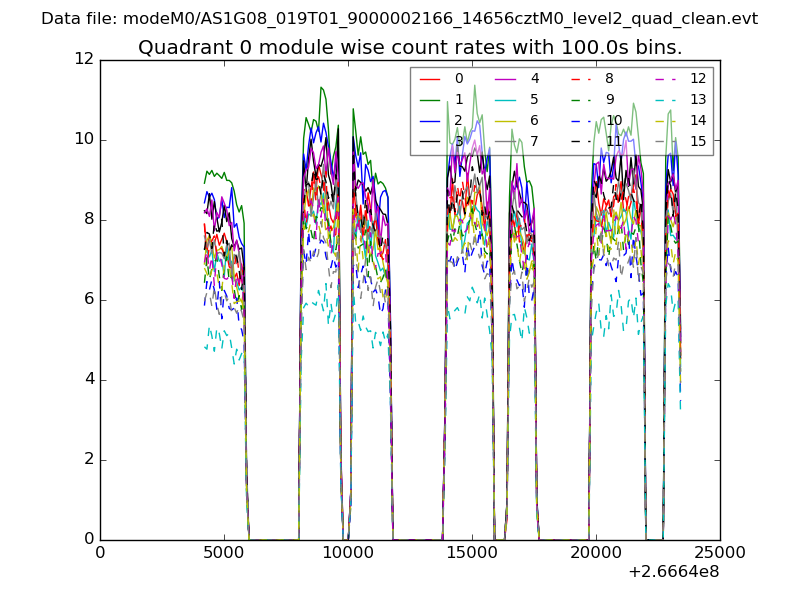 |
 |
| Module-wise count rates for Quadrant B Data is divided into 100 sec bins |
 |
 |
| Module-wise count rates for Quadrant C Data is divided into 100 sec bins |
 |
 |
| Module-wise count rates for Quadrant D Data is divided into 100 sec bins |
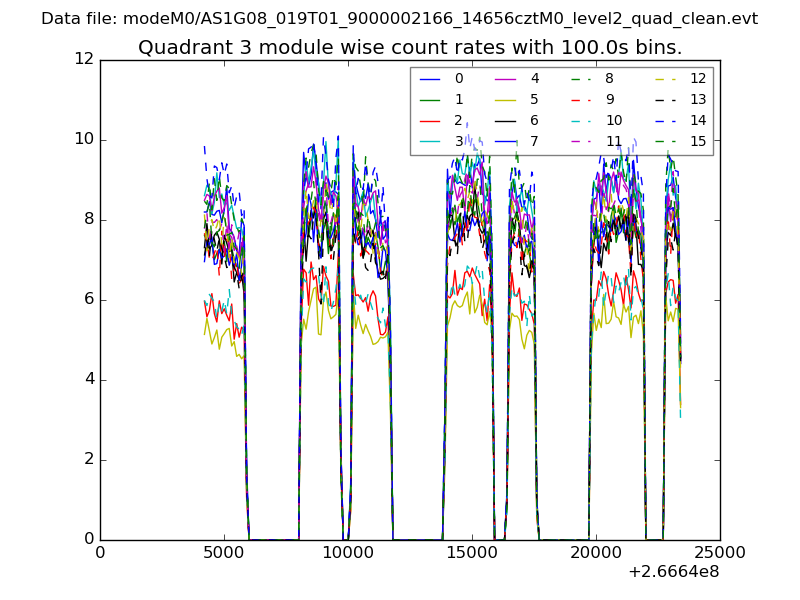 |
 |
| Parameter | Plot |
|---|---|
| CZT HV Monitor | 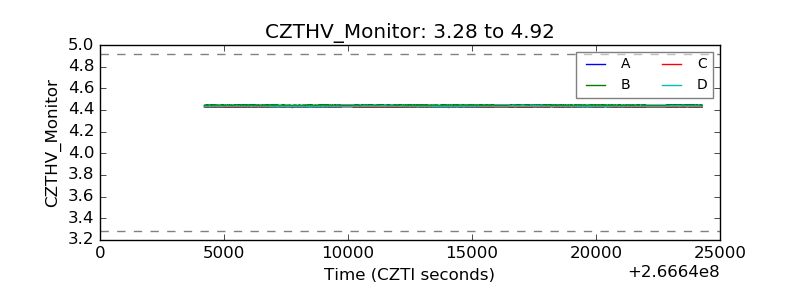 |
| D_VDD | 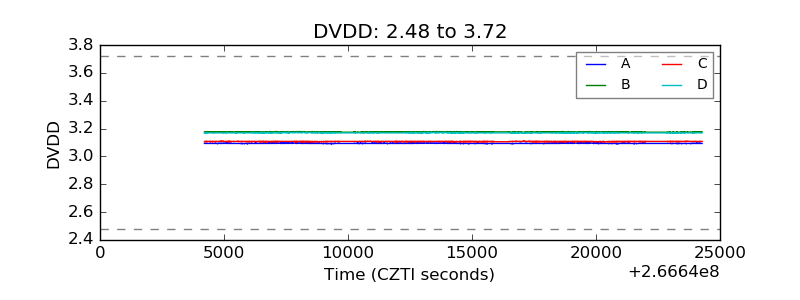 |
| Temperature 1 | 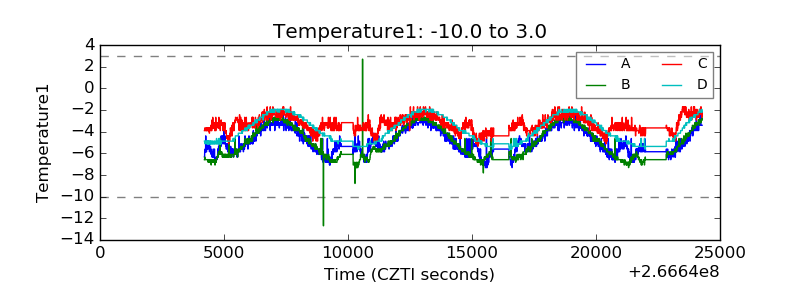 |
| Veto HV Monitor | 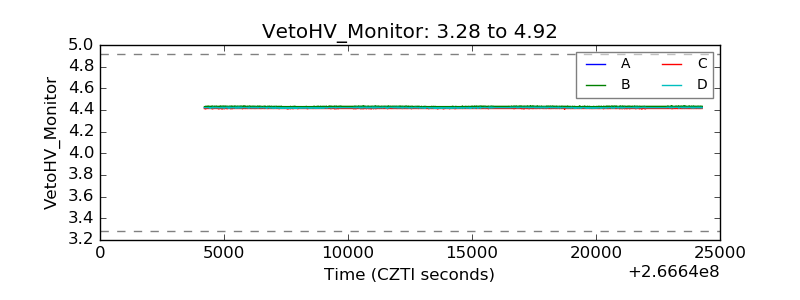 |
| Veto LLD | 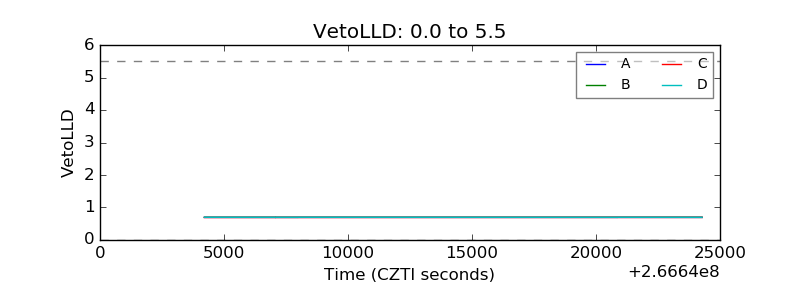 |
| Alpha Counter | 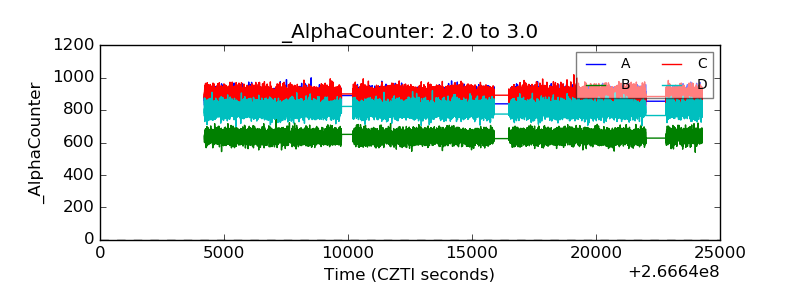 |
| _CPM_Rate | 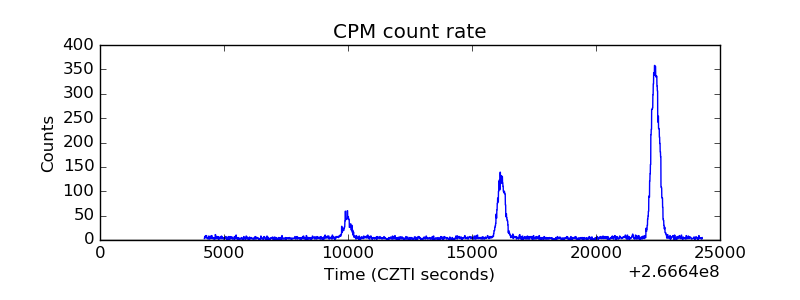 |
| CZT Counter | 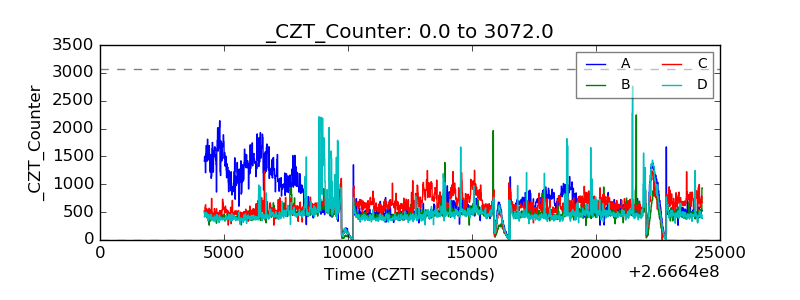 |
| +2.5 Volts monitor |  |
| +5 Volts monitor | 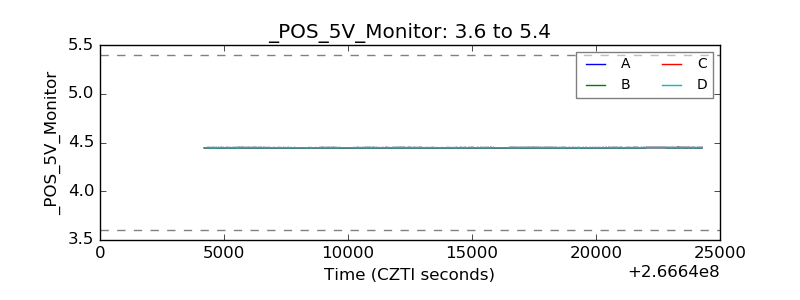 |
| _ROLL_ROT | 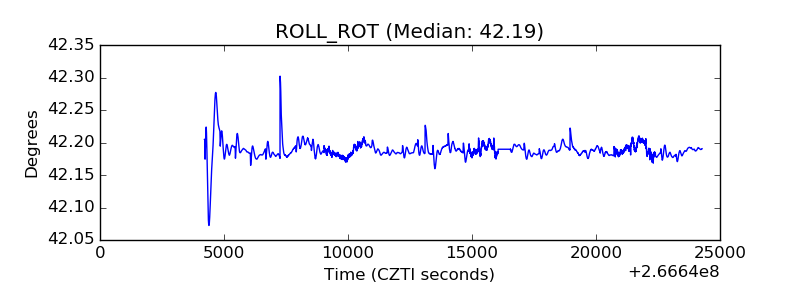 |
| _Roll_DEC | 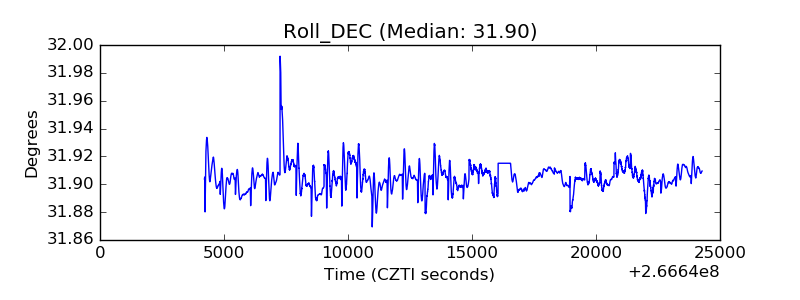 |
| _Roll_RA | 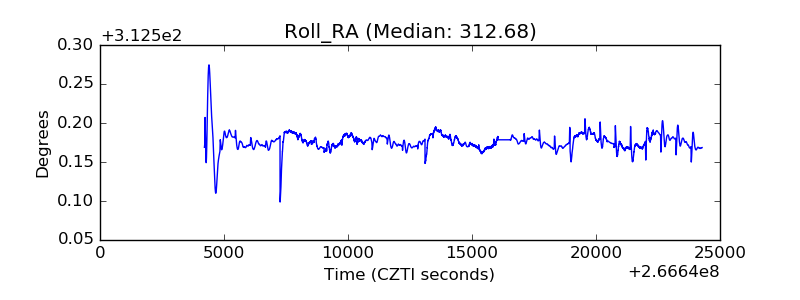 |
| Veto Counter | 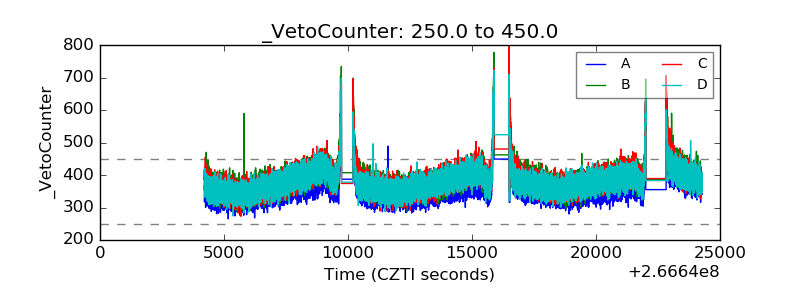 |