| Param | Original file | Final file |
|---|---|---|
| Filename | modeM0/AS1G08_019T01_9000002166_14658cztM0_level2.evt | modeM0/AS1G08_019T01_9000002166_14658cztM0_level2_quad_clean.evt |
| Size (bytes) | 302,791,680 | 32,244,480 |
| Size | 288.8 MB | 30.8 MB |
| Events in quadrant A | 2,070,862 | 185,203 |
| Events in quadrant B | 1,784,972 | 183,692 |
| Events in quadrant C | 2,939,641 | 175,580 |
| Events in quadrant D | 2,131,586 | 178,795 |
| Mode M9 | |||
|---|---|---|---|
| Quadrant | BADHDUFLAG | Total packets | Discarded packets |
| A | 0 | 3 | 0 |
| B | 0 | 3 | 0 |
| C | 0 | 3 | 0 |
| D | 0 | 4 | 0 |
| Mode M0 | |||
|---|---|---|---|
| Quadrant | BADHDUFLAG | Total packets | Discarded packets |
| A | 0 | 8285 | 1 |
| B | 0 | 7481 | 1 |
| C | 0 | 11369 | 1 |
| D | 0 | 8552 | 1 |
| Mode SS | |||
|---|---|---|---|
| Quadrant | BADHDUFLAG | Total packets | Discarded packets |
| A | 0 | 70 | 0 |
| B | 0 | 70 | 0 |
| C | 0 | 70 | 0 |
| D | 0 | 70 | 0 |
| Quadrant | Total seconds | Saturated seconds | Saturation percentage |
|---|---|---|---|
| A | 3571 | 29 | 0.812097% |
| B | 3571 | 25 | 0.700084% |
| C | 3571 | 40 | 1.120134% |
| D | 3571 | 26 | 0.728087% |
Noise dominated data is calculated using 1-second bins in cleaned event files. If a bin has >2000 counts, and if more than 50% of those come from <1% of pixels, then it is considered to be noise-dominated and hence unusable.
| Quadrant | # 1 sec bins | Bins with >0 counts | Bins with >2000 counts | High rate bins dominated by noise | Noise dominated (total time) | Noise dominated (detector-on time) | Marked lightcurve |
|---|---|---|---|---|---|---|---|
| A | 3572 | 3572 | 0 | 0 | 0.00% | 0.00% | 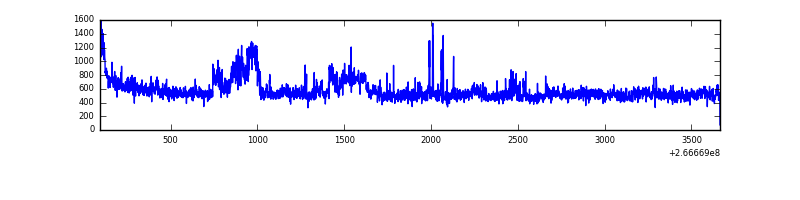 |
| B | 3572 | 3572 | 1 | 1 | 0.03% | 0.03% | 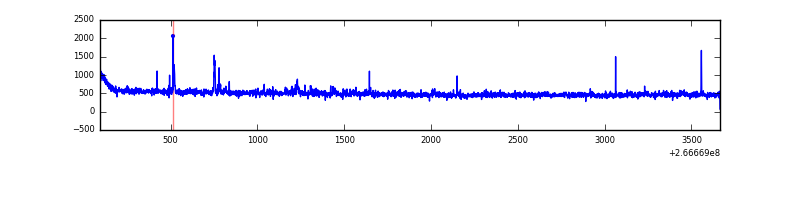 |
| C | 3572 | 3572 | 0 | 0 | 0.00% | 0.00% | 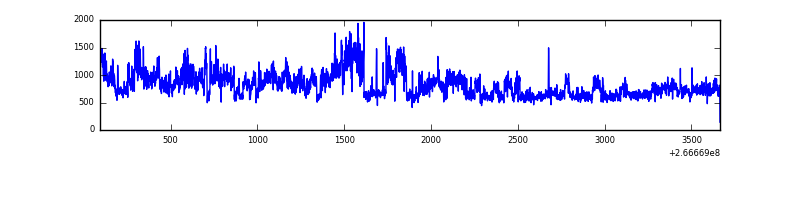 |
| D | 3572 | 3572 | 22 | 22 | 0.62% | 0.62% | 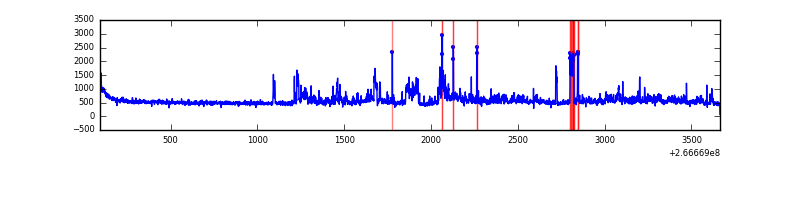 |
Top three noisy pixels from each quadrant. If the there are fewer than three noisy pixels in the level2.evt file, extra rows are filled as -1
| Pixel properties | Quadrant properties | ||||||
|---|---|---|---|---|---|---|---|
| Quadrant | DetID | PixID | Counts | Sigma | Mean | Median | Sigma |
| A | 0 | 23 | 233806 | 2537.44 | 449 | 440 | 92.0 |
| A | 1 | 162 | 34344 | 368.65 | 449 | 440 | 92.0 |
| A | 12 | 189 | 23503 | 250.77 | 449 | 440 | 92.0 |
| B | 0 | 205 | 14491 | 162.33 | 443 | 432 | 86.6 |
| B | 4 | 173 | 12213 | 136.03 | 443 | 432 | 86.6 |
| B | 10 | 246 | 10649 | 117.97 | 443 | 432 | 86.6 |
| C | 3 | 233 | 1267177 | 12716.08 | 426 | 429 | 99.6 |
| C | 3 | 234 | 9671 | 92.77 | 426 | 429 | 99.6 |
| C | 13 | 61 | 3094 | 26.75 | 426 | 429 | 99.6 |
| D | 12 | 110 | 374499 | 3577.23 | 435 | 424 | 104.6 |
| D | 13 | 172 | 44262 | 419.22 | 435 | 424 | 104.6 |
| D | 5 | 222 | 22280 | 209.01 | 435 | 424 | 104.6 |
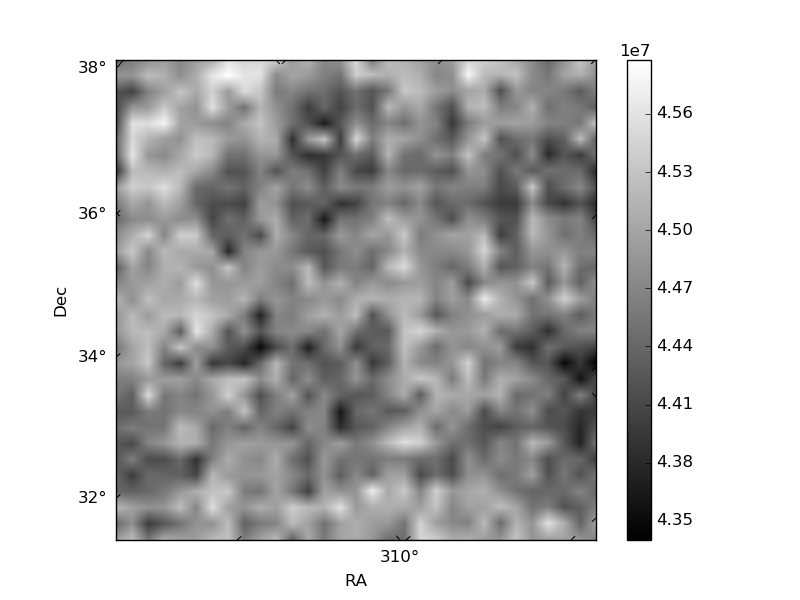
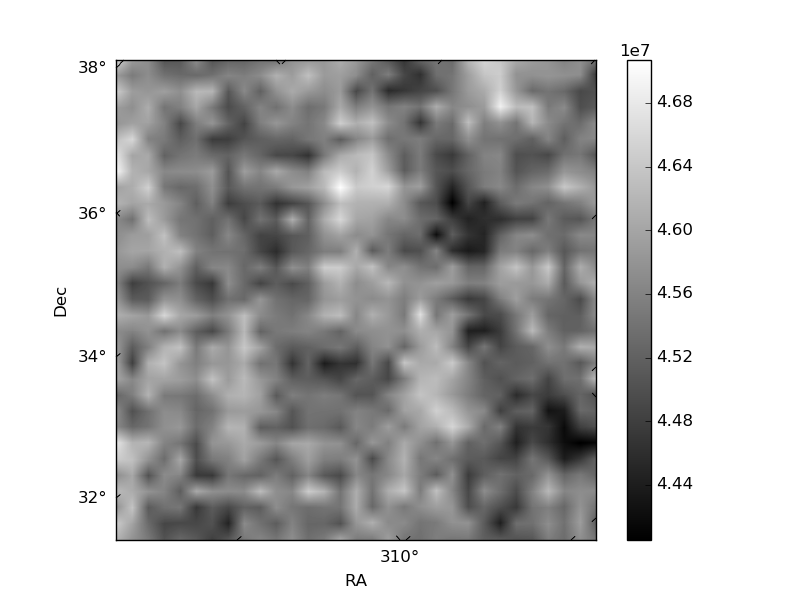
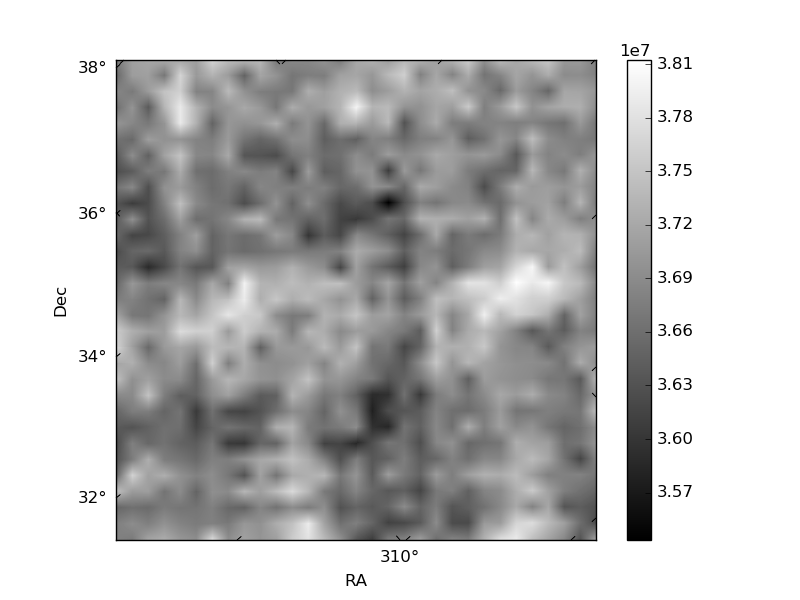
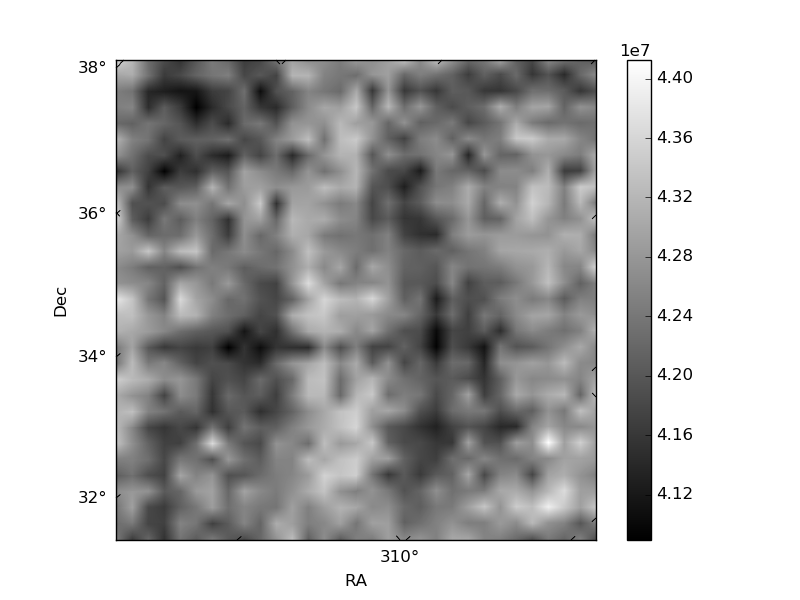
Histogram calculated using DETX and DETY for each event in the final _common_clean file
| Quadrant A |  |
 |
Quadrant B |
|---|---|---|---|
| Quadrant D |  |
 |
Quadrant C |
| Plot type | Count rate plots | Images |
|---|---|---|
| Comparison with Poisson distribution Blue bars denote a histogram of data divided into 1 sec bins. Red curve is a Poisson curve with rate = median count rate of data. |
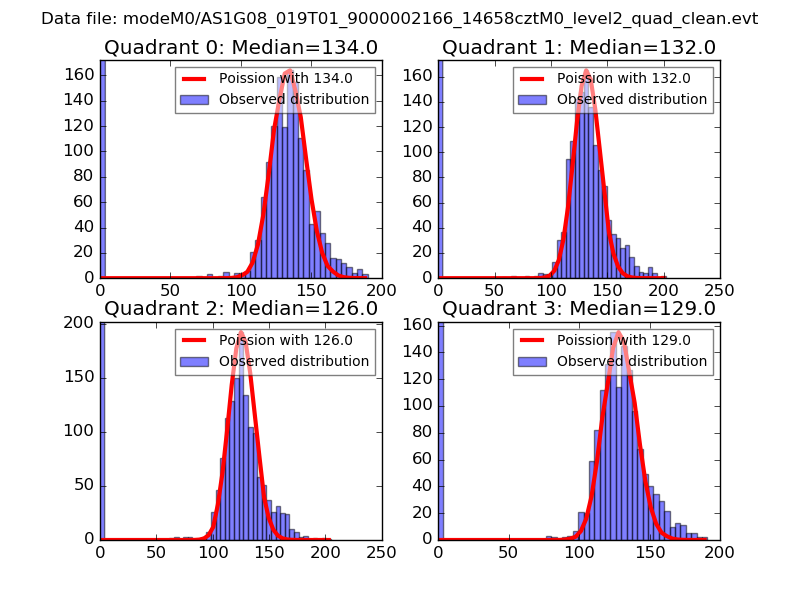 |
 |
| Quadrant-wise count rates Data is divided into 100 sec bins |
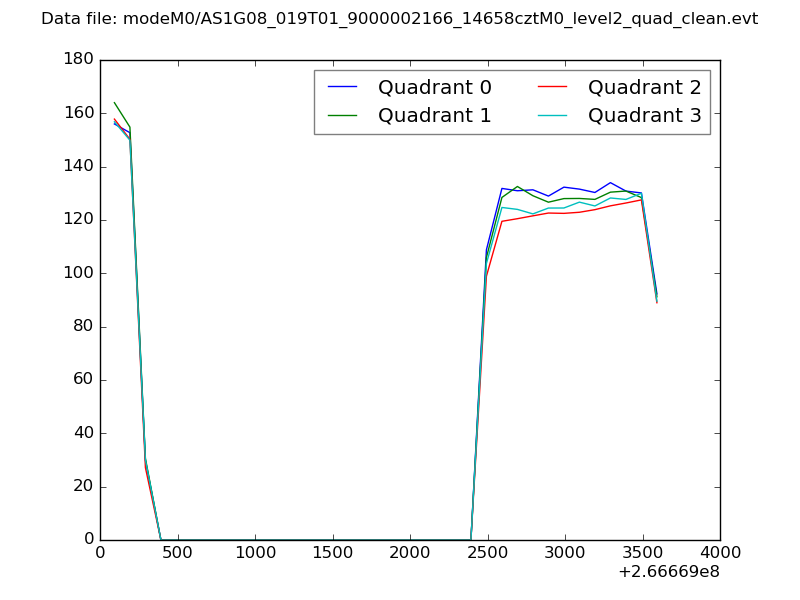 |
|
| Module-wise count rates for Quadrant A Data is divided into 100 sec bins |
 |
 |
| Module-wise count rates for Quadrant B Data is divided into 100 sec bins |
 |
 |
| Module-wise count rates for Quadrant C Data is divided into 100 sec bins |
 |
 |
| Module-wise count rates for Quadrant D Data is divided into 100 sec bins |
 |
 |
| Parameter | Plot |
|---|---|
| CZT HV Monitor |  |
| D_VDD |  |
| Temperature 1 |  |
| Veto HV Monitor |  |
| Veto LLD |  |
| Alpha Counter | 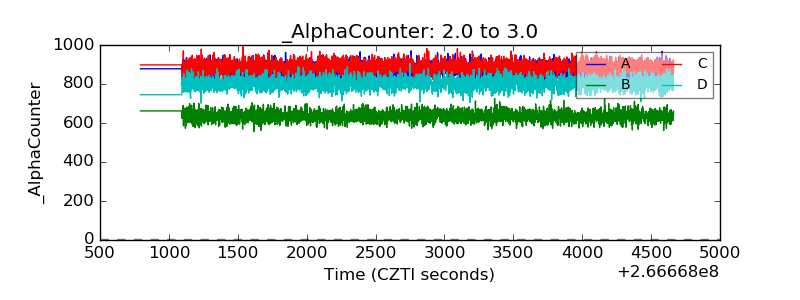 |
| _CPM_Rate | 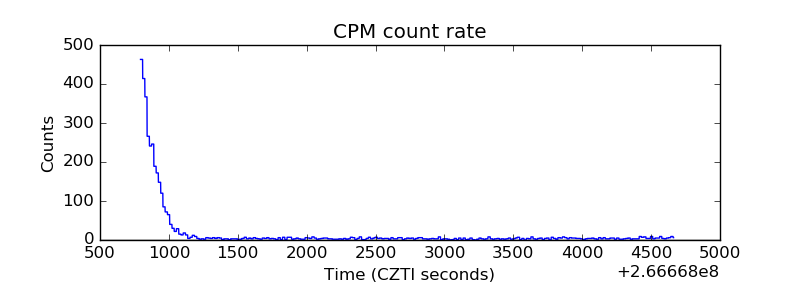 |
| CZT Counter |  |
| +2.5 Volts monitor |  |
| +5 Volts monitor |  |
| _ROLL_ROT |  |
| _Roll_DEC |  |
| _Roll_RA |  |
| Veto Counter |  |