| Param | Original file | Final file |
|---|---|---|
| Filename | modeM0/AS1G08_020T01_9000002168cztM0_level2.fits | modeM0/AS1G08_020T01_9000002168cztM0_level2_quad_clean.evt |
| Size (bytes) | 411,854,400 | 385,894,080 |
| Size | 392.8 MB | 368.0 MB |
| Events in quadrant A | 2,541,972 | 2,350,850 |
| Events in quadrant B | 2,440,754 | 2,304,148 |
| Events in quadrant C | 2,506,188 | 2,187,093 |
| Events in quadrant D | 2,218,826 | 2,078,461 |
| Mode SS | |||
|---|---|---|---|
| Quadrant | BADHDUFLAG | Total packets | Discarded packets |
| A | 0 | 820 | 0 |
| B | 0 | 820 | 0 |
| C | 0 | 820 | 0 |
| D | 0 | 820 | 0 |
| Mode M0 | |||
|---|---|---|---|
| Quadrant | BADHDUFLAG | Total packets | Discarded packets |
| A | 0 | 87292 | 0 |
| B | 0 | 87792 | 0 |
| C | 0 | 100709 | 0 |
| D | 0 | 90608 | 0 |
| Mode M9 | |||
|---|---|---|---|
| Quadrant | BADHDUFLAG | Total packets | Discarded packets |
| A | 0 | 86 | 0 |
| B | 0 | 86 | 0 |
| C | 0 | 86 | 0 |
| D | 0 | 86 | 0 |
| Quadrant | Total seconds | Saturated seconds | Saturation percentage |
|---|---|---|---|
| A | 40288 | 442 | 1.097101% |
| B | 40288 | 590 | 1.464456% |
| C | 40288 | 469 | 1.164118% |
| D | 40288 | 852 | 2.114774% |
Noise dominated data is calculated using 1-second bins in cleaned event files. If a bin has >2000 counts, and if more than 50% of those come from <1% of pixels, then it is considered to be noise-dominated and hence unusable.
| Quadrant | # 1 sec bins | Bins with >0 counts | Bins with >2000 counts | High rate bins dominated by noise | Noise dominated (total time) | Noise dominated (detector-on time) | Marked lightcurve |
|---|---|---|---|---|---|---|---|
| A | 48798 | 40283 | 0 | 0 | 0.00% | 0.00% |  |
| B | 48798 | 40282 | 0 | 0 | 0.00% | 0.00% | 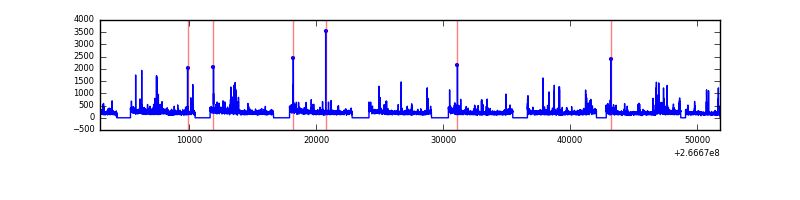 |
| C | 48798 | 40284 | 0 | 0 | 0.00% | 0.00% |  |
| D | 48798 | 40275 | 0 | 0 | 0.00% | 0.00% |  |
Top three noisy pixels from each quadrant. If the there are fewer than three noisy pixels in the level2.evt file, extra rows are filled as -1
| Pixel properties | Quadrant properties | ||||||
|---|---|---|---|---|---|---|---|
| Quadrant | DetID | PixID | Counts | Sigma | Mean | Median | Sigma |
| A | 0 | 29 | 2335 | 10.29 | 662 | 621 | 166.6 |
| A | 9 | 19 | 2059 | 8.63 | 662 | 621 | 166.6 |
| A | 7 | 110 | 1981 | 8.16 | 662 | 621 | 166.6 |
| B | 2 | 9 | 2047 | 11.08 | 645 | 616 | 129.1 |
| B | 3 | 17 | 1688 | 8.3 | 645 | 616 | 129.1 |
| B | 14 | 254 | 1556 | 7.28 | 645 | 616 | 129.1 |
| C | 12 | 241 | 1715 | 6.4 | 663 | 621 | 170.9 |
| C | 2 | 191 | 1708 | 6.36 | 663 | 621 | 170.9 |
| C | 3 | 126 | 1672 | 6.15 | 663 | 621 | 170.9 |
| D | 6 | 231 | 1755 | 6.97 | 631 | 575 | 169.3 |
| D | 3 | 14 | 1570 | 5.88 | 631 | 575 | 169.3 |
| D | 6 | 67 | 1534 | 5.66 | 631 | 575 | 169.3 |
Histogram calculated using DETX and DETY for each event in the final _common_clean file
| Quadrant A | 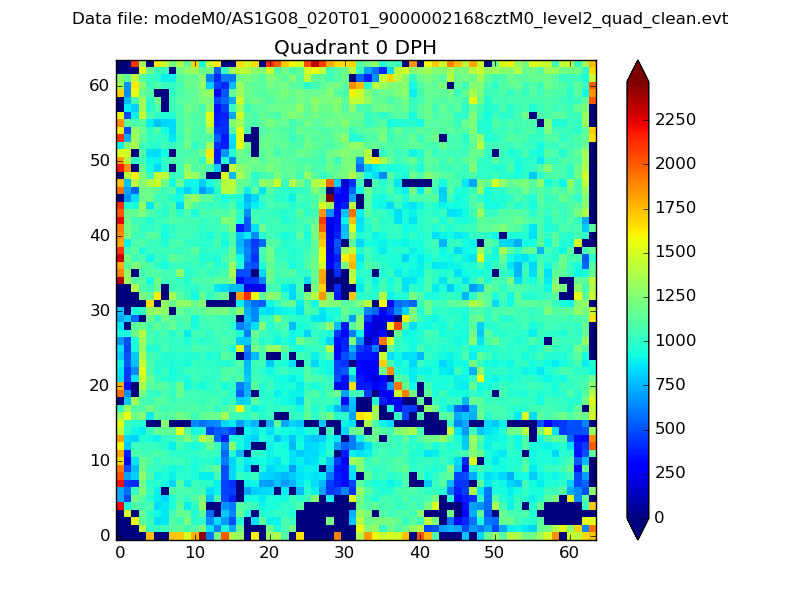 |
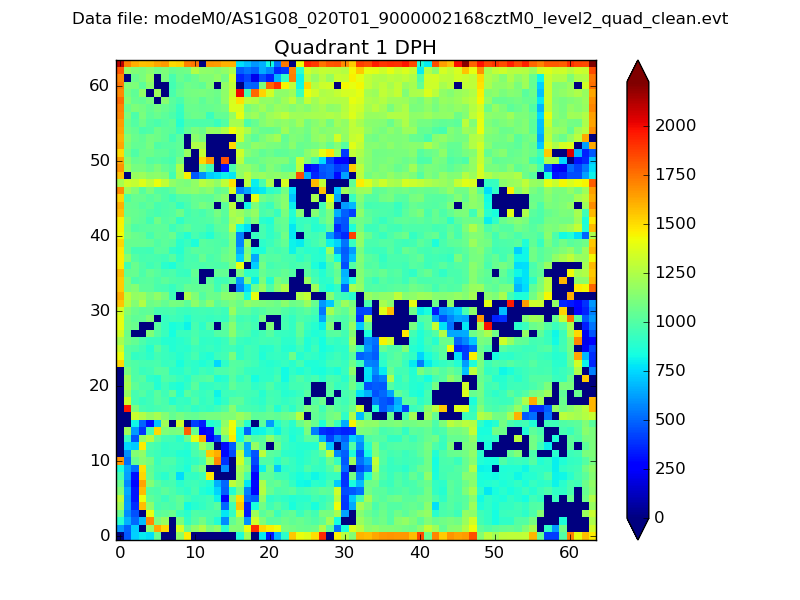 |
Quadrant B |
|---|---|---|---|
| Quadrant D | 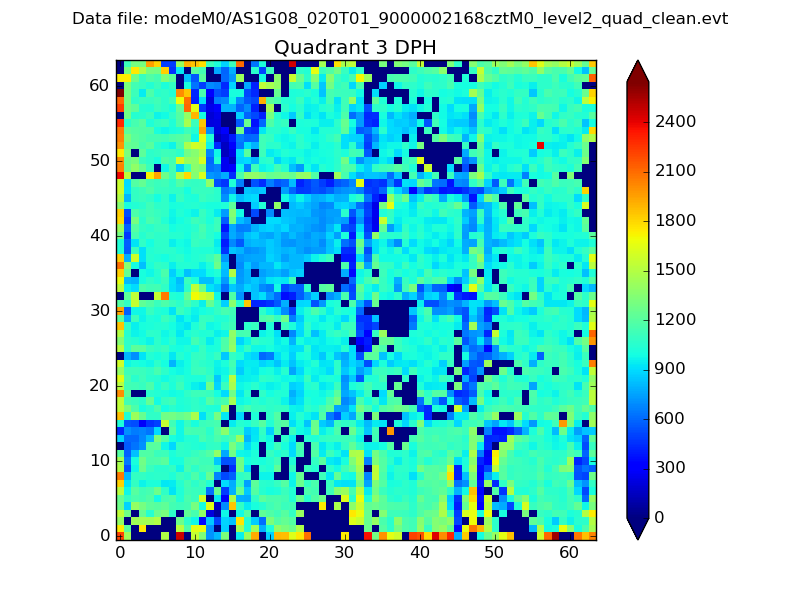 |
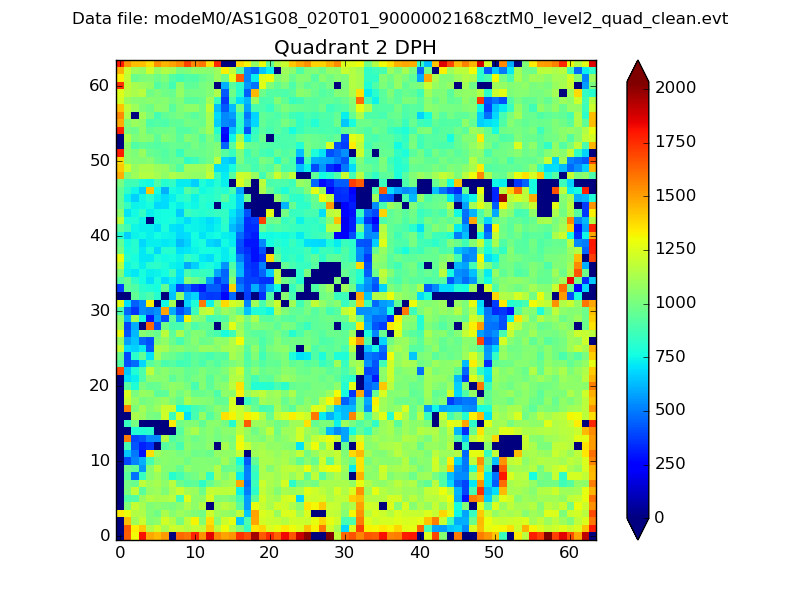 |
Quadrant C |
| Plot type | Count rate plots | Images |
|---|---|---|
| Comparison with Poisson distribution Blue bars denote a histogram of data divided into 1 sec bins. Red curve is a Poisson curve with rate = median count rate of data. |
 |
 |
| Quadrant-wise count rates Data is divided into 100 sec bins |
 |
|
| Module-wise count rates for Quadrant A Data is divided into 100 sec bins |
 |
 |
| Module-wise count rates for Quadrant B Data is divided into 100 sec bins |
 |
 |
| Module-wise count rates for Quadrant C Data is divided into 100 sec bins |
 |
 |
| Module-wise count rates for Quadrant D Data is divided into 100 sec bins |
 |
 |
| Parameter | Plot |
|---|---|
| CZT HV Monitor | 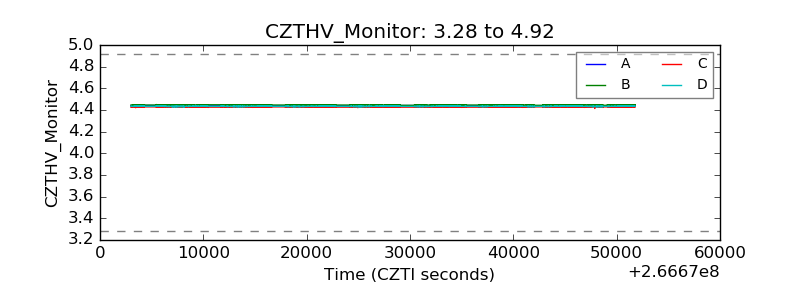 |
| D_VDD | 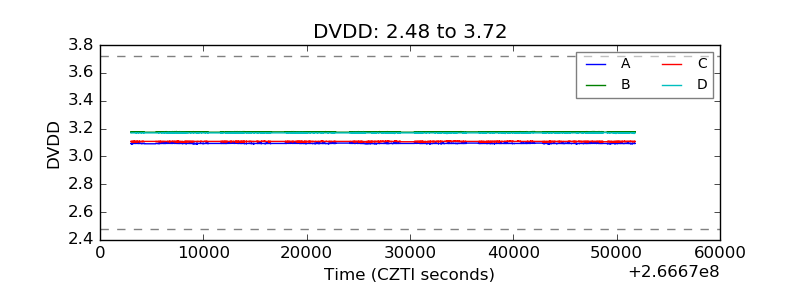 |
| Temperature 1 | 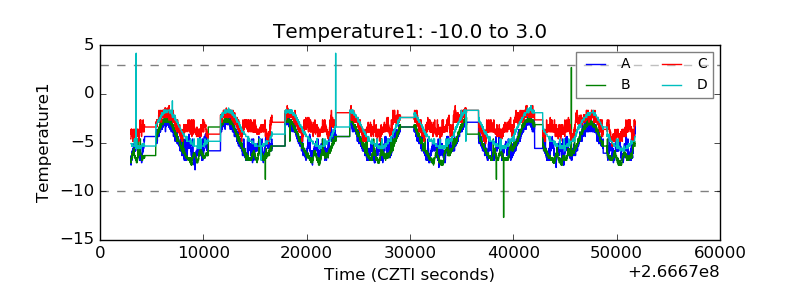 |
| Veto HV Monitor |  |
| Veto LLD |  |
| Alpha Counter |  |
| _CPM_Rate |  |
| CZT Counter | 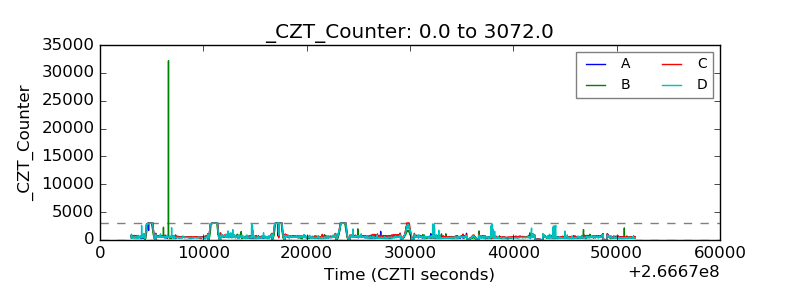 |
| +2.5 Volts monitor |  |
| +5 Volts monitor |  |
| _ROLL_ROT | 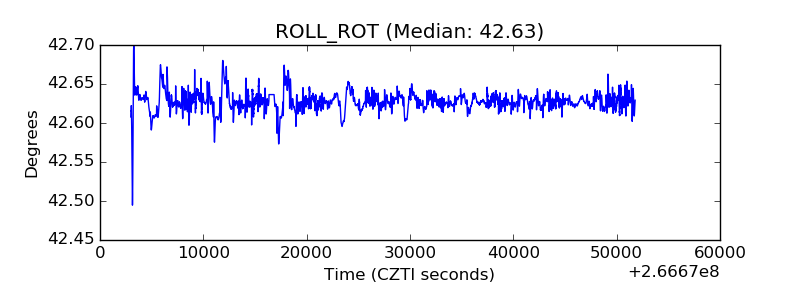 |
| _Roll_DEC |  |
| _Roll_RA | 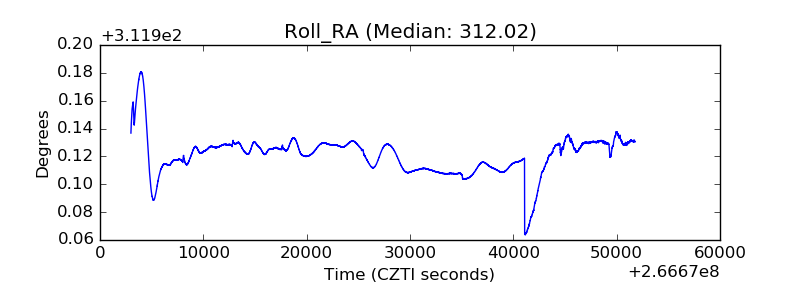 |
| Veto Counter | 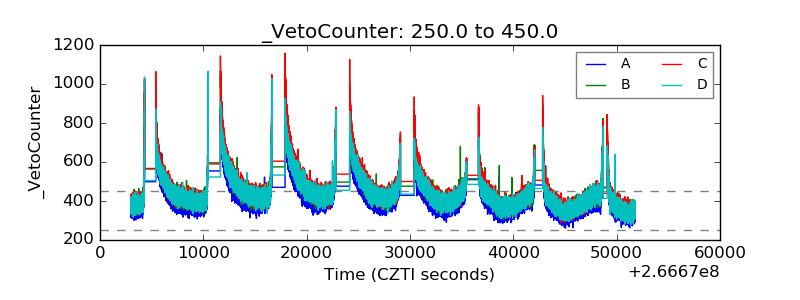 |