| Param | Original file | Final file |
|---|---|---|
| Filename | modeM0/AS1G08_020T01_9000002168_14660cztM0_level2.evt | modeM0/AS1G08_020T01_9000002168_14660cztM0_level2_quad_clean.evt |
| Size (bytes) | 494,277,120 | 69,845,760 |
| Size | 471.4 MB | 66.6 MB |
| Events in quadrant A | 3,421,214 | 426,282 |
| Events in quadrant B | 3,487,873 | 418,969 |
| Events in quadrant C | 4,085,859 | 408,595 |
| Events in quadrant D | 3,539,620 | 414,048 |
| Mode SS | |||
|---|---|---|---|
| Quadrant | BADHDUFLAG | Total packets | Discarded packets |
| A | 0 | 130 | 0 |
| B | 0 | 130 | 0 |
| C | 0 | 130 | 0 |
| D | 0 | 130 | 0 |
| Mode M0 | |||
|---|---|---|---|
| Quadrant | BADHDUFLAG | Total packets | Discarded packets |
| A | 0 | 14249 | 3 |
| B | 0 | 14518 | 2 |
| C | 0 | 16833 | 2 |
| D | 0 | 14768 | 2 |
| Mode M9 | |||
|---|---|---|---|
| Quadrant | BADHDUFLAG | Total packets | Discarded packets |
| A | 0 | 14 | 0 |
| B | 0 | 14 | 0 |
| C | 0 | 14 | 0 |
| D | 0 | 15 | 0 |
| Quadrant | Total seconds | Saturated seconds | Saturation percentage |
|---|---|---|---|
| A | 6406 | 81 | 1.264440% |
| B | 6406 | 100 | 1.561037% |
| C | 6406 | 72 | 1.123946% |
| D | 6406 | 128 | 1.998127% |
Noise dominated data is calculated using 1-second bins in cleaned event files. If a bin has >2000 counts, and if more than 50% of those come from <1% of pixels, then it is considered to be noise-dominated and hence unusable.
| Quadrant | # 1 sec bins | Bins with >0 counts | Bins with >2000 counts | High rate bins dominated by noise | Noise dominated (total time) | Noise dominated (detector-on time) | Marked lightcurve |
|---|---|---|---|---|---|---|---|
| A | 7592 | 6407 | 0 | 0 | 0.00% | 0.00% | 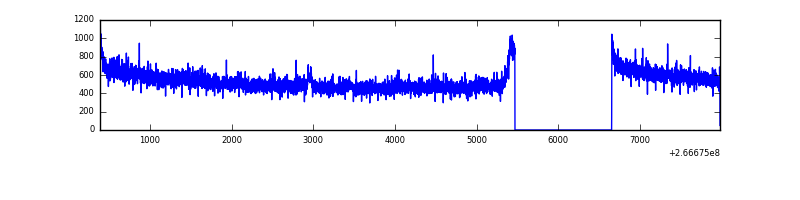 |
| B | 7592 | 6407 | 9 | 9 | 0.12% | 0.14% | 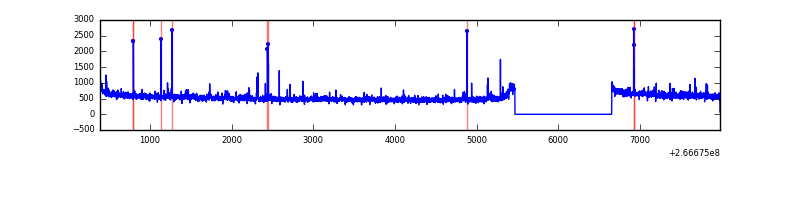 |
| C | 7592 | 6407 | 1 | 1 | 0.01% | 0.02% | 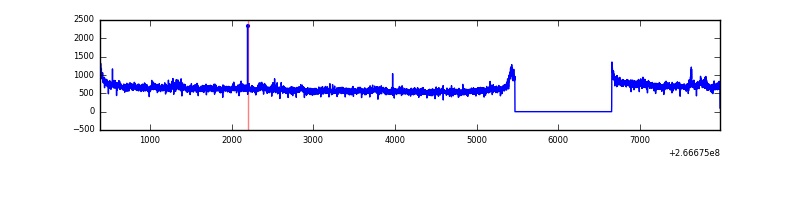 |
| D | 7592 | 6407 | 54 | 54 | 0.71% | 0.84% | 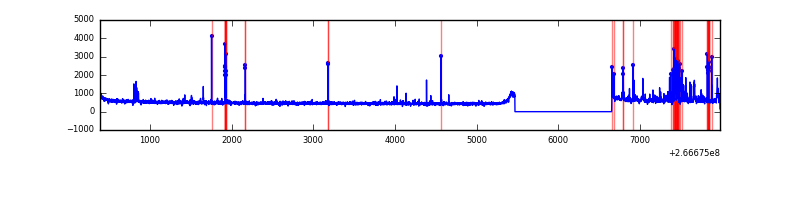 |
Top three noisy pixels from each quadrant. If the there are fewer than three noisy pixels in the level2.evt file, extra rows are filled as -1
| Pixel properties | Quadrant properties | ||||||
|---|---|---|---|---|---|---|---|
| Quadrant | DetID | PixID | Counts | Sigma | Mean | Median | Sigma |
| A | 0 | 23 | 38910 | 220.5 | 862 | 844 | 172.6 |
| A | 1 | 162 | 28095 | 157.85 | 862 | 844 | 172.6 |
| A | 8 | 15 | 21899 | 121.96 | 862 | 844 | 172.6 |
| B | 0 | 214 | 32716 | 197.0 | 854 | 834 | 161.8 |
| B | 4 | 80 | 24624 | 147.0 | 854 | 834 | 161.8 |
| B | 0 | 205 | 21299 | 126.45 | 854 | 834 | 161.8 |
| C | 3 | 233 | 845781 | 4467.31 | 829 | 835 | 189.1 |
| C | 3 | 234 | 6167 | 28.19 | 829 | 835 | 189.1 |
| C | 13 | 61 | 5998 | 27.3 | 829 | 835 | 189.1 |
| D | 5 | 222 | 147156 | 741.23 | 836 | 818 | 197.4 |
| D | 12 | 110 | 48040 | 239.19 | 836 | 818 | 197.4 |
| D | 13 | 172 | 43752 | 217.47 | 836 | 818 | 197.4 |
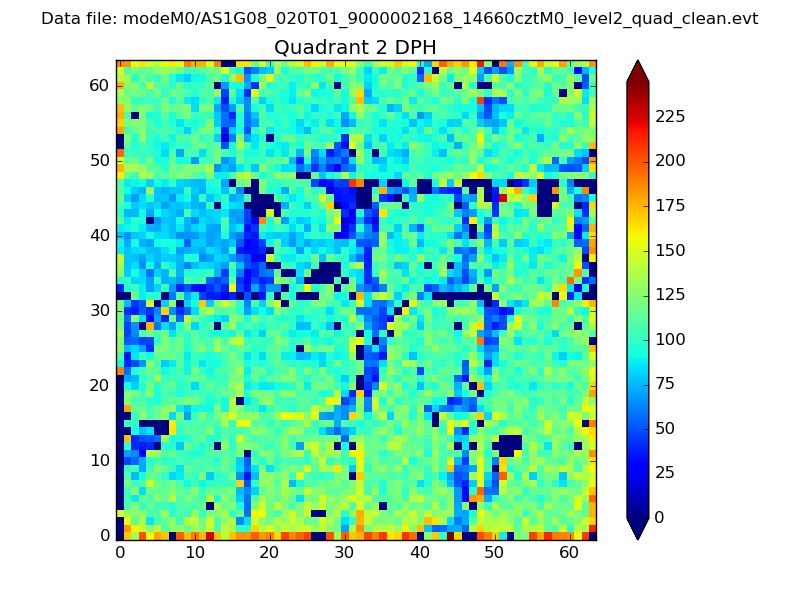
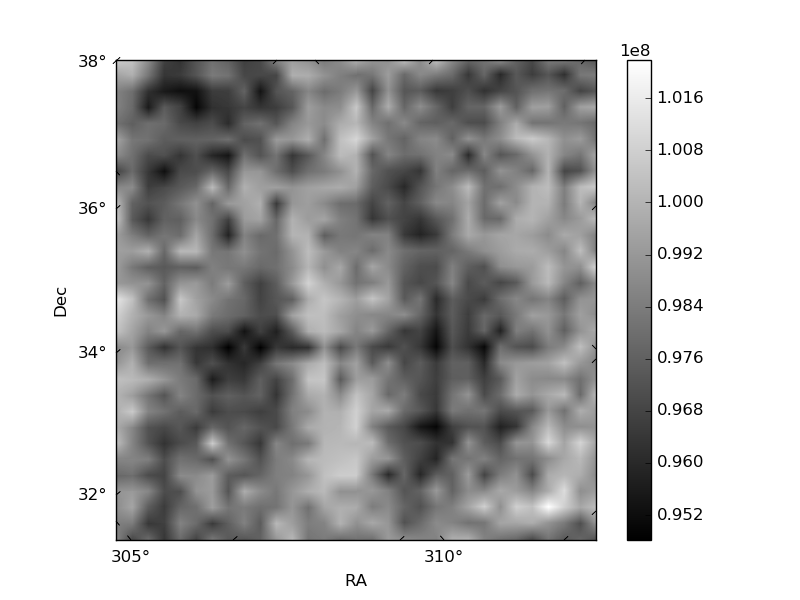
Histogram calculated using DETX and DETY for each event in the final _common_clean file
| Quadrant A | 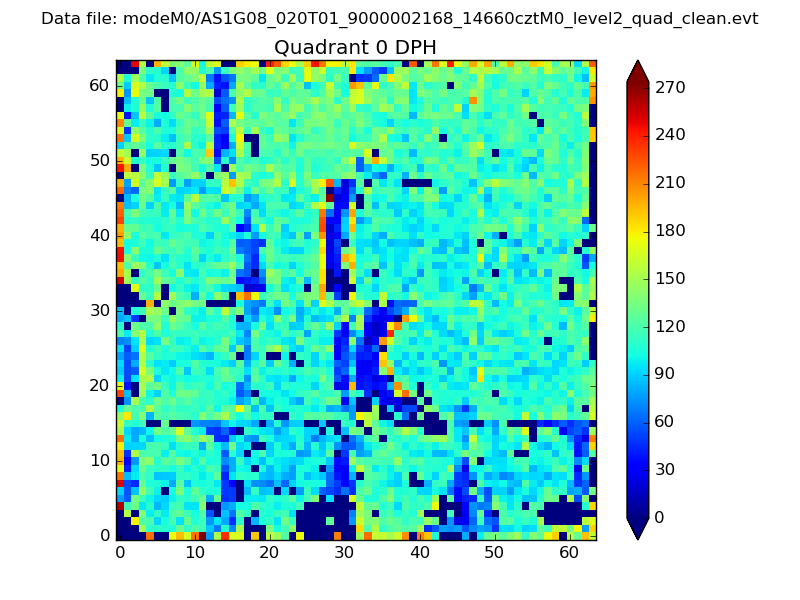 |
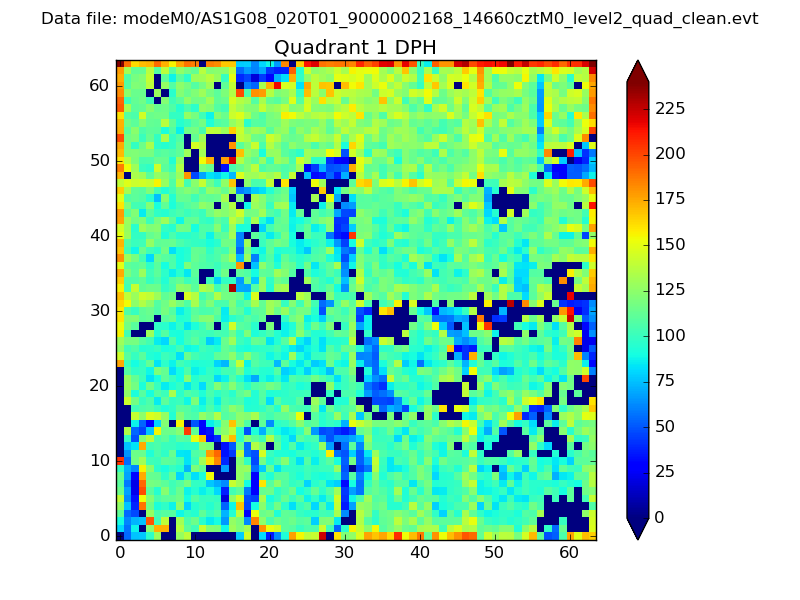 |
Quadrant B |
|---|---|---|---|
| Quadrant D | 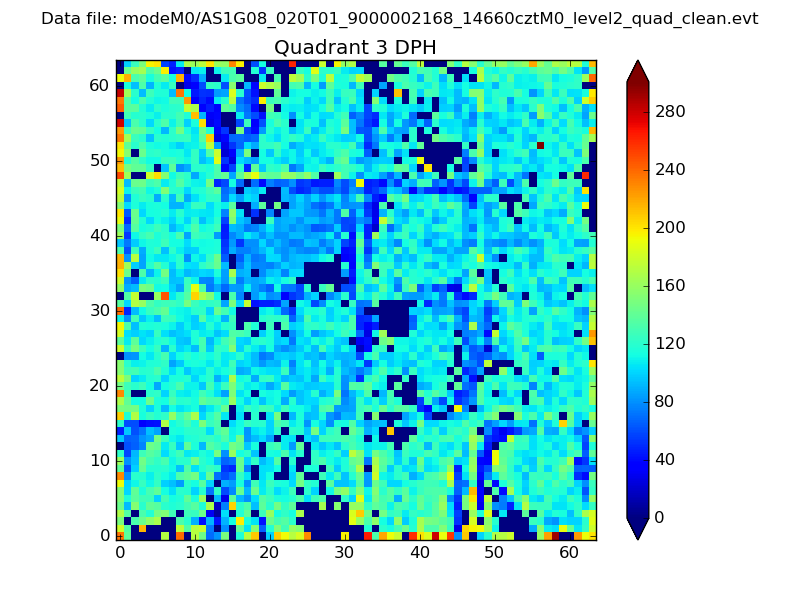 |
 |
Quadrant C |
| Plot type | Count rate plots | Images |
|---|---|---|
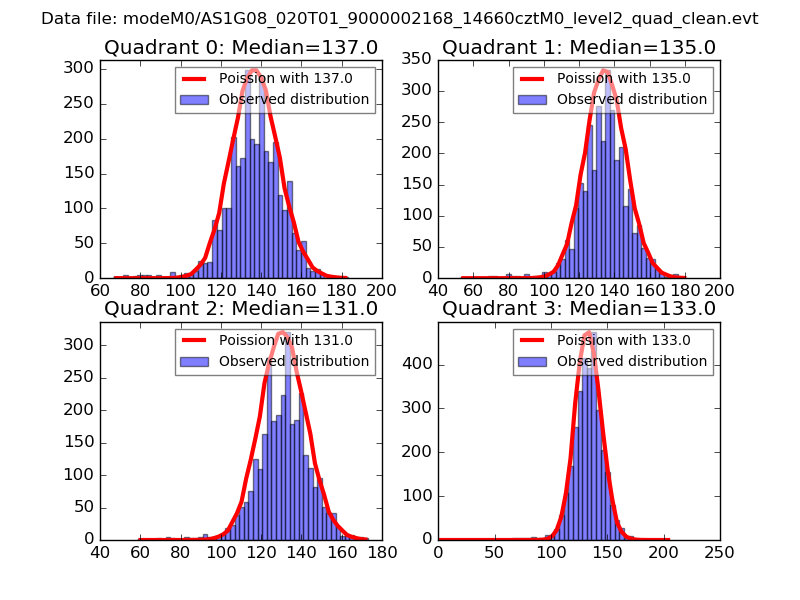
| Comparison with Poisson distribution Blue bars denote a histogram of data divided into 1 sec bins. Red curve is a Poisson curve with rate = median count rate of data. |
 |
 |
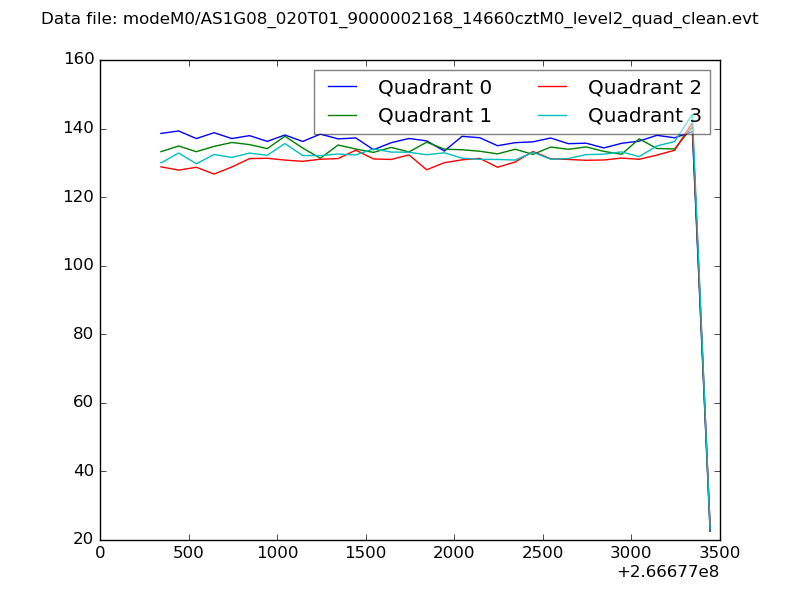
| Quadrant-wise count rates Data is divided into 100 sec bins |
 |
|
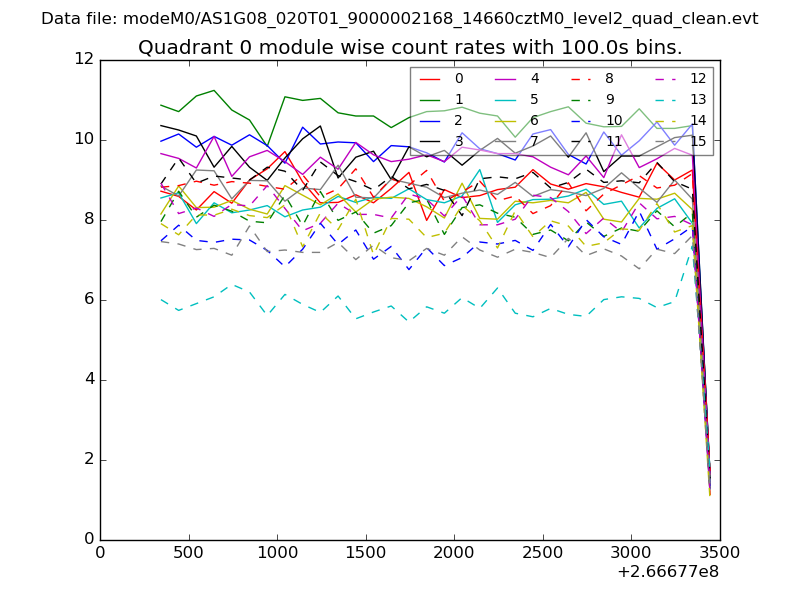
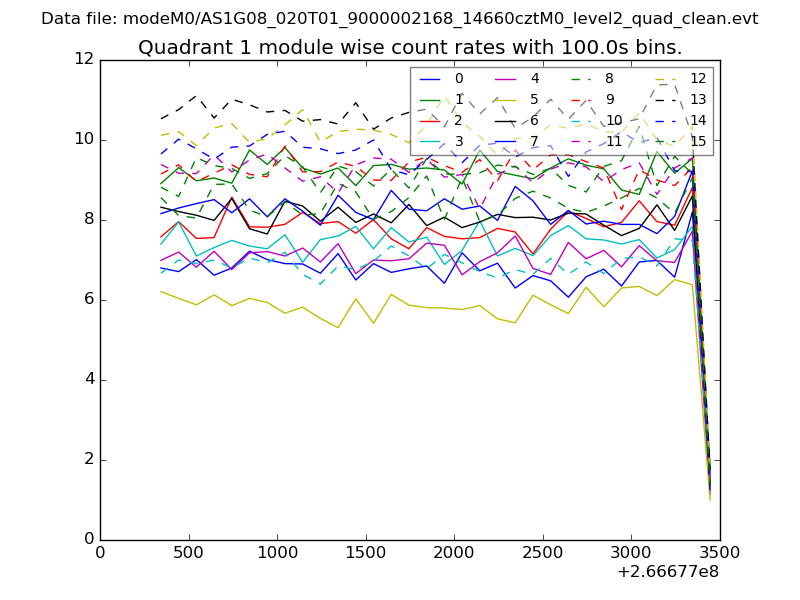
| Module-wise count rates for Quadrant A Data is divided into 100 sec bins |
 |
 |
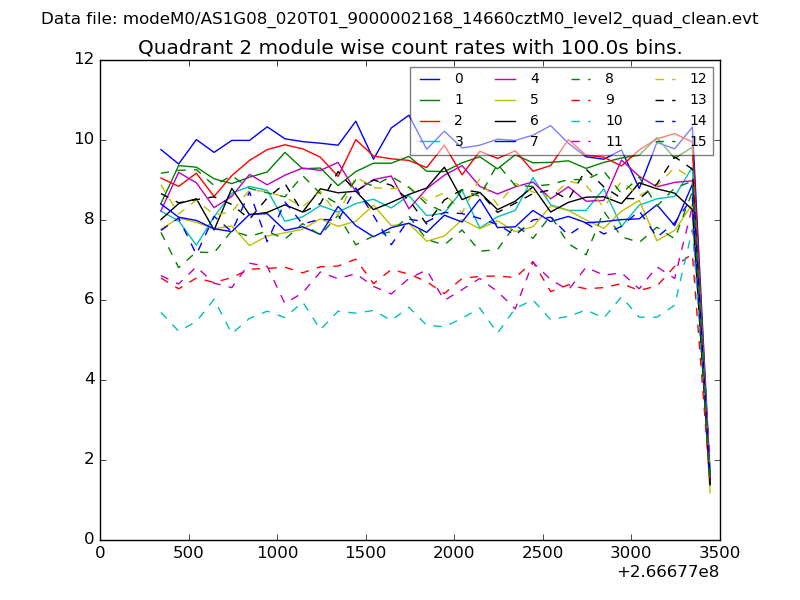
| Module-wise count rates for Quadrant B Data is divided into 100 sec bins |
 |
 |
| Module-wise count rates for Quadrant C Data is divided into 100 sec bins |
 |
 |
| Module-wise count rates for Quadrant D Data is divided into 100 sec bins |
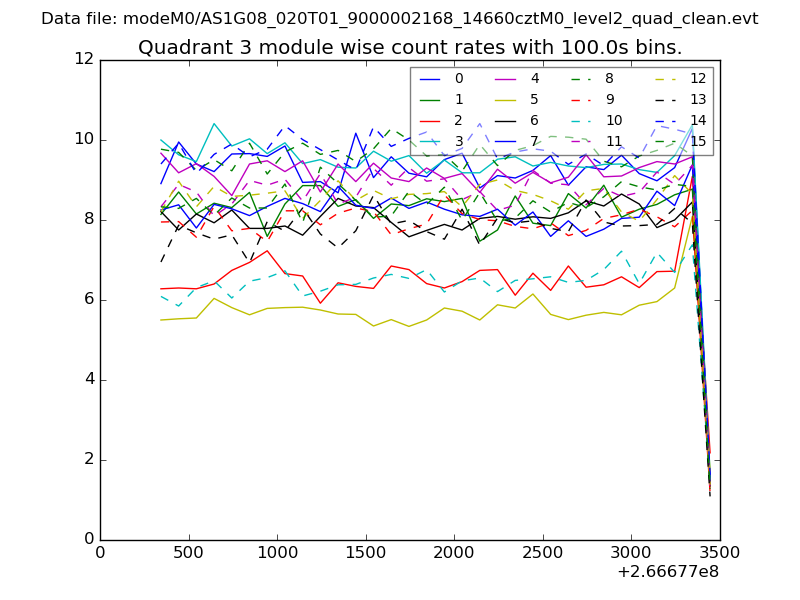 |
 |
| Parameter | Plot |
|---|---|
| CZT HV Monitor | 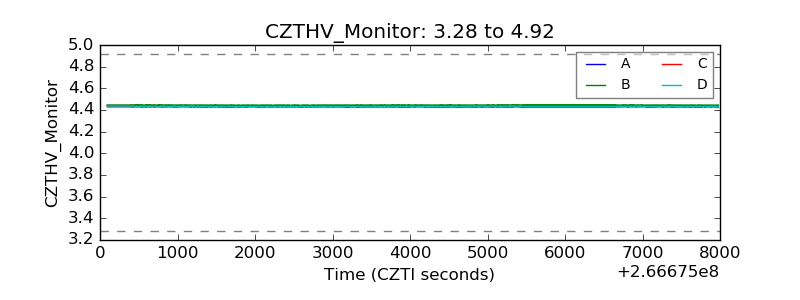 |
| D_VDD | 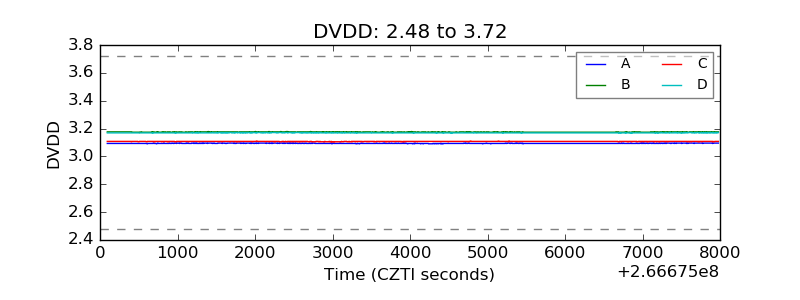 |
| Temperature 1 | 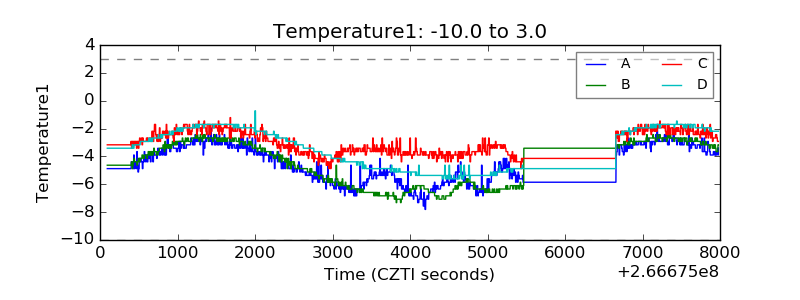 |
| Veto HV Monitor | 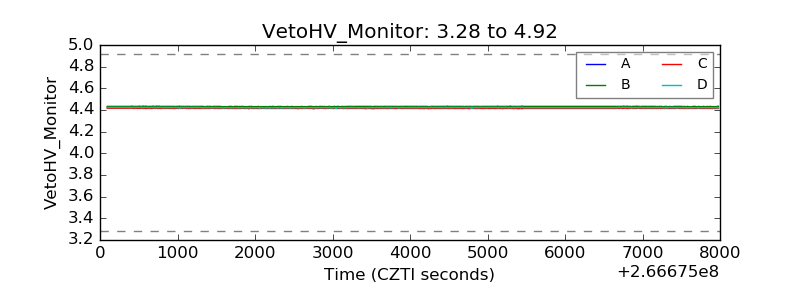 |
| Veto LLD | 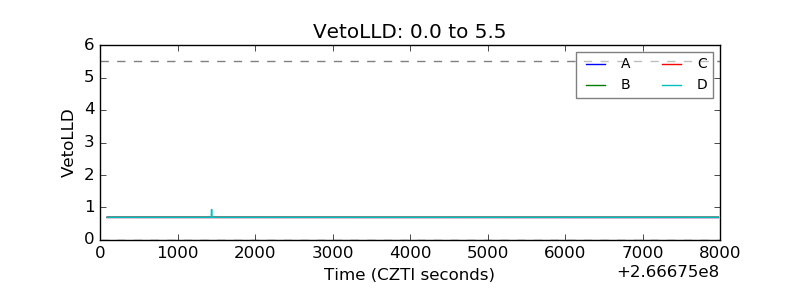 |
| Alpha Counter | 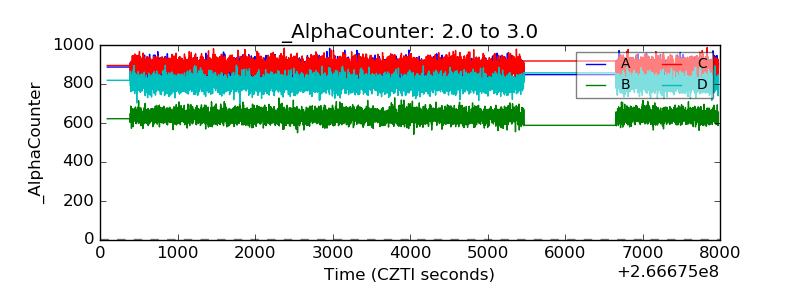 |
| _CPM_Rate | 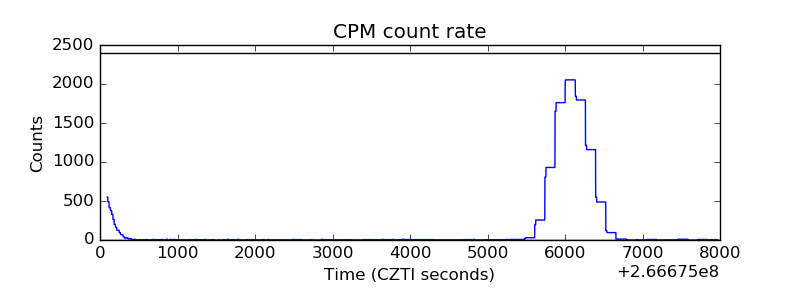 |
| CZT Counter | 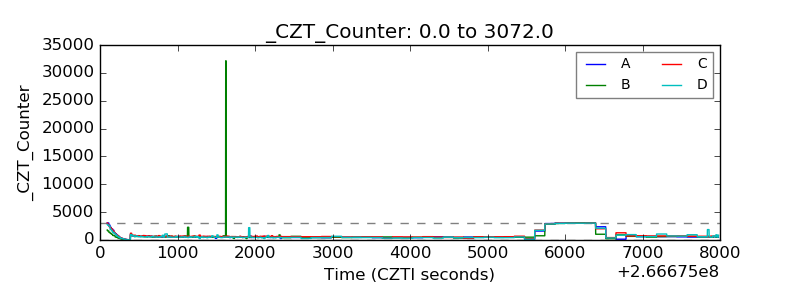 |
| +2.5 Volts monitor |  |
| +5 Volts monitor |  |
| _ROLL_ROT | 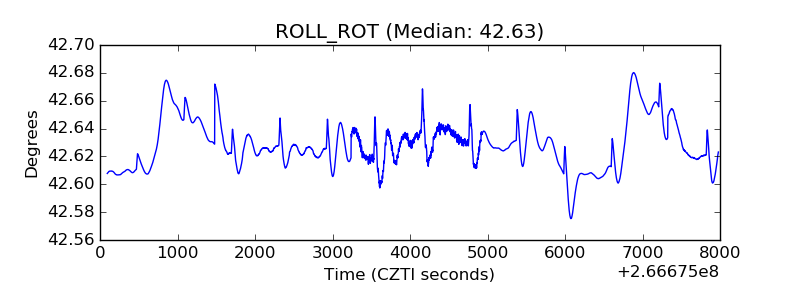 |
| _Roll_DEC | 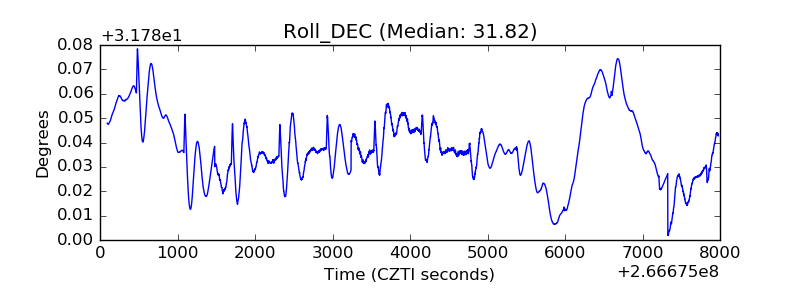 |
| _Roll_RA | 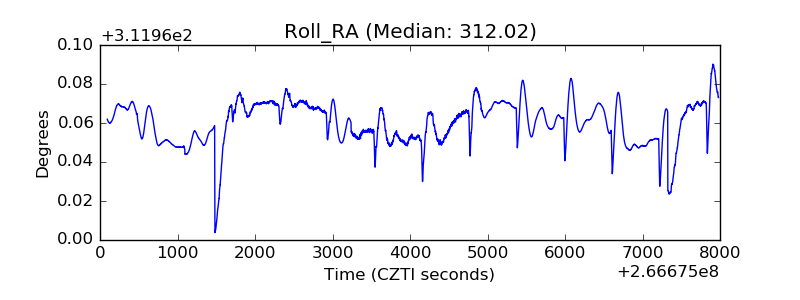 |
| Veto Counter | 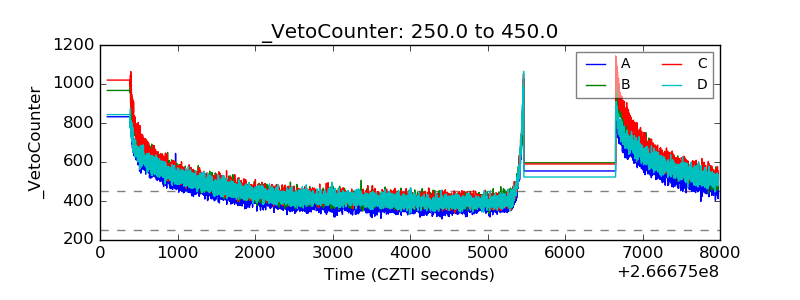 |