| Param | Original file | Final file |
|---|---|---|
| Filename | modeM0/AS1G08_020T01_9000002168_14663cztM0_level2.evt | modeM0/AS1G08_020T01_9000002168_14663cztM0_level2_quad_clean.evt |
| Size (bytes) | 510,828,480 | 104,610,240 |
| Size | 487.2 MB | 99.8 MB |
| Events in quadrant A | 3,513,816 | 683,384 |
| Events in quadrant B | 3,469,473 | 689,776 |
| Events in quadrant C | 4,630,269 | 672,691 |
| Events in quadrant D | 3,418,443 | 671,478 |
| Mode SS | |||
|---|---|---|---|
| Quadrant | BADHDUFLAG | Total packets | Discarded packets |
| A | 0 | 134 | 0 |
| B | 0 | 134 | 0 |
| C | 0 | 134 | 0 |
| D | 0 | 134 | 0 |
| Mode M0 | |||
|---|---|---|---|
| Quadrant | BADHDUFLAG | Total packets | Discarded packets |
| A | 0 | 14653 | 3 |
| B | 0 | 14407 | 2 |
| C | 0 | 18967 | 2 |
| D | 0 | 14408 | 2 |
| Mode M9 | |||
|---|---|---|---|
| Quadrant | BADHDUFLAG | Total packets | Discarded packets |
| A | 0 | 27 | 0 |
| B | 0 | 27 | 0 |
| C | 0 | 27 | 0 |
| D | 0 | 27 | 0 |
| Quadrant | Total seconds | Saturated seconds | Saturation percentage |
|---|---|---|---|
| A | 6462 | 130 | 2.011761% |
| B | 6462 | 138 | 2.135562% |
| C | 6462 | 159 | 2.460539% |
| D | 6462 | 115 | 1.779635% |
Noise dominated data is calculated using 1-second bins in cleaned event files. If a bin has >2000 counts, and if more than 50% of those come from <1% of pixels, then it is considered to be noise-dominated and hence unusable.
| Quadrant | # 1 sec bins | Bins with >0 counts | Bins with >2000 counts | High rate bins dominated by noise | Noise dominated (total time) | Noise dominated (detector-on time) | Marked lightcurve |
|---|---|---|---|---|---|---|---|
| A | 9128 | 6464 | 1 | 1 | 0.01% | 0.02% | 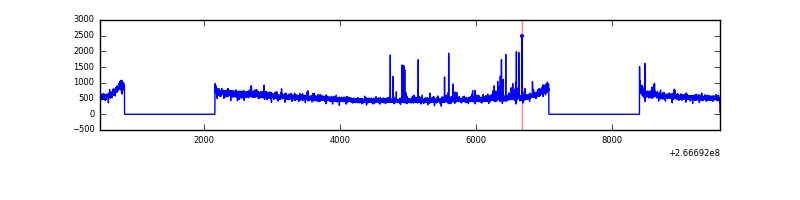 |
| B | 9128 | 6463 | 1 | 1 | 0.01% | 0.02% | 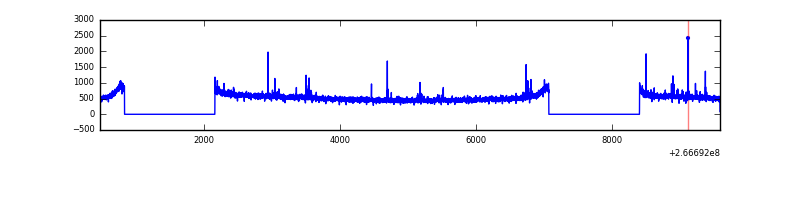 |
| C | 9128 | 6463 | 3 | 3 | 0.03% | 0.05% | 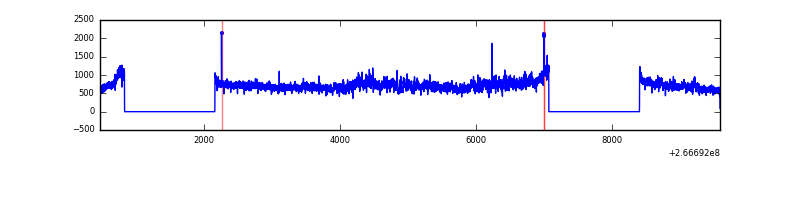 |
| D | 9128 | 6464 | 12 | 12 | 0.13% | 0.19% | 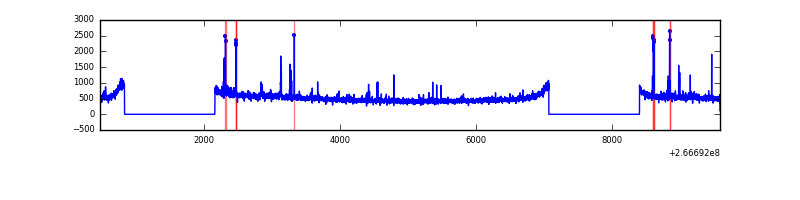 |
Top three noisy pixels from each quadrant. If the there are fewer than three noisy pixels in the level2.evt file, extra rows are filled as -1
| Pixel properties | Quadrant properties | ||||||
|---|---|---|---|---|---|---|---|
| Quadrant | DetID | PixID | Counts | Sigma | Mean | Median | Sigma |
| A | 1 | 162 | 44072 | 246.06 | 871 | 854 | 175.6 |
| A | 8 | 15 | 43561 | 243.15 | 871 | 854 | 175.6 |
| A | 0 | 253 | 30594 | 169.32 | 871 | 854 | 175.6 |
| B | 12 | 111 | 18944 | 109.9 | 871 | 851 | 164.6 |
| B | 11 | 111 | 15991 | 91.97 | 871 | 851 | 164.6 |
| B | 4 | 80 | 15851 | 91.12 | 871 | 851 | 164.6 |
| C | 3 | 233 | 1272576 | 6454.72 | 858 | 865 | 197.0 |
| C | 13 | 61 | 6146 | 26.8 | 858 | 865 | 197.0 |
| C | 3 | 234 | 5485 | 23.45 | 858 | 865 | 197.0 |
| D | 5 | 222 | 48558 | 217.29 | 860 | 841 | 219.6 |
| D | 10 | 70 | 48336 | 216.27 | 860 | 841 | 219.6 |
| D | 13 | 172 | 30621 | 135.61 | 860 | 841 | 219.6 |
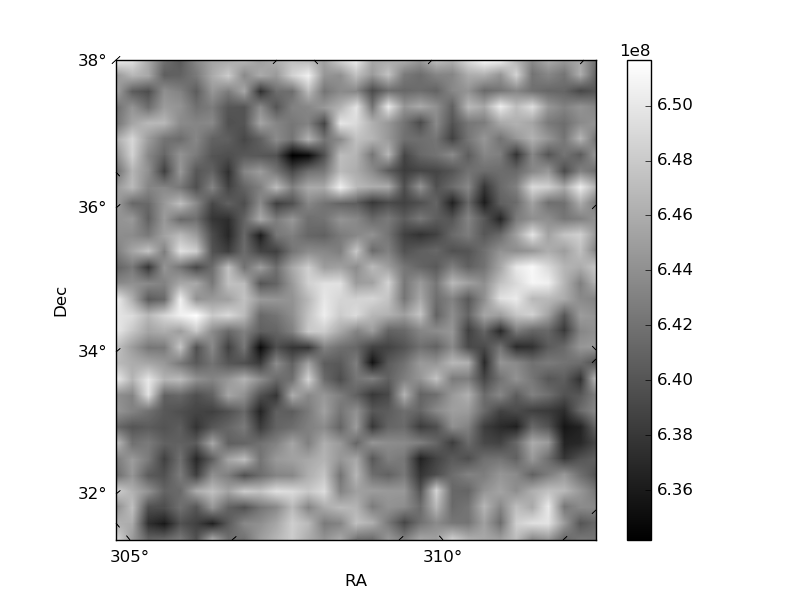
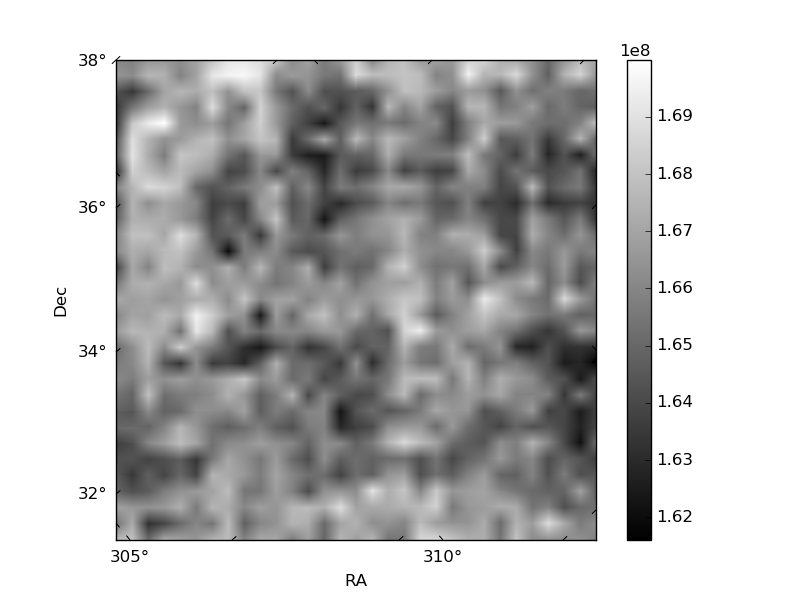
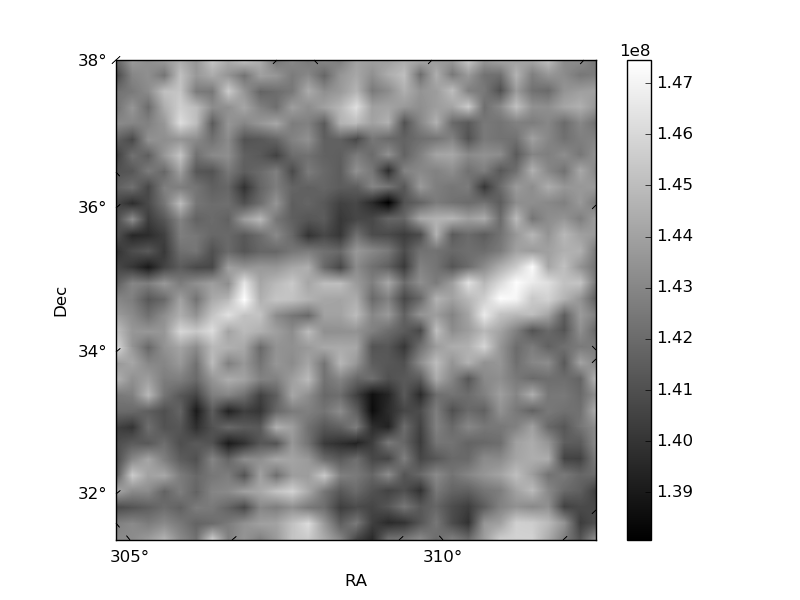
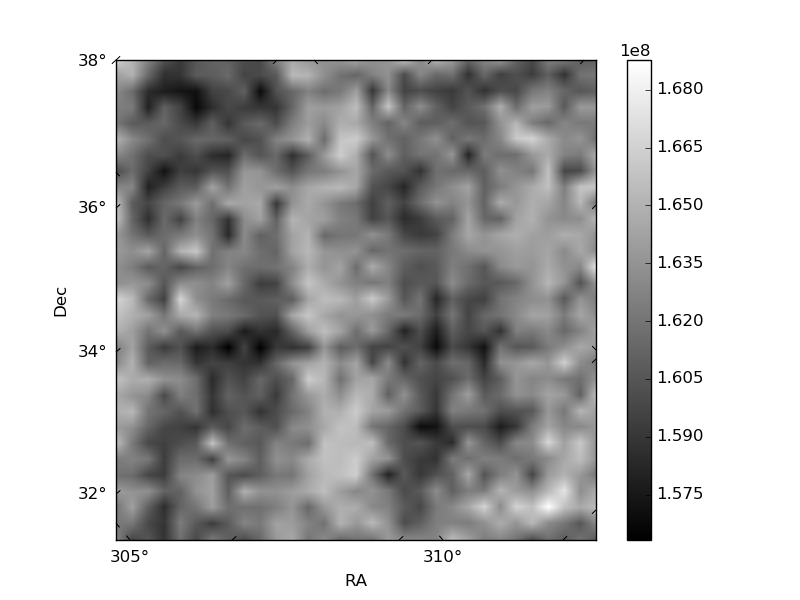
Histogram calculated using DETX and DETY for each event in the final _common_clean file
| Quadrant A | 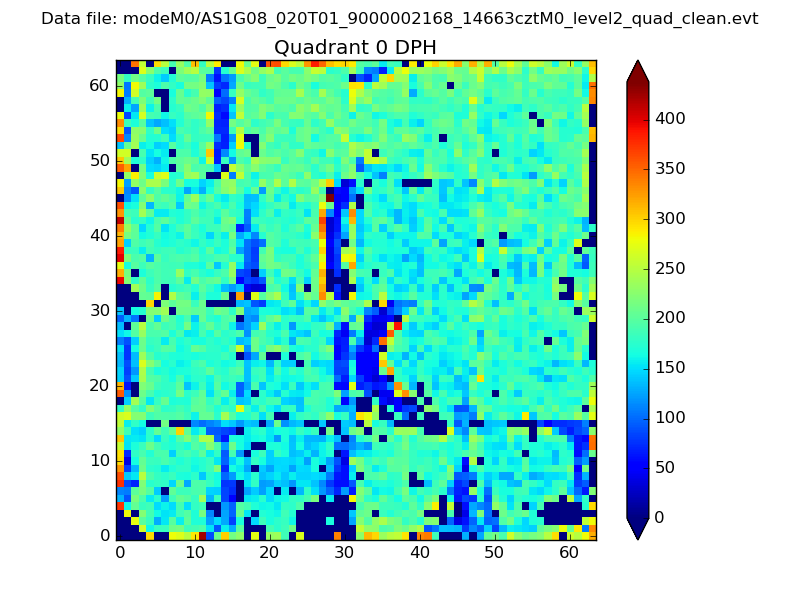 |
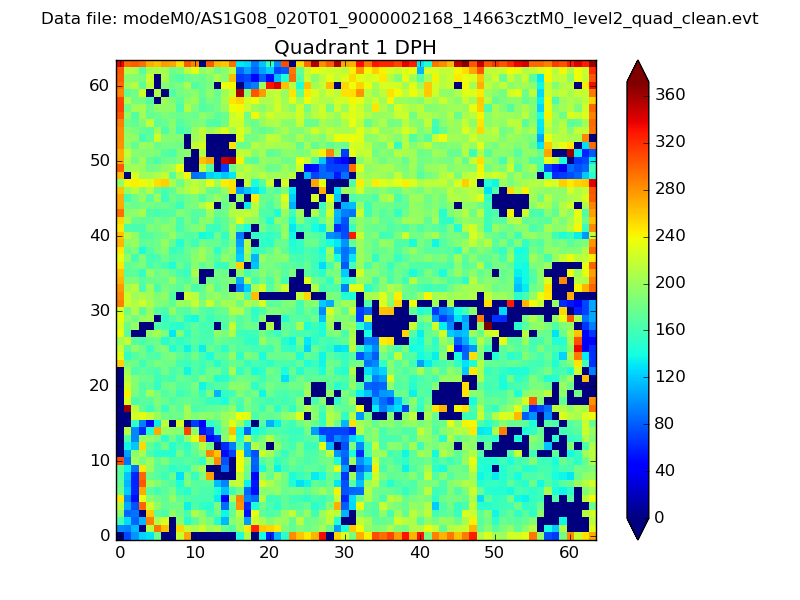 |
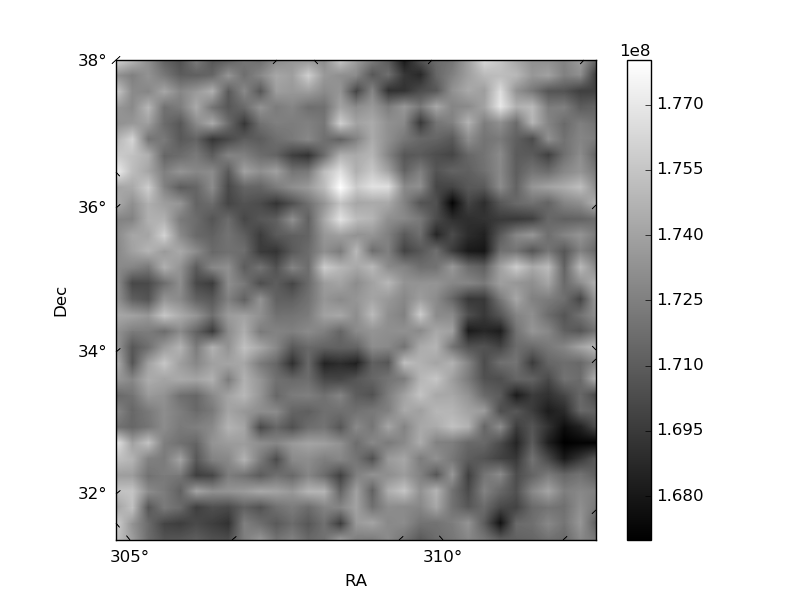
Quadrant B |
|---|---|---|---|
| Quadrant D | 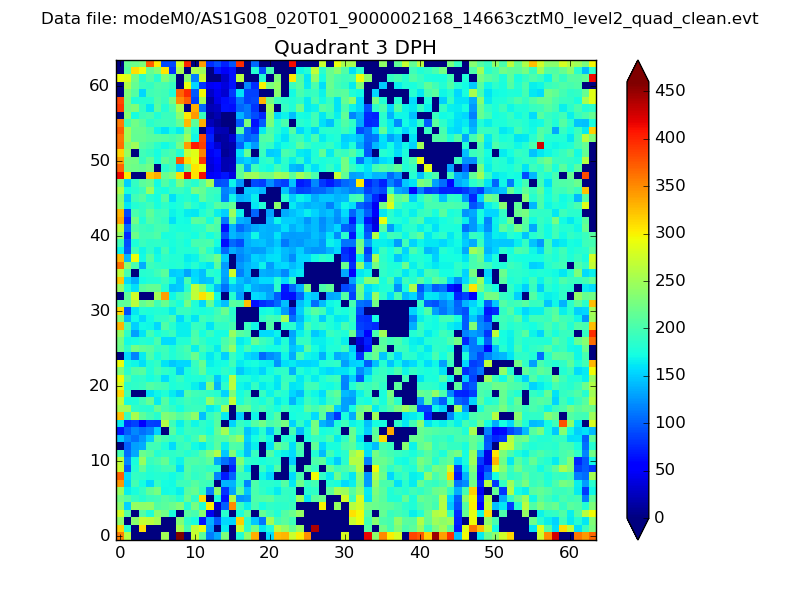 |
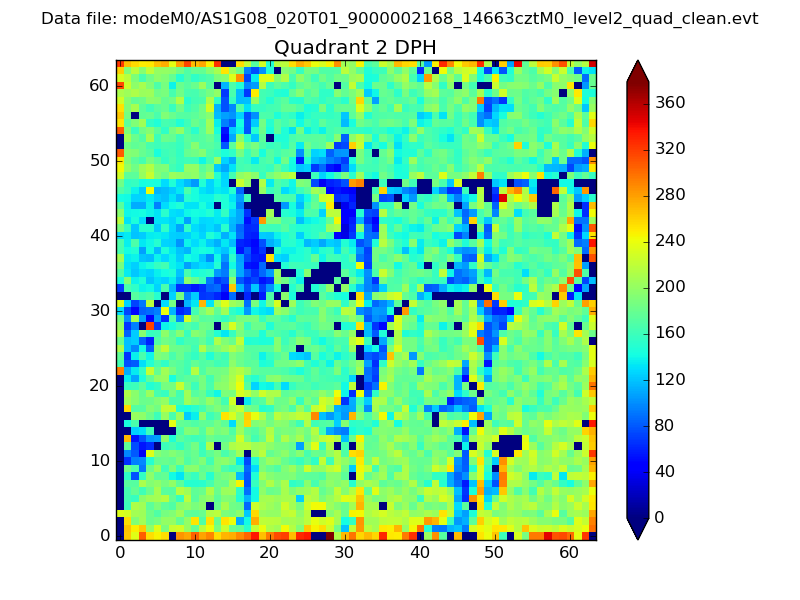 |
Quadrant C |
| Plot type | Count rate plots | Images |
|---|---|---|
| Comparison with Poisson distribution Blue bars denote a histogram of data divided into 1 sec bins. Red curve is a Poisson curve with rate = median count rate of data. |
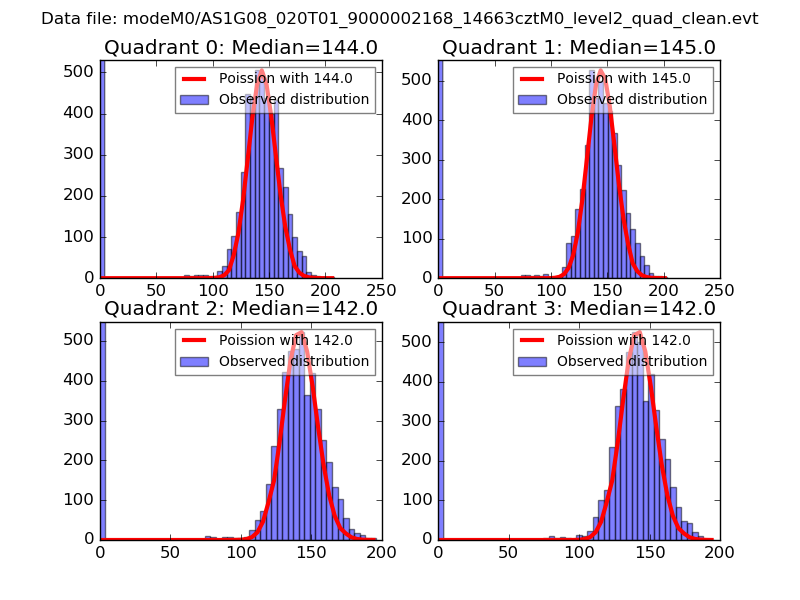 |
 |
| Quadrant-wise count rates Data is divided into 100 sec bins |
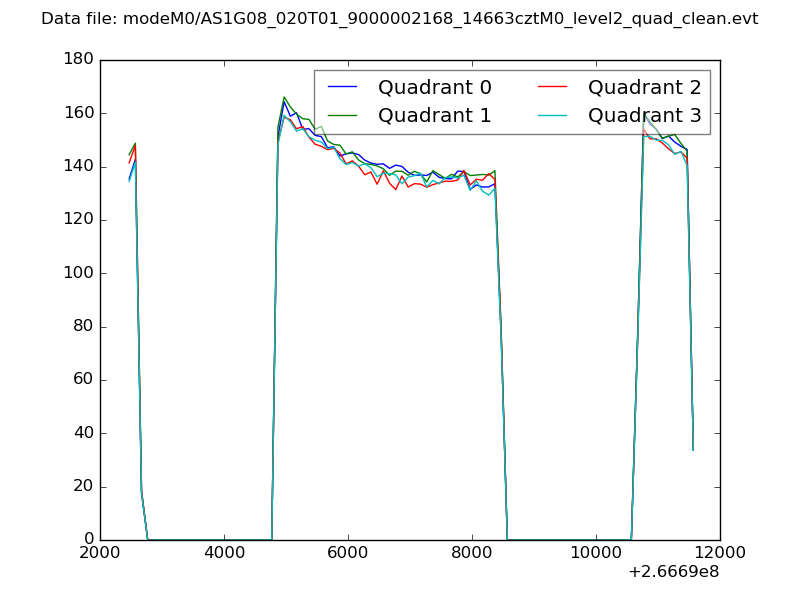 |
|
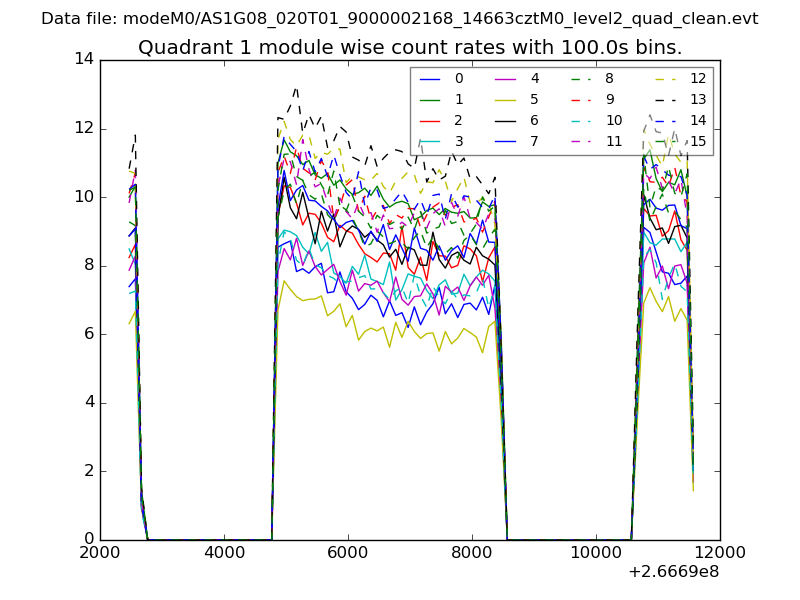
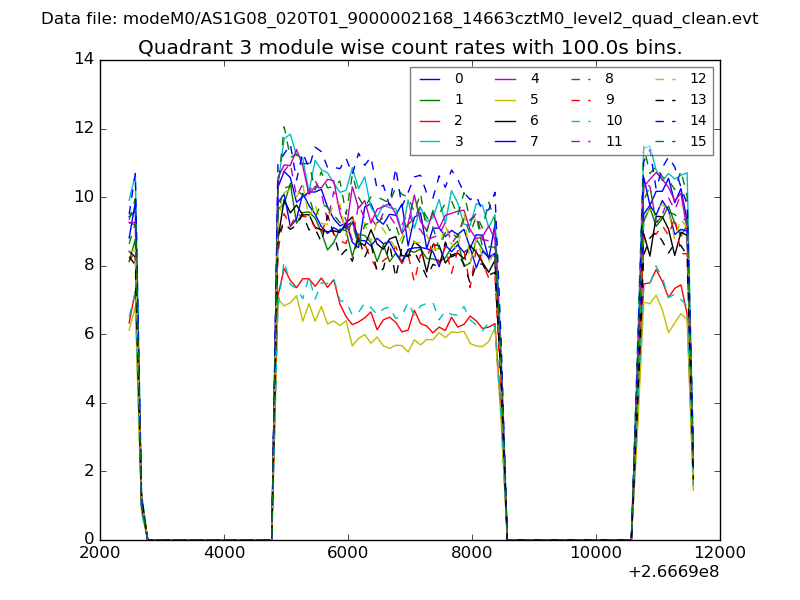
| Module-wise count rates for Quadrant A Data is divided into 100 sec bins |
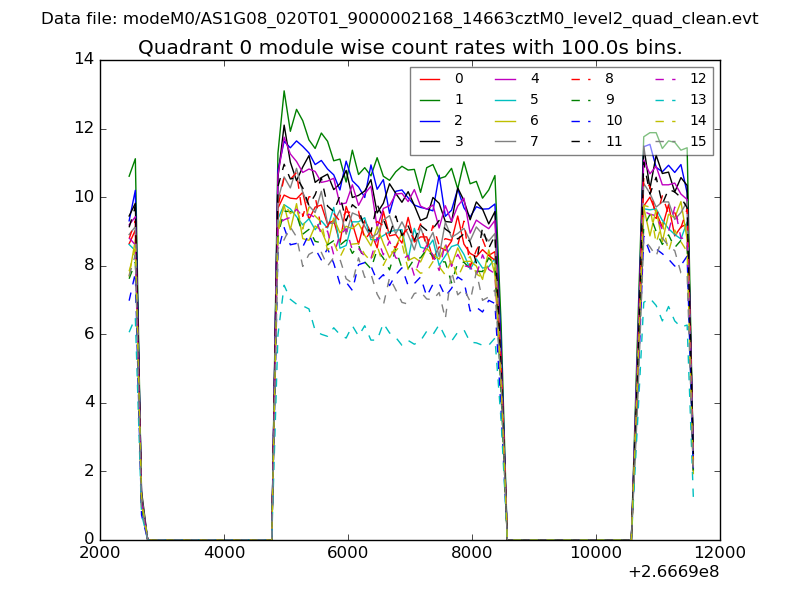 |
 |
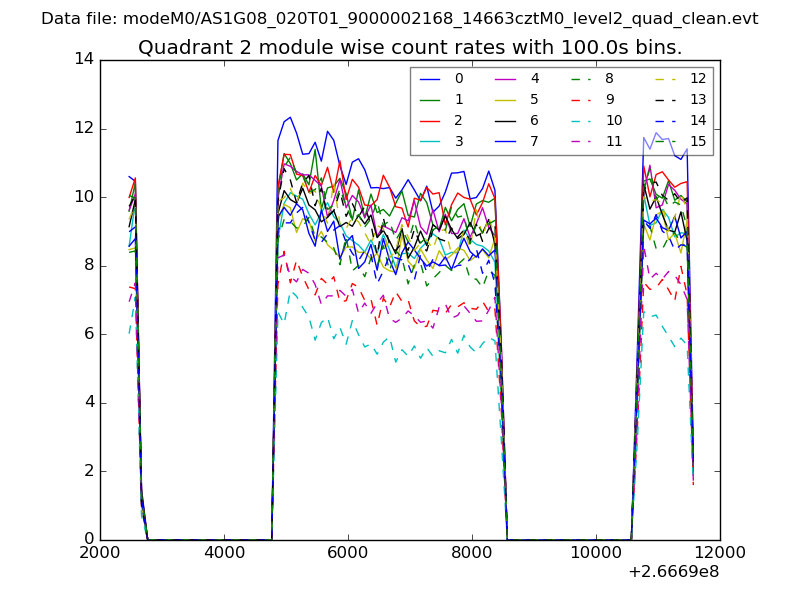
| Module-wise count rates for Quadrant B Data is divided into 100 sec bins |
 |
 |
| Module-wise count rates for Quadrant C Data is divided into 100 sec bins |
 |
 |
| Module-wise count rates for Quadrant D Data is divided into 100 sec bins |
 |
 |
| Parameter | Plot |
|---|---|
| CZT HV Monitor | 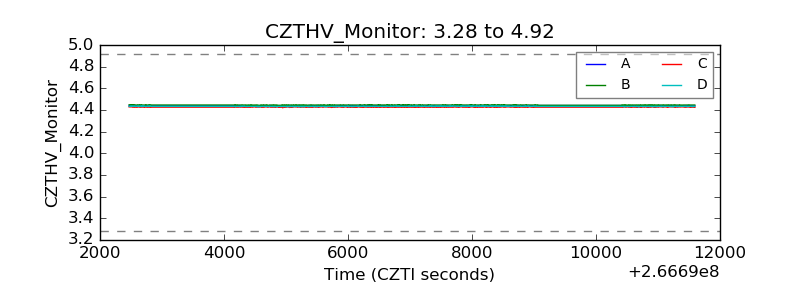 |
| D_VDD | 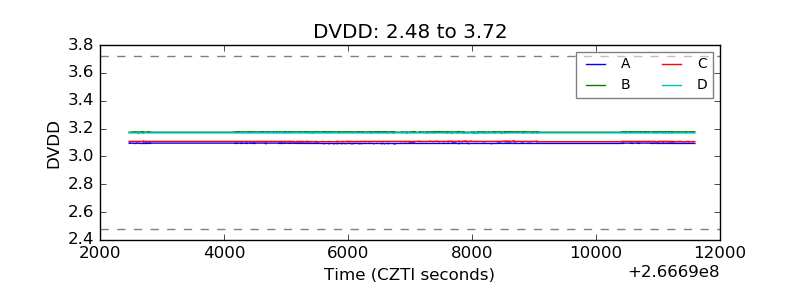 |
| Temperature 1 | 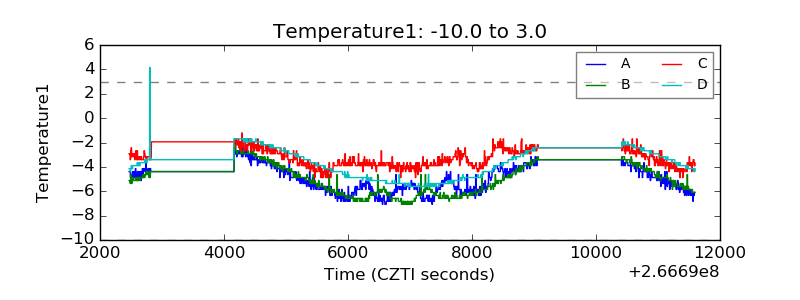 |
| Veto HV Monitor | 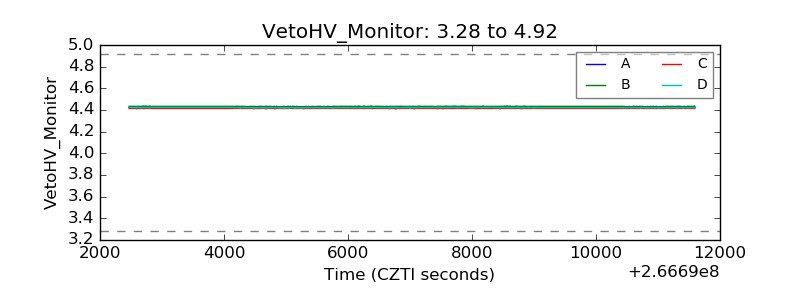 |
| Veto LLD | 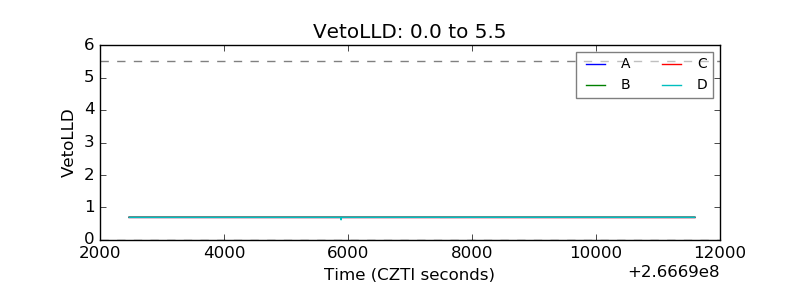 |
| Alpha Counter | 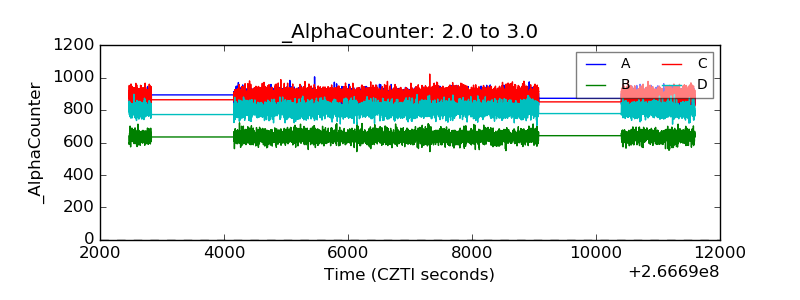 |
| _CPM_Rate | 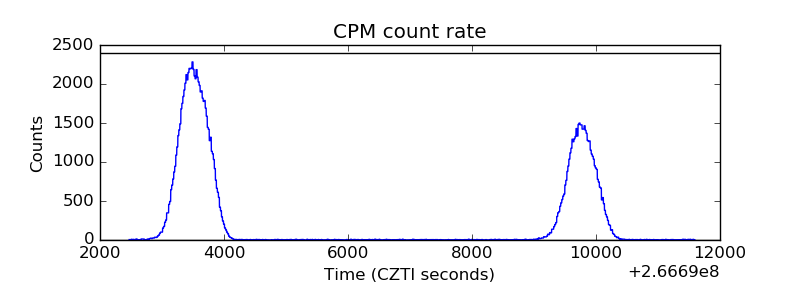 |
| CZT Counter | 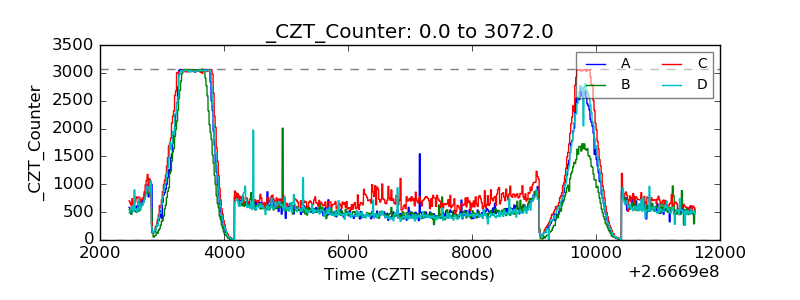 |
| +2.5 Volts monitor |  |
| +5 Volts monitor | 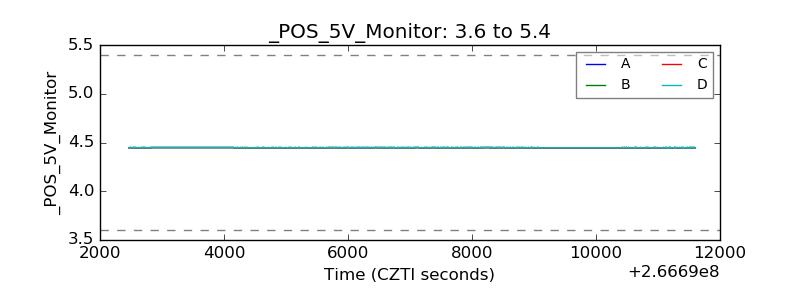 |
| _ROLL_ROT | 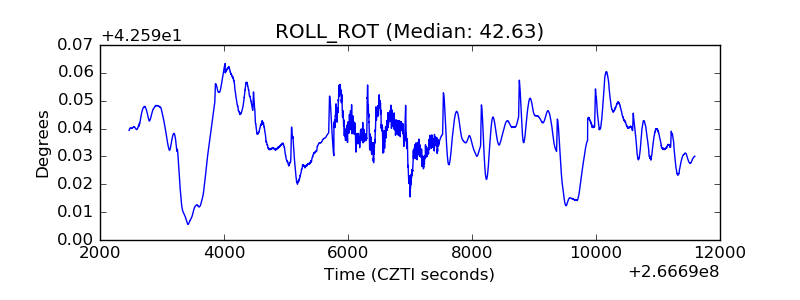 |
| _Roll_DEC | 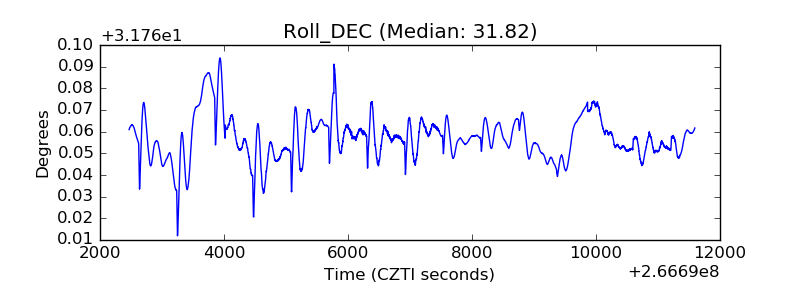 |
| _Roll_RA | 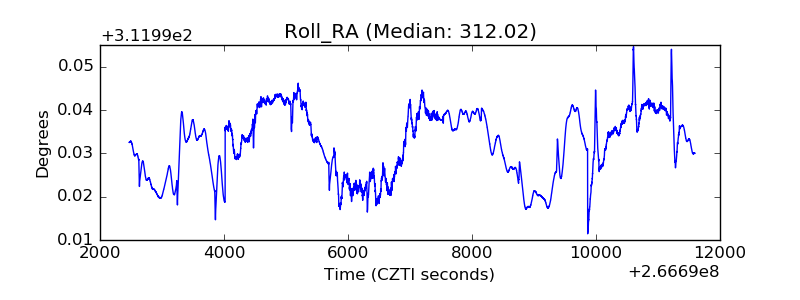 |
| Veto Counter | 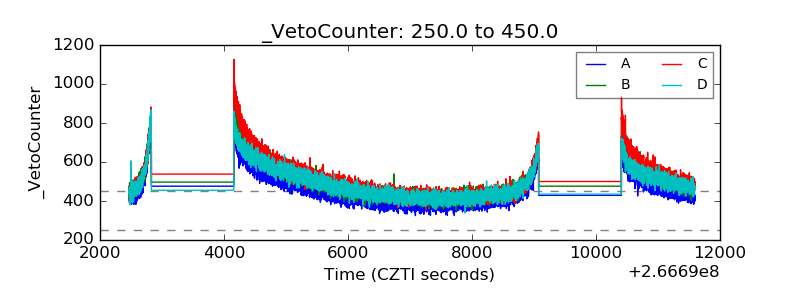 |