| Param | Original file | Final file |
|---|---|---|
| Filename | modeM0/AS1G08_020T01_9000002168_14664cztM0_level2.evt | modeM0/AS1G08_020T01_9000002168_14664cztM0_level2_quad_clean.evt |
| Size (bytes) | 476,884,800 | 104,160,960 |
| Size | 454.8 MB | 99.3 MB |
| Events in quadrant A | 3,338,745 | 686,086 |
| Events in quadrant B | 3,227,889 | 688,961 |
| Events in quadrant C | 3,812,018 | 676,431 |
| Events in quadrant D | 3,631,019 | 658,381 |
| Mode SS | |||
|---|---|---|---|
| Quadrant | BADHDUFLAG | Total packets | Discarded packets |
| A | 0 | 128 | 0 |
| B | 0 | 128 | 0 |
| C | 0 | 128 | 0 |
| D | 0 | 128 | 0 |
| Mode M0 | |||
|---|---|---|---|
| Quadrant | BADHDUFLAG | Total packets | Discarded packets |
| A | 0 | 13927 | 3 |
| B | 0 | 13649 | 2 |
| C | 0 | 15411 | 2 |
| D | 0 | 15020 | 2 |
| Mode M9 | |||
|---|---|---|---|
| Quadrant | BADHDUFLAG | Total packets | Discarded packets |
| A | 0 | 22 | 0 |
| B | 0 | 22 | 0 |
| C | 0 | 22 | 0 |
| D | 0 | 23 | 0 |
| Quadrant | Total seconds | Saturated seconds | Saturation percentage |
|---|---|---|---|
| A | 6379 | 31 | 0.485970% |
| B | 6379 | 62 | 0.971939% |
| C | 6379 | 36 | 0.564352% |
| D | 6379 | 224 | 3.511522% |
Noise dominated data is calculated using 1-second bins in cleaned event files. If a bin has >2000 counts, and if more than 50% of those come from <1% of pixels, then it is considered to be noise-dominated and hence unusable.
| Quadrant | # 1 sec bins | Bins with >0 counts | Bins with >2000 counts | High rate bins dominated by noise | Noise dominated (total time) | Noise dominated (detector-on time) | Marked lightcurve |
|---|---|---|---|---|---|---|---|
| A | 7535 | 6381 | 0 | 0 | 0.00% | 0.00% | 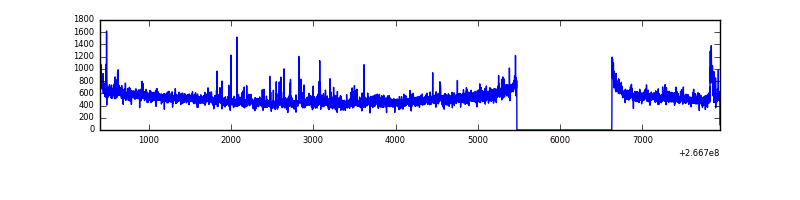 |
| B | 7535 | 6381 | 1 | 1 | 0.01% | 0.02% | 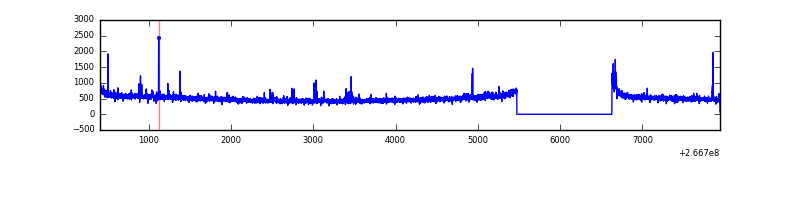 |
| C | 7535 | 6381 | 0 | 0 | 0.00% | 0.00% | 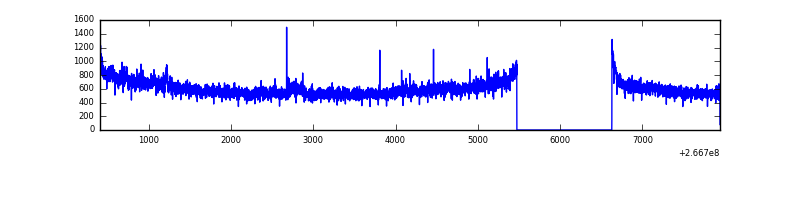 |
| D | 7534 | 6380 | 196 | 196 | 2.60% | 3.07% | 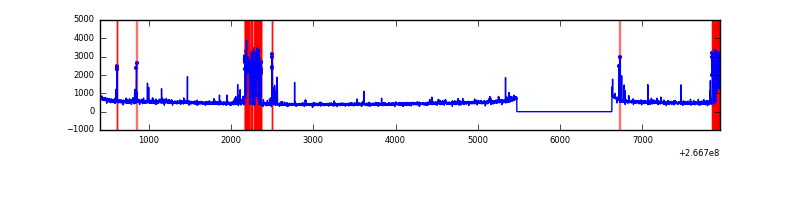 |
Top three noisy pixels from each quadrant. If the there are fewer than three noisy pixels in the level2.evt file, extra rows are filled as -1
| Pixel properties | Quadrant properties | ||||||
|---|---|---|---|---|---|---|---|
| Quadrant | DetID | PixID | Counts | Sigma | Mean | Median | Sigma |
| A | 12 | 189 | 84067 | 514.81 | 803 | 787 | 161.8 |
| A | 1 | 162 | 65138 | 397.79 | 803 | 787 | 161.8 |
| A | 8 | 15 | 52002 | 316.59 | 803 | 787 | 161.8 |
| B | 12 | 111 | 17600 | 111.07 | 804 | 787 | 151.4 |
| B | 11 | 111 | 14867 | 93.02 | 804 | 787 | 151.4 |
| B | 0 | 190 | 13215 | 82.1 | 804 | 787 | 151.4 |
| C | 3 | 233 | 723560 | 3955.13 | 791 | 796 | 182.7 |
| C | 13 | 61 | 5556 | 26.05 | 791 | 796 | 182.7 |
| C | 3 | 234 | 3376 | 14.12 | 791 | 796 | 182.7 |
| D | 10 | 199 | 551253 | 2718.03 | 774 | 759 | 202.5 |
| D | 5 | 222 | 49257 | 239.46 | 774 | 759 | 202.5 |
| D | 10 | 70 | 29204 | 140.45 | 774 | 759 | 202.5 |
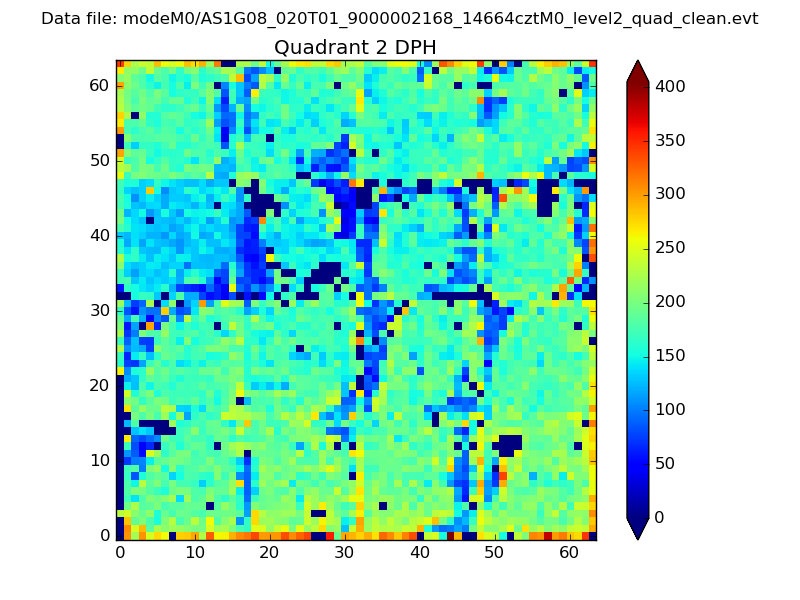
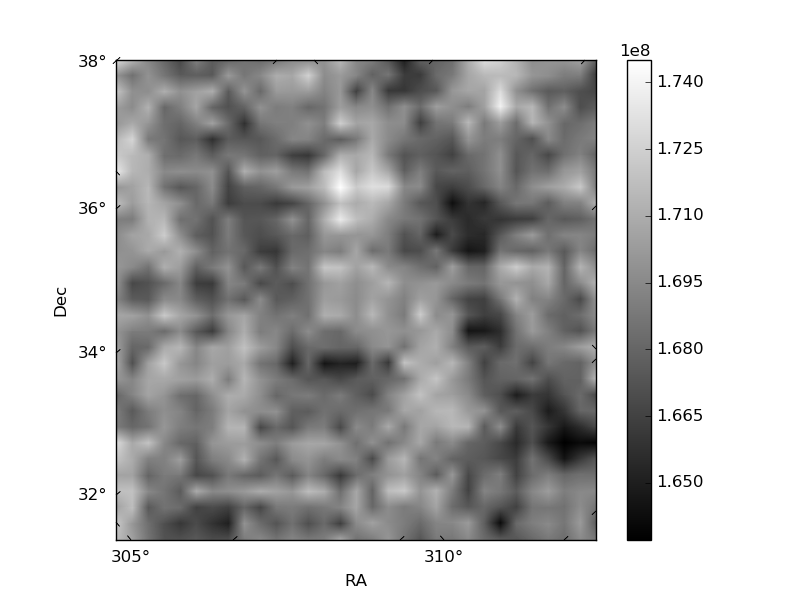
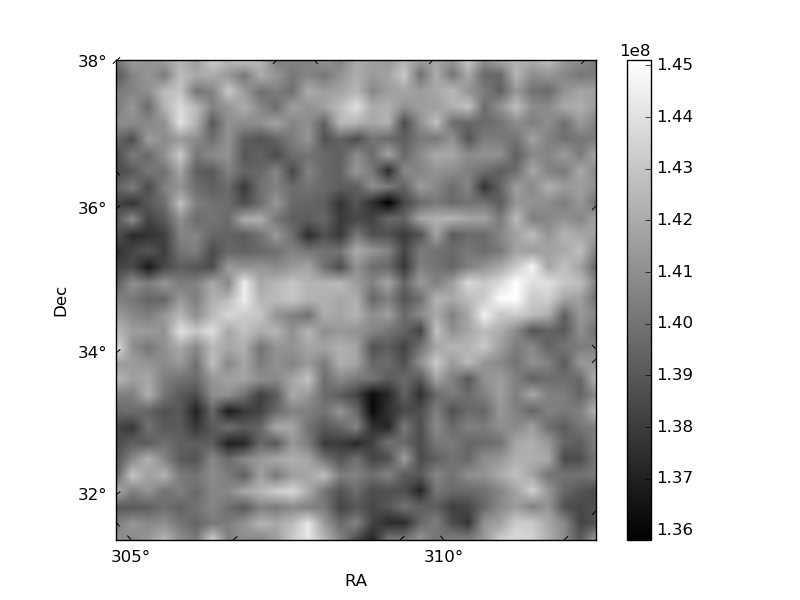
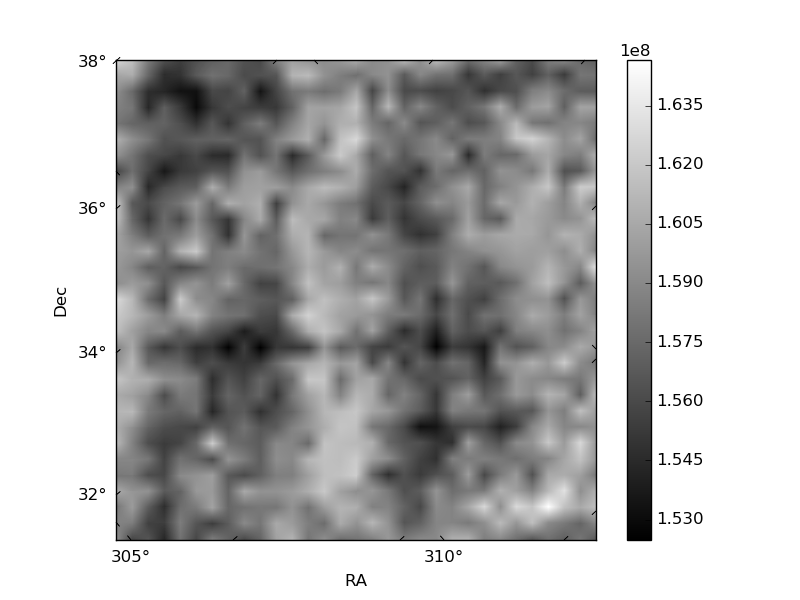
Histogram calculated using DETX and DETY for each event in the final _common_clean file
| Quadrant A |  |
 |
Quadrant B |
|---|---|---|---|
| Quadrant D | 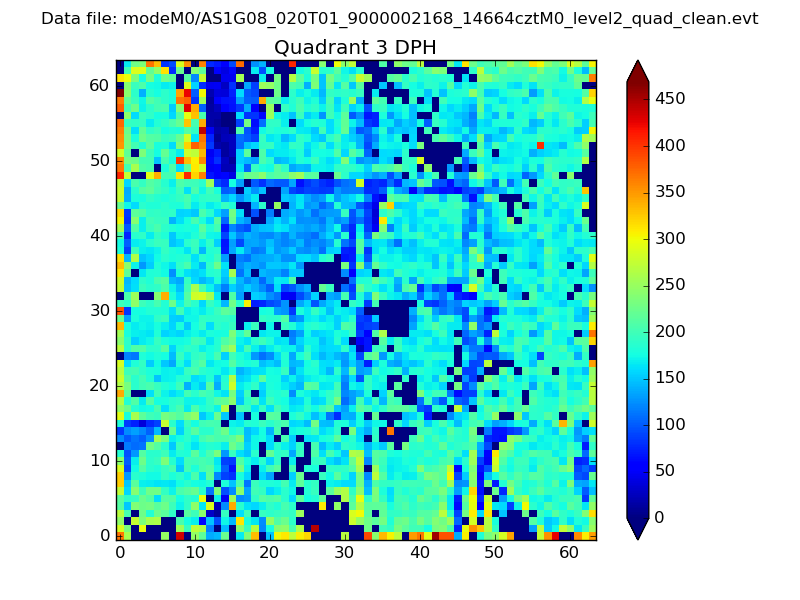 |
 |
Quadrant C |
| Plot type | Count rate plots | Images |
|---|---|---|
| Comparison with Poisson distribution Blue bars denote a histogram of data divided into 1 sec bins. Red curve is a Poisson curve with rate = median count rate of data. |
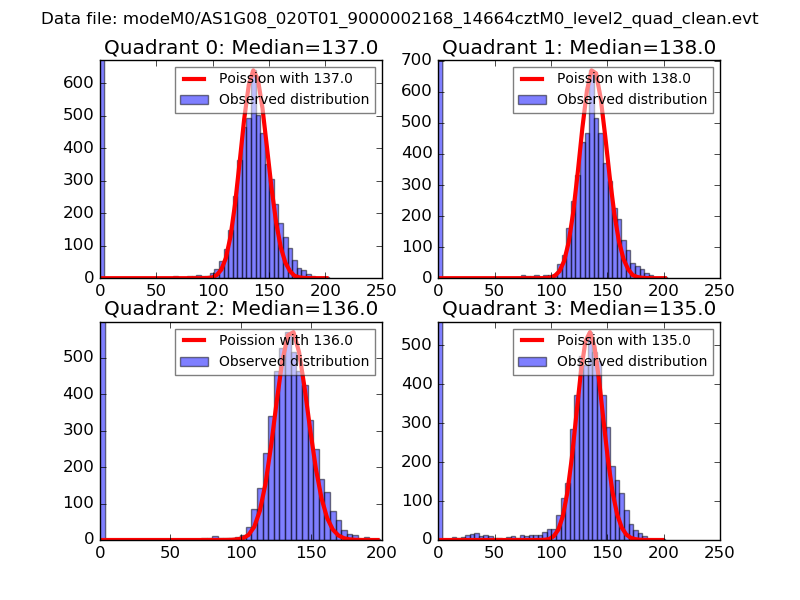 |
 |
| Quadrant-wise count rates Data is divided into 100 sec bins |
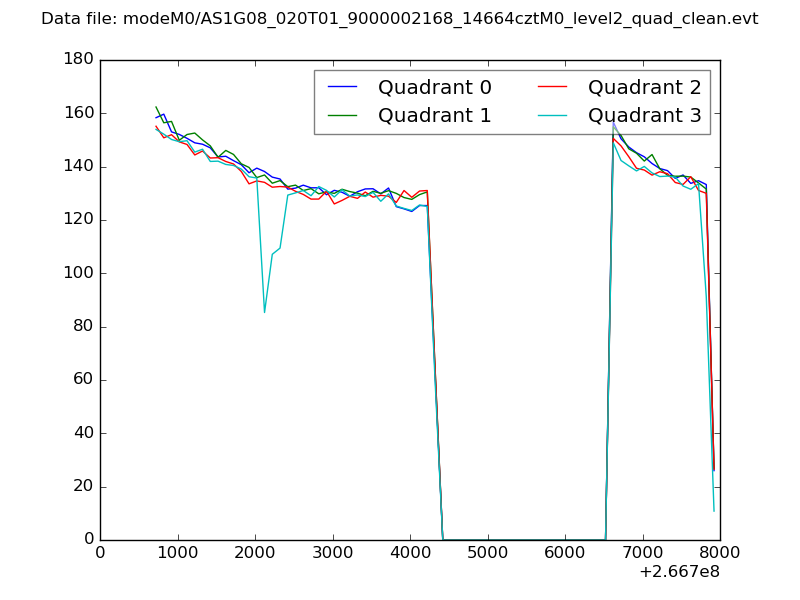 |
|
| Module-wise count rates for Quadrant A Data is divided into 100 sec bins |
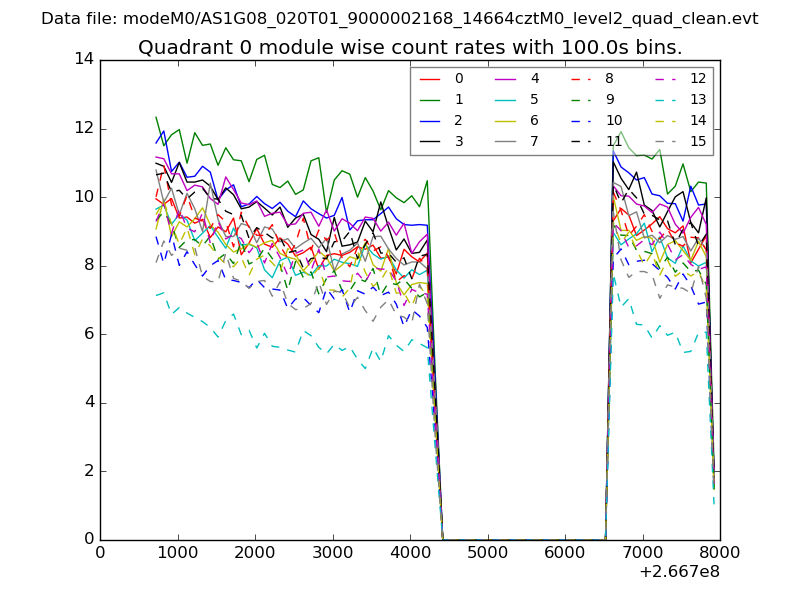 |
 |
| Module-wise count rates for Quadrant B Data is divided into 100 sec bins |
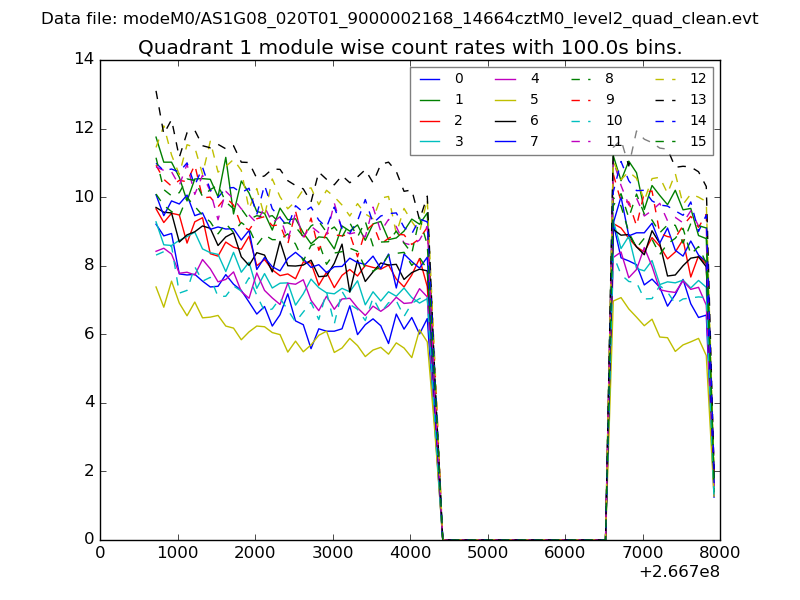 |
 |
| Module-wise count rates for Quadrant C Data is divided into 100 sec bins |
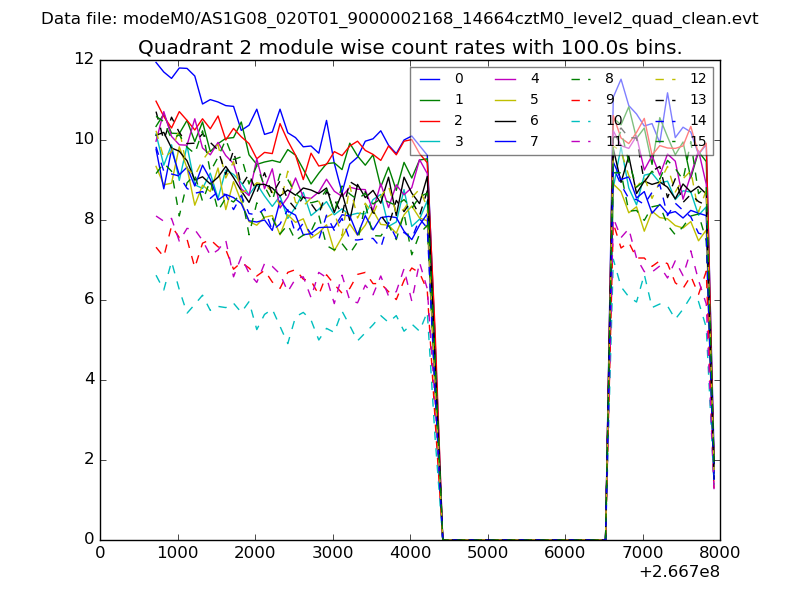 |
 |
| Module-wise count rates for Quadrant D Data is divided into 100 sec bins |
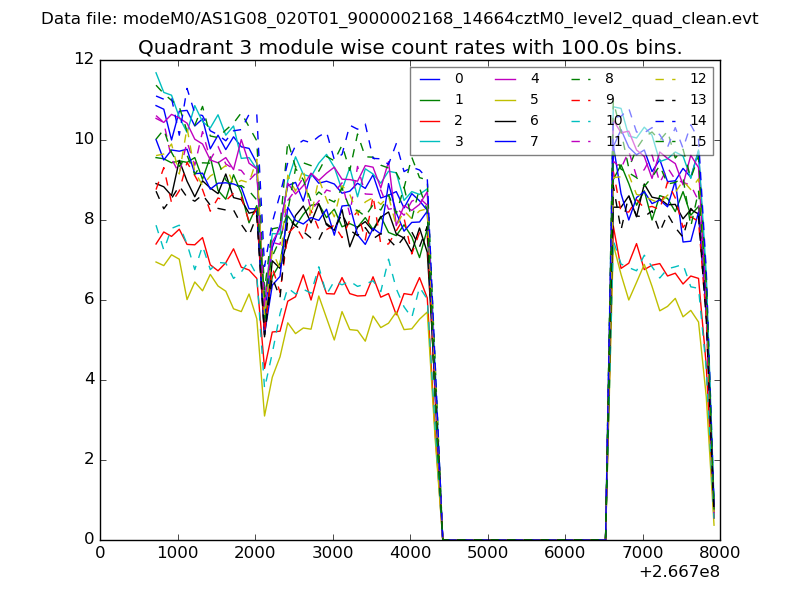 |
 |
| Parameter | Plot |
|---|---|
| CZT HV Monitor | 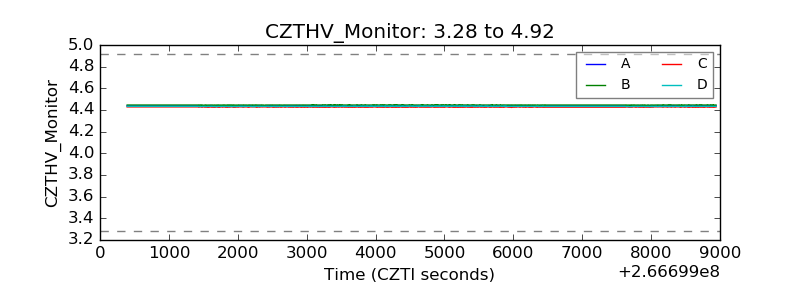 |
| D_VDD | 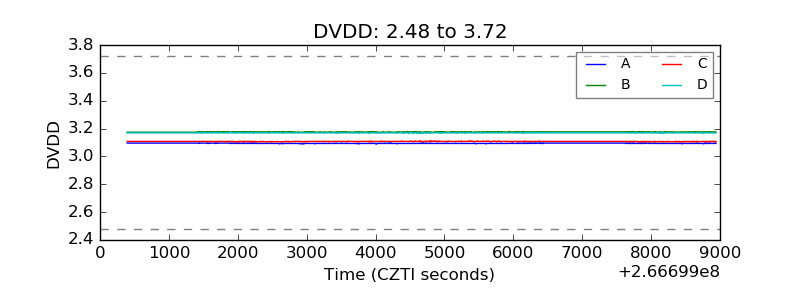 |
| Temperature 1 | 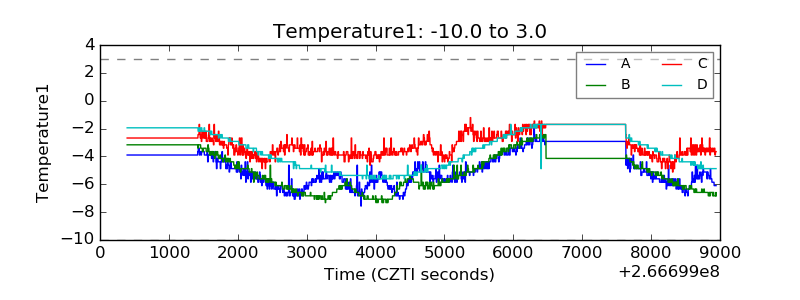 |
| Veto HV Monitor | 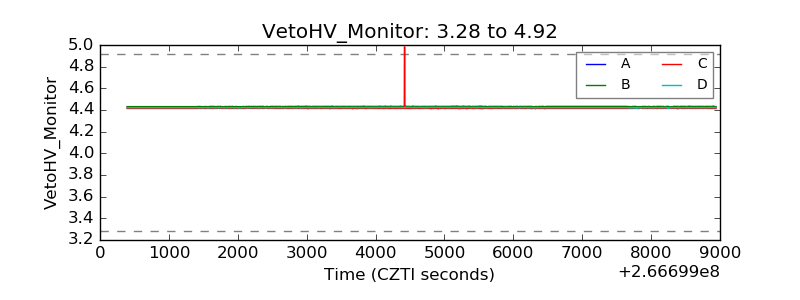 |
| Veto LLD | 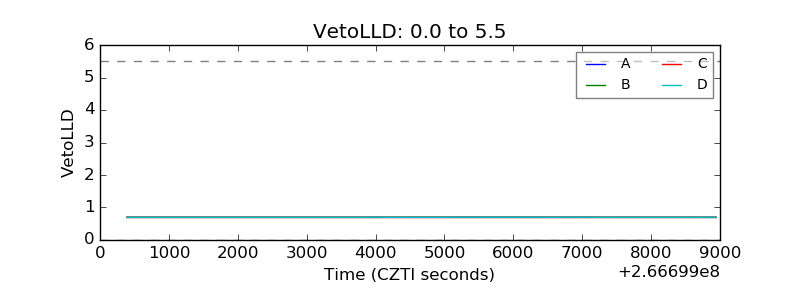 |
| Alpha Counter | 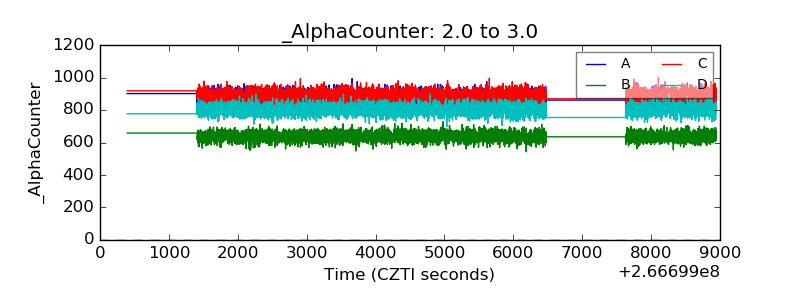 |
| _CPM_Rate |  |
| CZT Counter | 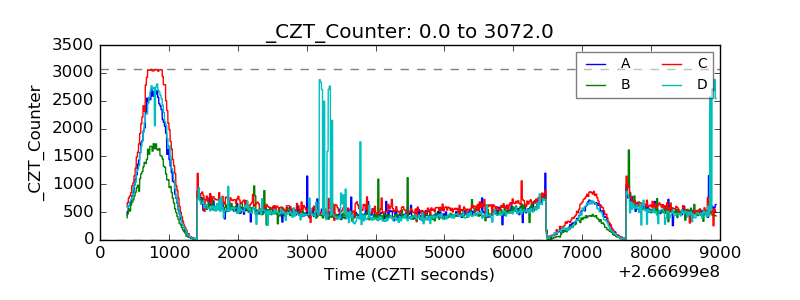 |
| +2.5 Volts monitor |  |
| +5 Volts monitor |  |
| _ROLL_ROT | 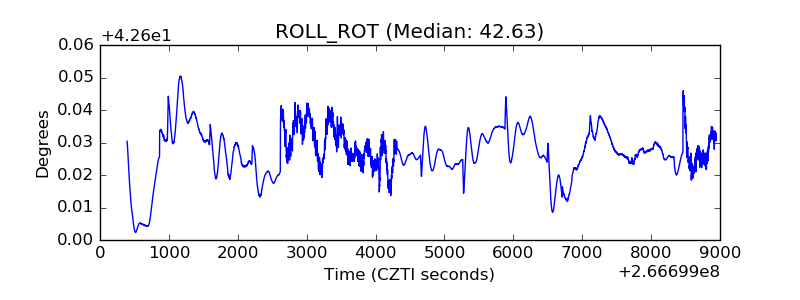 |
| _Roll_DEC | 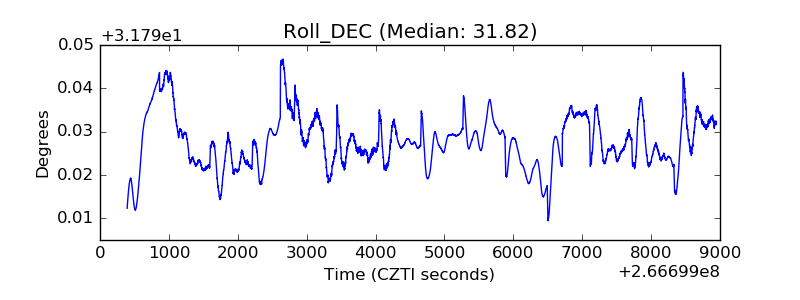 |
| _Roll_RA | 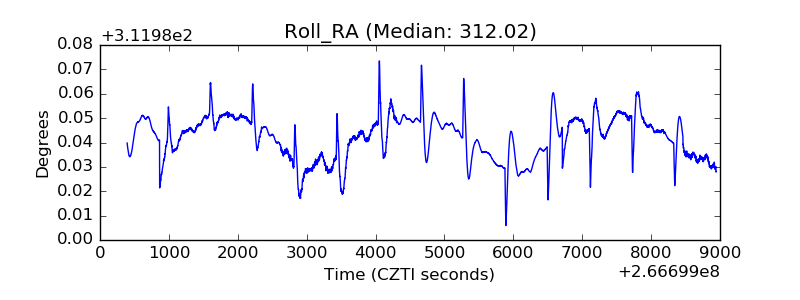 |
| Veto Counter | 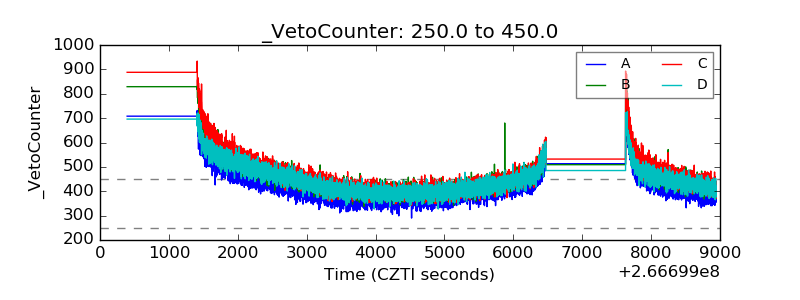 |