| Param | Original file | Final file |
|---|---|---|
| Filename | modeM0/AS1A04_101T01_9000002170cztM0_level2.fits | modeM0/AS1A04_101T01_9000002170cztM0_level2_quad_clean.evt |
| Size (bytes) | 954,057,600 | 911,018,880 |
| Size | 909.9 MB | 868.8 MB |
| Events in quadrant A | 5,849,976 | 5,482,478 |
| Events in quadrant B | 5,528,894 | 5,263,993 |
| Events in quadrant C | 5,696,818 | 5,193,662 |
| Events in quadrant D | 5,045,866 | 4,878,581 |
| Mode M9 | |||
|---|---|---|---|
| Quadrant | BADHDUFLAG | Total packets | Discarded packets |
| A | 0 | 143 | 0 |
| B | 0 | 143 | 0 |
| C | 0 | 143 | 0 |
| D | 0 | 143 | 0 |
| Mode SS | |||
|---|---|---|---|
| Quadrant | BADHDUFLAG | Total packets | Discarded packets |
| A | 0 | 2014 | 0 |
| B | 0 | 2014 | 0 |
| C | 0 | 2014 | 0 |
| D | 0 | 2014 | 0 |
| Mode M0 | |||
|---|---|---|---|
| Quadrant | BADHDUFLAG | Total packets | Discarded packets |
| A | 0 | 225393 | 0 |
| B | 0 | 218319 | 0 |
| C | 0 | 231722 | 0 |
| D | 0 | 221275 | 0 |
| Quadrant | Total seconds | Saturated seconds | Saturation percentage |
|---|---|---|---|
| A | 98799 | 1094 | 1.107299% |
| B | 98799 | 2219 | 2.245974% |
| C | 98799 | 801 | 0.810737% |
| D | 98799 | 1557 | 1.575927% |
Noise dominated data is calculated using 1-second bins in cleaned event files. If a bin has >2000 counts, and if more than 50% of those come from <1% of pixels, then it is considered to be noise-dominated and hence unusable.
| Quadrant | # 1 sec bins | Bins with >0 counts | Bins with >2000 counts | High rate bins dominated by noise | Noise dominated (total time) | Noise dominated (detector-on time) | Marked lightcurve |
|---|---|---|---|---|---|---|---|
| A | 113149 | 98784 | 0 | 0 | 0.00% | 0.00% |  |
| B | 113149 | 98750 | 0 | 0 | 0.00% | 0.00% |  |
| C | 113149 | 98784 | 0 | 0 | 0.00% | 0.00% |  |
| D | 113149 | 98753 | 0 | 0 | 0.00% | 0.00% |  |
Top three noisy pixels from each quadrant. If the there are fewer than three noisy pixels in the level2.evt file, extra rows are filled as -1
| Pixel properties | Quadrant properties | ||||||
|---|---|---|---|---|---|---|---|
| Quadrant | DetID | PixID | Counts | Sigma | Mean | Median | Sigma |
| A | 0 | 29 | 5719 | 11.26 | 1520 | 1418 | 381.9 |
| A | 7 | 110 | 4581 | 8.28 | 1520 | 1418 | 381.9 |
| A | 9 | 19 | 4435 | 7.9 | 1520 | 1418 | 381.9 |
| B | 2 | 9 | 4834 | 11.84 | 1461 | 1390 | 290.9 |
| B | 3 | 17 | 3793 | 8.26 | 1461 | 1390 | 290.9 |
| B | 5 | 128 | 3711 | 7.98 | 1461 | 1390 | 290.9 |
| C | 12 | 241 | 3885 | 6.36 | 1507 | 1403 | 390.3 |
| C | 2 | 191 | 3806 | 6.16 | 1507 | 1403 | 390.3 |
| C | 7 | 111 | 3765 | 6.05 | 1507 | 1403 | 390.3 |
| D | 6 | 231 | 3765 | 6.33 | 1438 | 1305 | 388.9 |
| D | 3 | 14 | 3702 | 6.16 | 1438 | 1305 | 388.9 |
| D | 6 | 67 | 3477 | 5.59 | 1438 | 1305 | 388.9 |
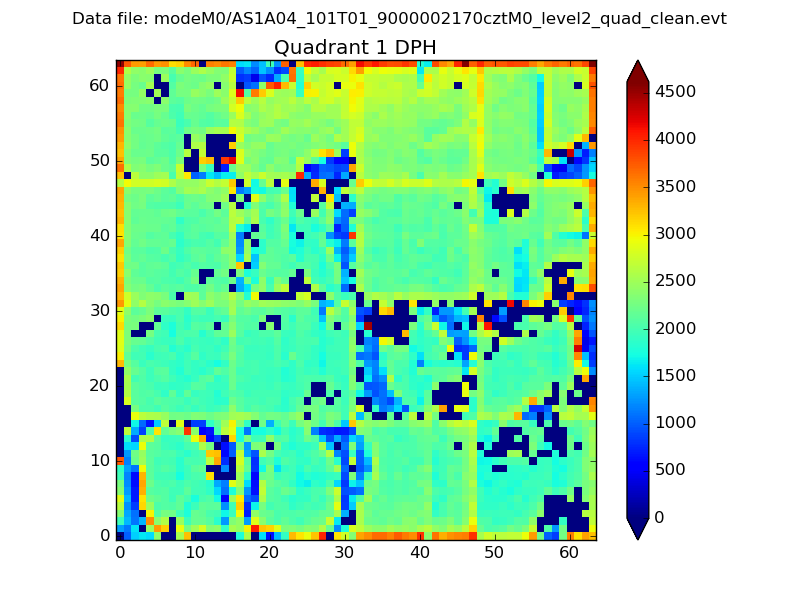
Histogram calculated using DETX and DETY for each event in the final _common_clean file
| Quadrant A |  |
 |
Quadrant B |
|---|---|---|---|
| Quadrant D |  |
 |
Quadrant C |
| Plot type | Count rate plots | Images |
|---|---|---|
| Comparison with Poisson distribution Blue bars denote a histogram of data divided into 1 sec bins. Red curve is a Poisson curve with rate = median count rate of data. |
 |
 |
| Quadrant-wise count rates Data is divided into 100 sec bins |
 |
|
| Module-wise count rates for Quadrant A Data is divided into 100 sec bins |
 |
 |
| Module-wise count rates for Quadrant B Data is divided into 100 sec bins |
 |
 |
| Module-wise count rates for Quadrant C Data is divided into 100 sec bins |
 |
 |
| Module-wise count rates for Quadrant D Data is divided into 100 sec bins |
 |
 |
| Parameter | Plot |
|---|---|
| CZT HV Monitor |  |
| D_VDD |  |
| Temperature 1 |  |
| Veto HV Monitor |  |
| Veto LLD |  |
| Alpha Counter |  |
| _CPM_Rate |  |
| CZT Counter |  |
| +2.5 Volts monitor |  |
| +5 Volts monitor |  |
| _ROLL_ROT |  |
| _Roll_DEC |  |
| _Roll_RA |  |
| Veto Counter |  |