| Param | Original file | Final file |
|---|---|---|
| Filename | modeM0/AS1A04_101T01_9000002170_14667cztM0_level2.evt | modeM0/AS1A04_101T01_9000002170_14667cztM0_level2_quad_clean.evt |
| Size (bytes) | 283,443,840 | 61,971,840 |
| Size | 270.3 MB | 59.1 MB |
| Events in quadrant A | 2,071,646 | 409,916 |
| Events in quadrant B | 1,930,700 | 408,553 |
| Events in quadrant C | 2,155,763 | 408,160 |
| Events in quadrant D | 2,183,678 | 398,622 |
| Mode M9 | |||
|---|---|---|---|
| Quadrant | BADHDUFLAG | Total packets | Discarded packets |
| A | 0 | 3 | 0 |
| B | 0 | 3 | 0 |
| C | 0 | 3 | 0 |
| D | 0 | 3 | 0 |
| Mode SS | |||
|---|---|---|---|
| Quadrant | BADHDUFLAG | Total packets | Discarded packets |
| A | 0 | 74 | 0 |
| B | 0 | 74 | 0 |
| C | 0 | 74 | 0 |
| D | 0 | 74 | 0 |
| Mode M0 | |||
|---|---|---|---|
| Quadrant | BADHDUFLAG | Total packets | Discarded packets |
| A | 0 | 8524 | 2 |
| B | 0 | 7899 | 1 |
| C | 0 | 8781 | 1 |
| D | 0 | 8733 | 1 |
| Quadrant | Total seconds | Saturated seconds | Saturation percentage |
|---|---|---|---|
| A | 3545 | 35 | 0.987306% |
| B | 3545 | 38 | 1.071932% |
| C | 3545 | 17 | 0.479549% |
| D | 3545 | 128 | 3.610719% |
Noise dominated data is calculated using 1-second bins in cleaned event files. If a bin has >2000 counts, and if more than 50% of those come from <1% of pixels, then it is considered to be noise-dominated and hence unusable.
| Quadrant | # 1 sec bins | Bins with >0 counts | Bins with >2000 counts | High rate bins dominated by noise | Noise dominated (total time) | Noise dominated (detector-on time) | Marked lightcurve |
|---|---|---|---|---|---|---|---|
| A | 3876 | 3547 | 3 | 3 | 0.08% | 0.08% | 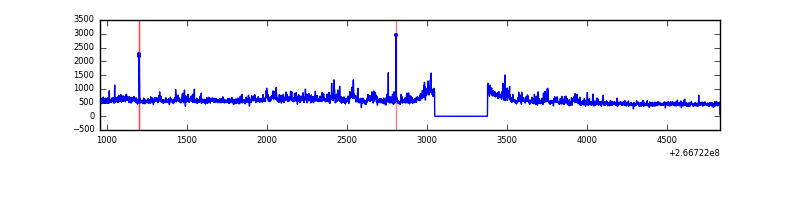 |
| B | 3876 | 3547 | 3 | 3 | 0.08% | 0.08% | 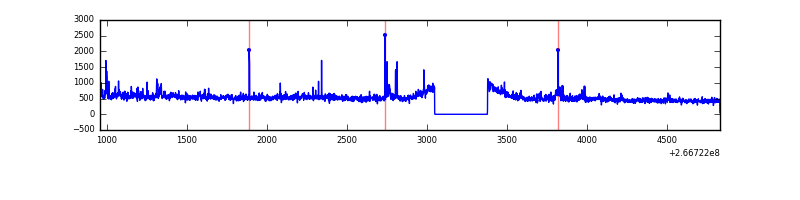 |
| C | 3876 | 3547 | 2 | 2 | 0.05% | 0.06% | 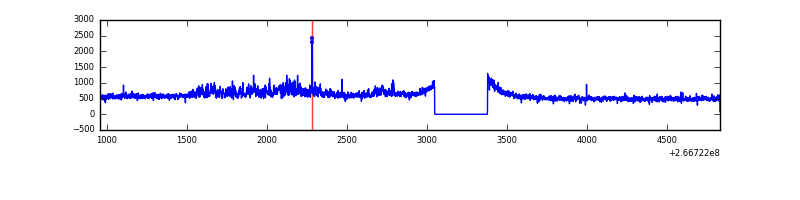 |
| D | 3876 | 3547 | 134 | 134 | 3.46% | 3.78% | 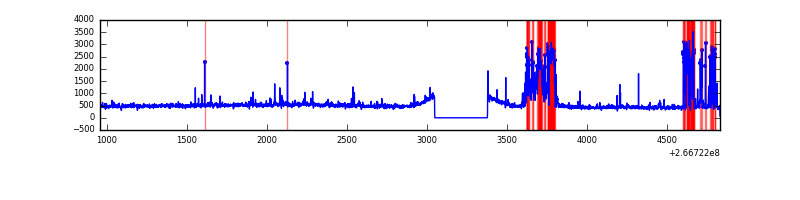 |
Top three noisy pixels from each quadrant. If the there are fewer than three noisy pixels in the level2.evt file, extra rows are filled as -1
| Pixel properties | Quadrant properties | ||||||
|---|---|---|---|---|---|---|---|
| Quadrant | DetID | PixID | Counts | Sigma | Mean | Median | Sigma |
| A | 8 | 15 | 264459 | 2807.11 | 453 | 442 | 94.1 |
| A | 1 | 162 | 23379 | 243.87 | 453 | 442 | 94.1 |
| A | 9 | 143 | 11823 | 121.01 | 453 | 442 | 94.1 |
| B | 0 | 219 | 47685 | 533.04 | 449 | 437 | 88.6 |
| B | 0 | 205 | 25248 | 279.91 | 449 | 437 | 88.6 |
| B | 0 | 230 | 23583 | 261.13 | 449 | 437 | 88.6 |
| C | 3 | 233 | 439775 | 4227.56 | 437 | 441 | 103.9 |
| C | 0 | 207 | 9918 | 91.19 | 437 | 441 | 103.9 |
| C | 13 | 61 | 3157 | 26.14 | 437 | 441 | 103.9 |
| D | 9 | 1 | 271941 | 2361.5 | 433 | 421 | 115.0 |
| D | 10 | 199 | 178840 | 1551.77 | 433 | 421 | 115.0 |
| D | 5 | 222 | 18822 | 160.04 | 433 | 421 | 115.0 |
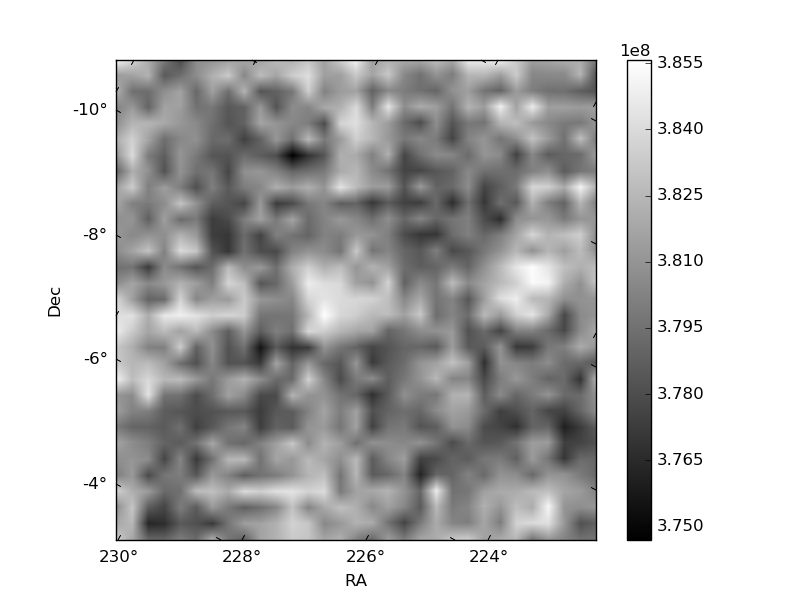
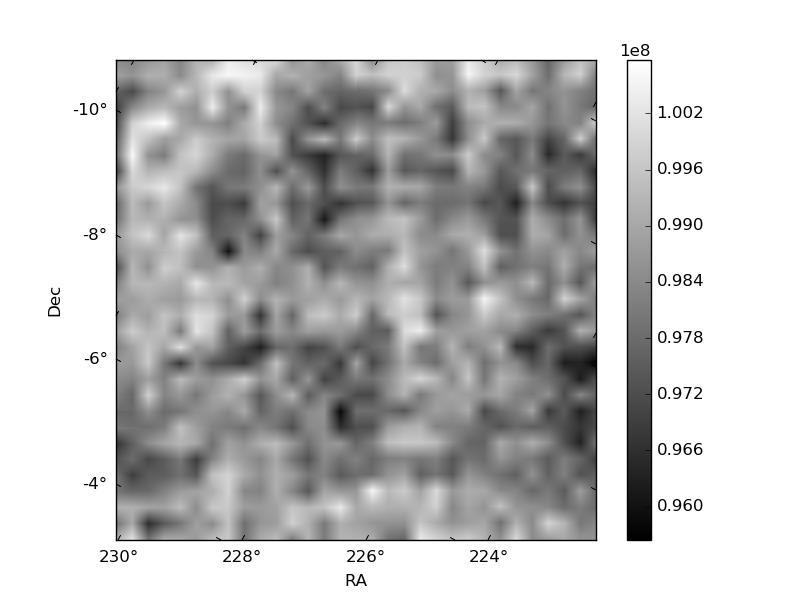
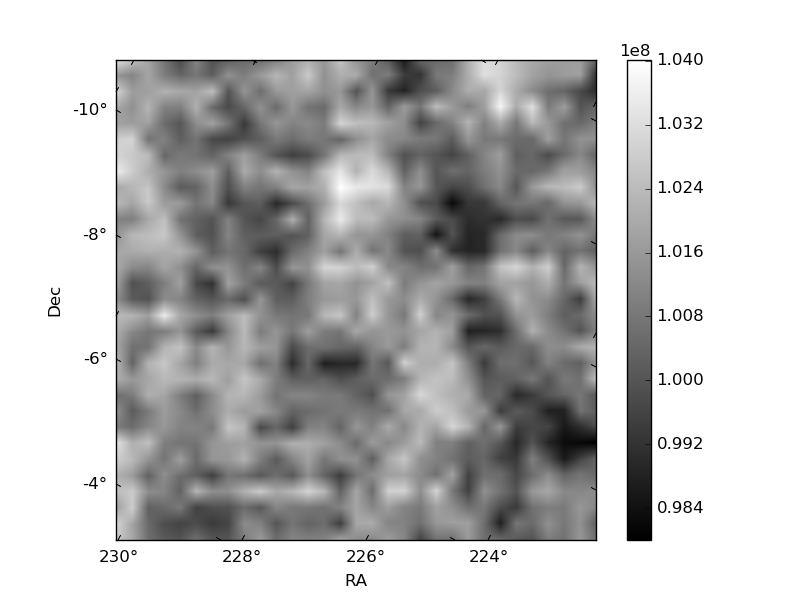
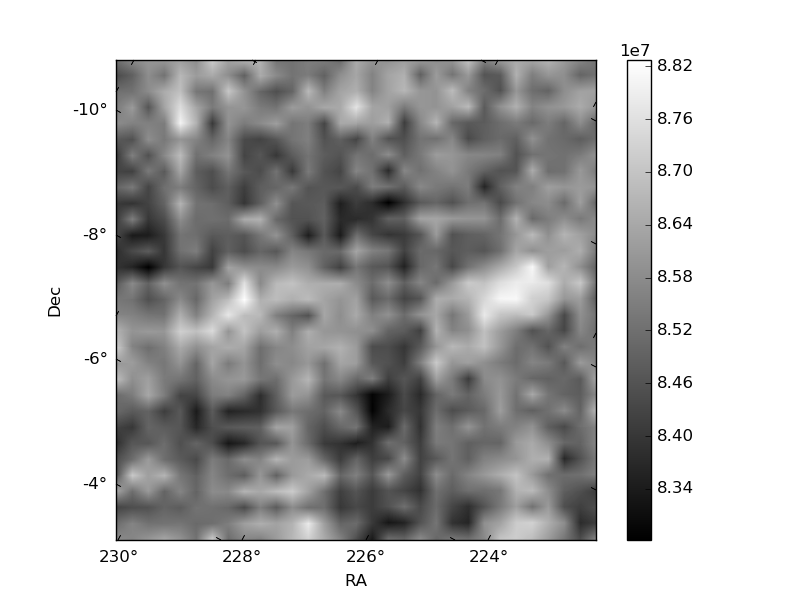
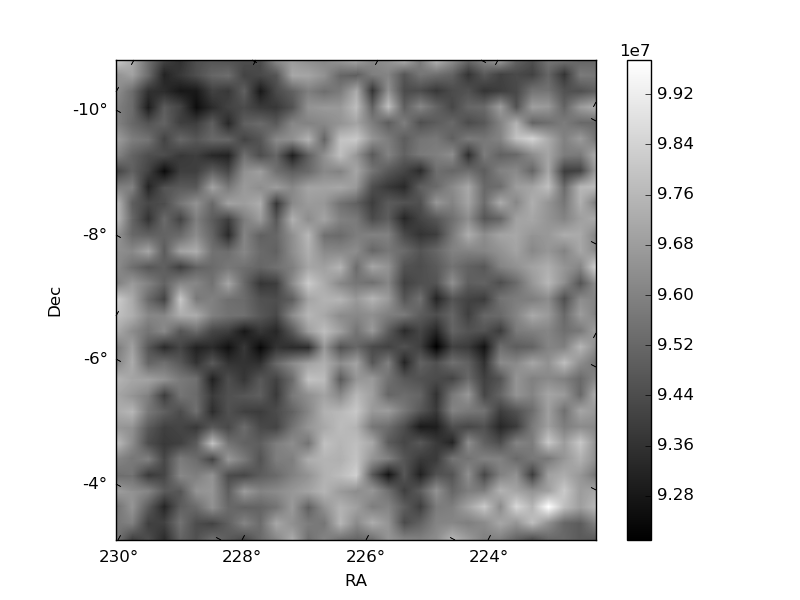
Histogram calculated using DETX and DETY for each event in the final _common_clean file
| Quadrant A | 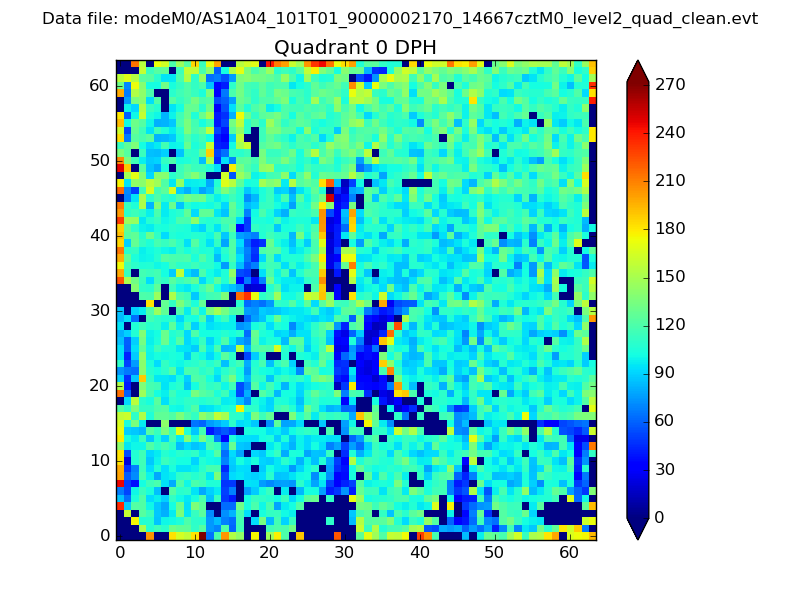 |
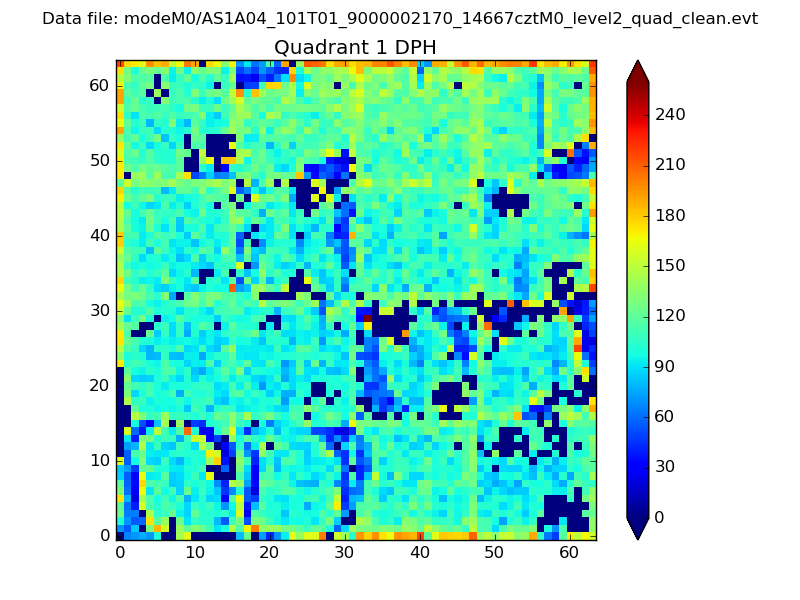 |
Quadrant B |
|---|---|---|---|
| Quadrant D | 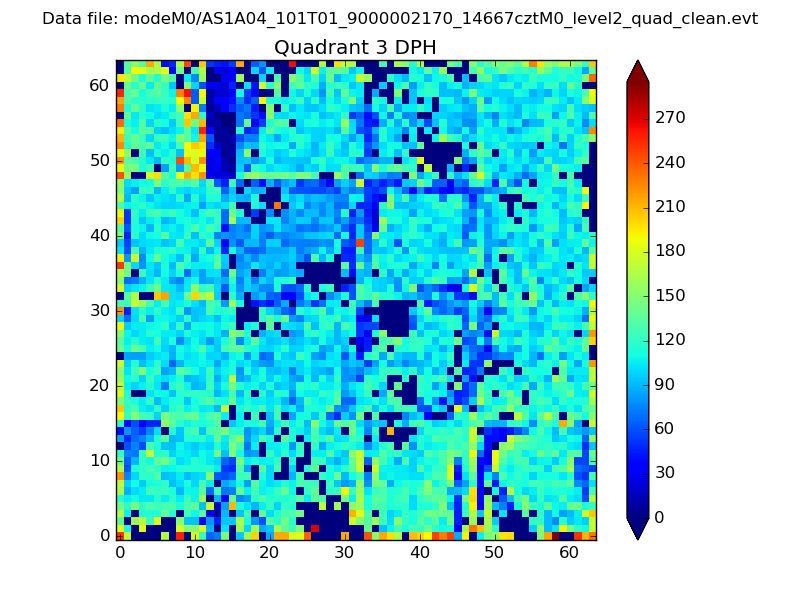 |
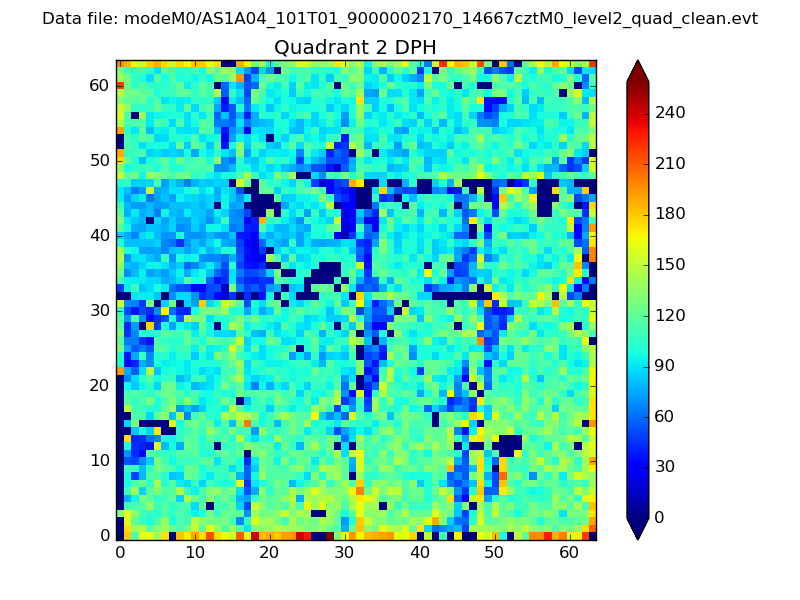 |
Quadrant C |
| Plot type | Count rate plots | Images |
|---|---|---|
| Comparison with Poisson distribution Blue bars denote a histogram of data divided into 1 sec bins. Red curve is a Poisson curve with rate = median count rate of data. |
 |
 |
| Quadrant-wise count rates Data is divided into 100 sec bins |
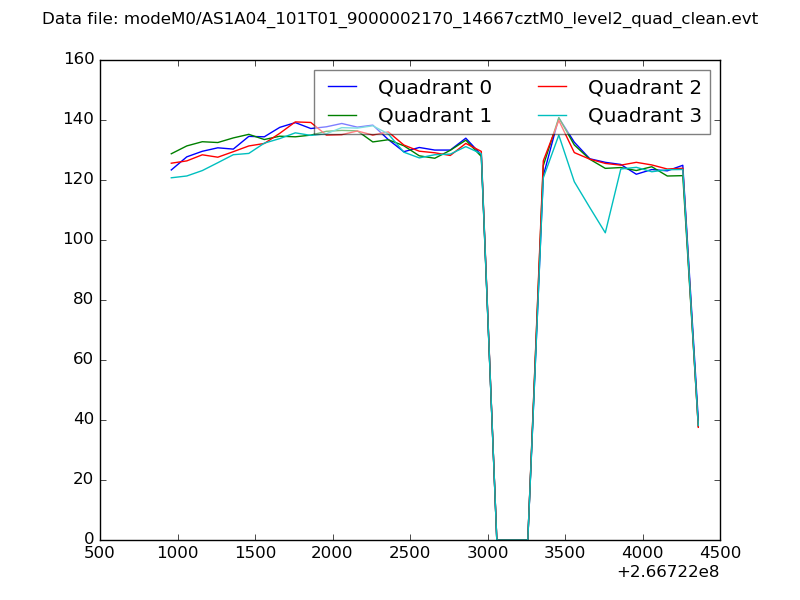 |
|
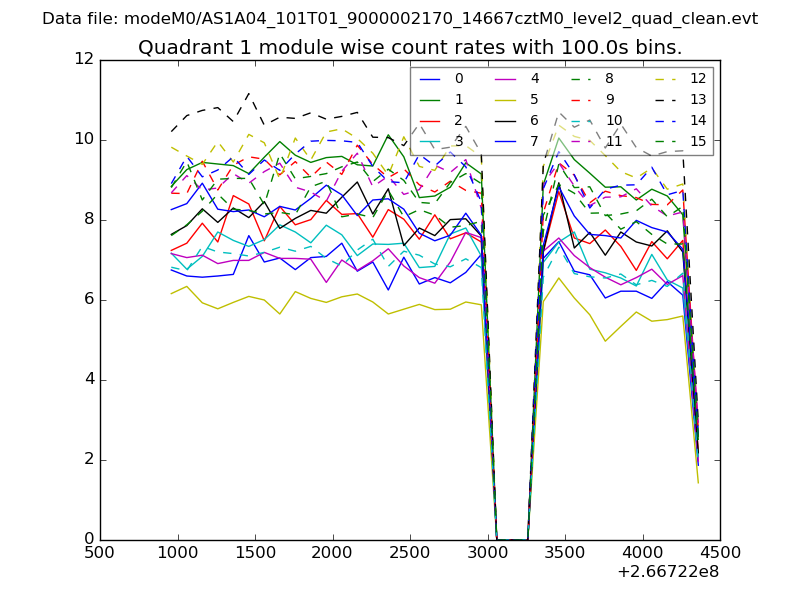
| Module-wise count rates for Quadrant A Data is divided into 100 sec bins |
 |
 |
| Module-wise count rates for Quadrant B Data is divided into 100 sec bins |
 |
 |
| Module-wise count rates for Quadrant C Data is divided into 100 sec bins |
 |
 |
| Module-wise count rates for Quadrant D Data is divided into 100 sec bins |
 |
 |
| Parameter | Plot |
|---|---|
| CZT HV Monitor |  |
| D_VDD | 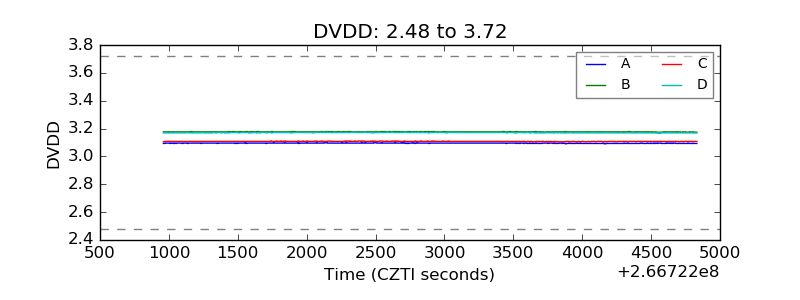 |
| Temperature 1 | 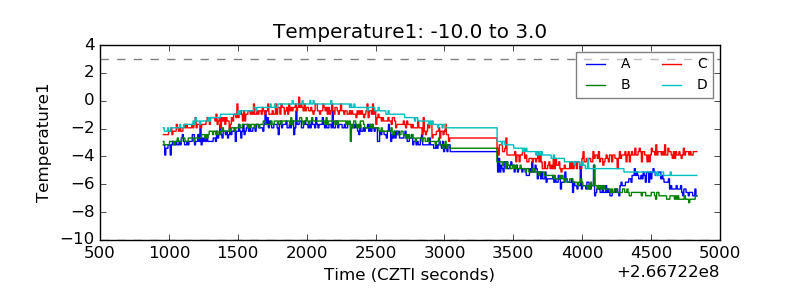 |
| Veto HV Monitor |  |
| Veto LLD | 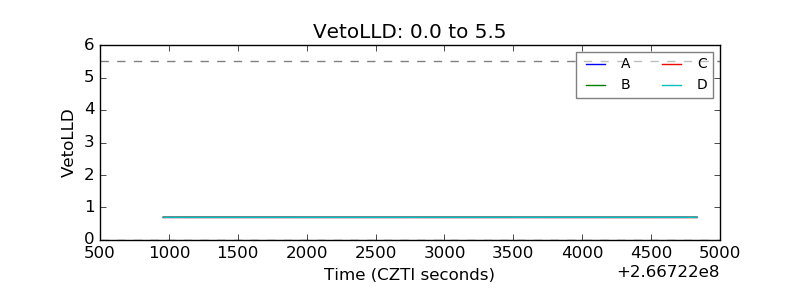 |
| Alpha Counter | 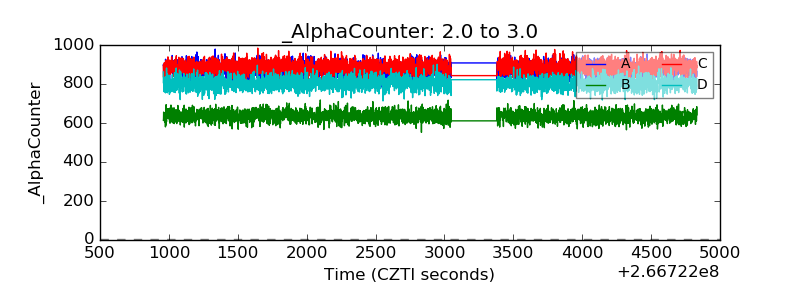 |
| _CPM_Rate | 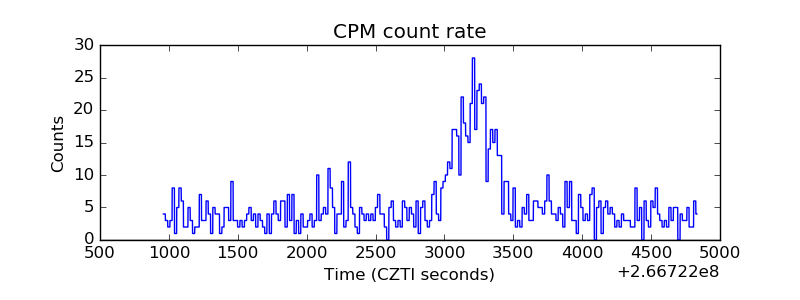 |
| CZT Counter | 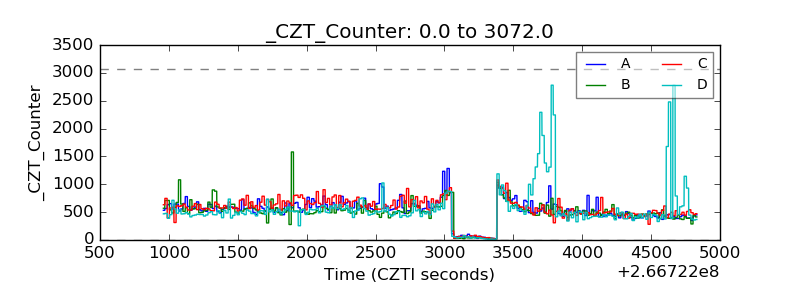 |
| +2.5 Volts monitor | 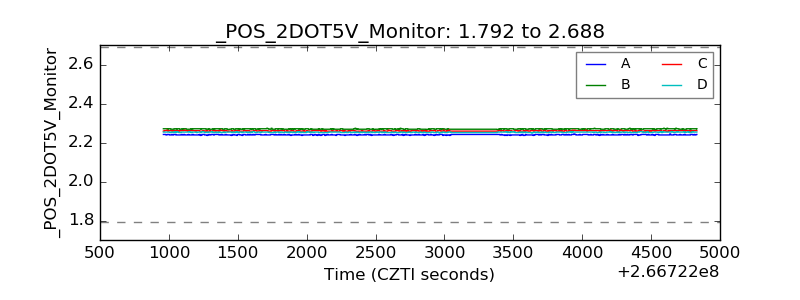 |
| +5 Volts monitor |  |
| _ROLL_ROT | 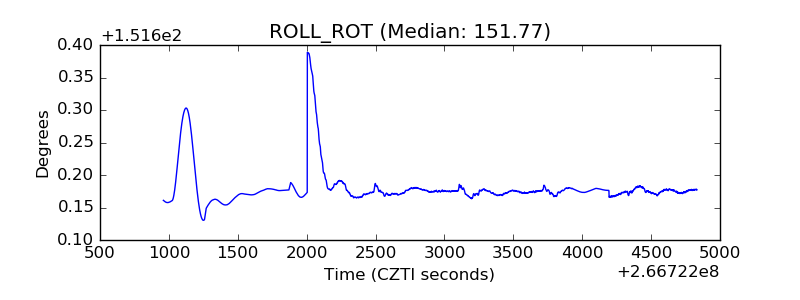 |
| _Roll_DEC |  |
| _Roll_RA | 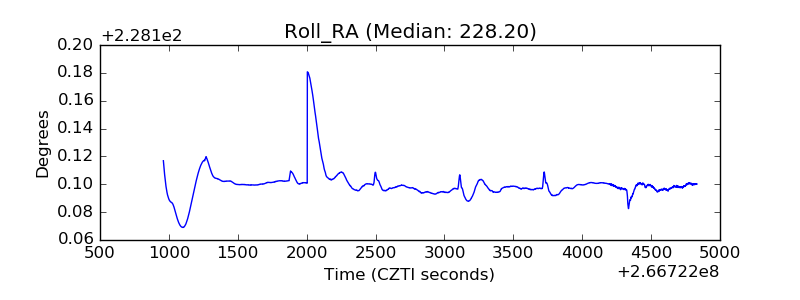 |
| Veto Counter |  |