| Param | Original file | Final file |
|---|---|---|
| Filename | modeM0/AS1A04_101T01_9000002170_14668cztM0_level2.evt | modeM0/AS1A04_101T01_9000002170_14668cztM0_level2_quad_clean.evt |
| Size (bytes) | 558,028,800 | 94,752,000 |
| Size | 532.2 MB | 90.4 MB |
| Events in quadrant A | 3,880,401 | 590,085 |
| Events in quadrant B | 3,827,271 | 586,382 |
| Events in quadrant C | 4,297,216 | 586,712 |
| Events in quadrant D | 4,374,350 | 572,272 |
| Mode M9 | |||
|---|---|---|---|
| Quadrant | BADHDUFLAG | Total packets | Discarded packets |
| A | 0 | 8 | 0 |
| B | 0 | 8 | 0 |
| C | 0 | 8 | 0 |
| D | 0 | 8 | 0 |
| Mode SS | |||
|---|---|---|---|
| Quadrant | BADHDUFLAG | Total packets | Discarded packets |
| A | 0 | 156 | 0 |
| B | 0 | 156 | 0 |
| C | 0 | 156 | 0 |
| D | 0 | 156 | 0 |
| Mode M0 | |||
|---|---|---|---|
| Quadrant | BADHDUFLAG | Total packets | Discarded packets |
| A | 0 | 16491 | 3 |
| B | 0 | 16394 | 2 |
| C | 0 | 17445 | 2 |
| D | 0 | 18375 | 2 |
| Quadrant | Total seconds | Saturated seconds | Saturation percentage |
|---|---|---|---|
| A | 7683 | 75 | 0.976181% |
| B | 7683 | 107 | 1.392685% |
| C | 7683 | 59 | 0.767929% |
| D | 7683 | 238 | 3.097748% |
Noise dominated data is calculated using 1-second bins in cleaned event files. If a bin has >2000 counts, and if more than 50% of those come from <1% of pixels, then it is considered to be noise-dominated and hence unusable.
| Quadrant | # 1 sec bins | Bins with >0 counts | Bins with >2000 counts | High rate bins dominated by noise | Noise dominated (total time) | Noise dominated (detector-on time) | Marked lightcurve |
|---|---|---|---|---|---|---|---|
| A | 8434 | 7685 | 2 | 2 | 0.02% | 0.03% | 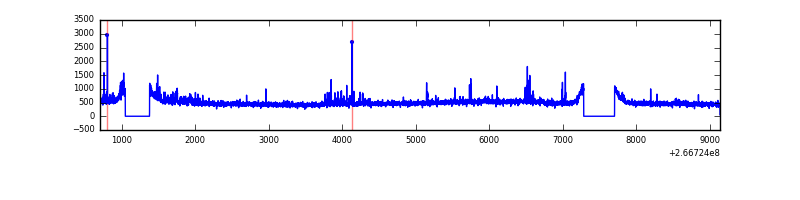 |
| B | 8434 | 7685 | 3 | 3 | 0.04% | 0.04% | 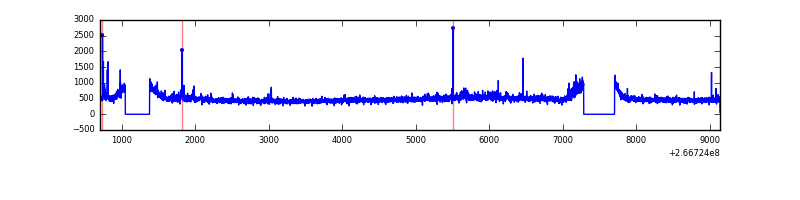 |
| C | 8434 | 7685 | 5 | 5 | 0.06% | 0.07% | 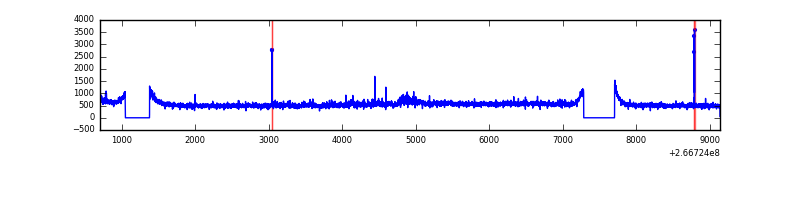 |
| D | 8434 | 7686 | 231 | 231 | 2.74% | 3.01% | 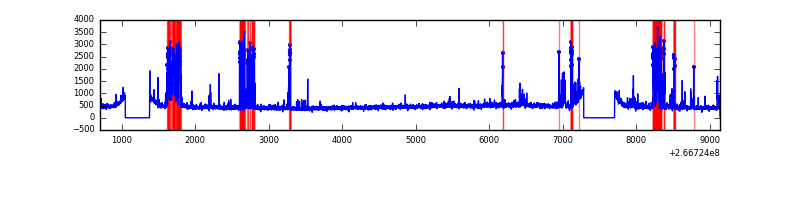 |
Top three noisy pixels from each quadrant. If the there are fewer than three noisy pixels in the level2.evt file, extra rows are filled as -1
| Pixel properties | Quadrant properties | ||||||
|---|---|---|---|---|---|---|---|
| Quadrant | DetID | PixID | Counts | Sigma | Mean | Median | Sigma |
| A | 8 | 15 | 220214 | 1159.32 | 932 | 910 | 189.2 |
| A | 12 | 189 | 24317 | 123.74 | 932 | 910 | 189.2 |
| A | 0 | 253 | 21769 | 110.27 | 932 | 910 | 189.2 |
| B | 0 | 219 | 65884 | 361.26 | 929 | 903 | 179.9 |
| B | 0 | 205 | 41221 | 224.14 | 929 | 903 | 179.9 |
| B | 0 | 190 | 23341 | 124.74 | 929 | 903 | 179.9 |
| C | 3 | 233 | 743327 | 3482.12 | 904 | 912 | 213.2 |
| C | 0 | 207 | 28215 | 128.06 | 904 | 912 | 213.2 |
| C | 13 | 61 | 6412 | 25.8 | 904 | 912 | 213.2 |
| D | 10 | 199 | 388842 | 1649.35 | 888 | 868 | 235.2 |
| D | 9 | 1 | 271037 | 1148.54 | 888 | 868 | 235.2 |
| D | 1 | 52 | 154583 | 653.47 | 888 | 868 | 235.2 |
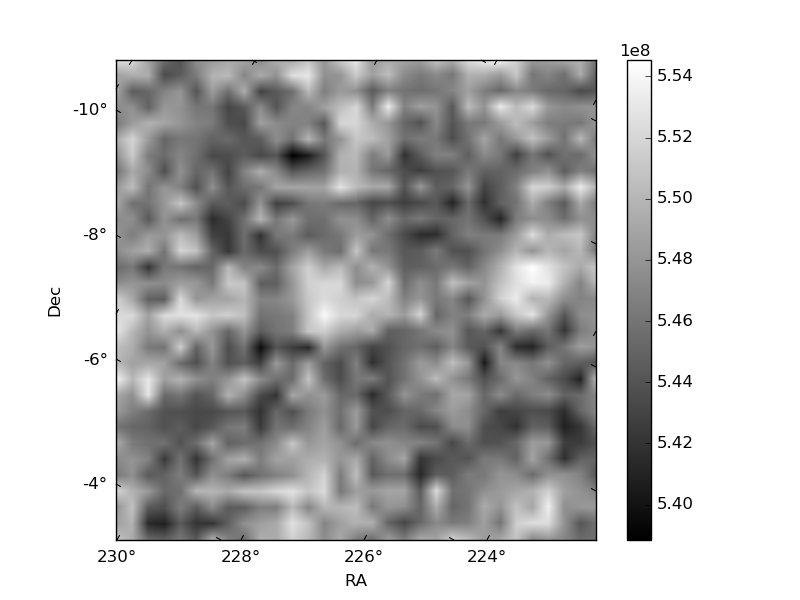
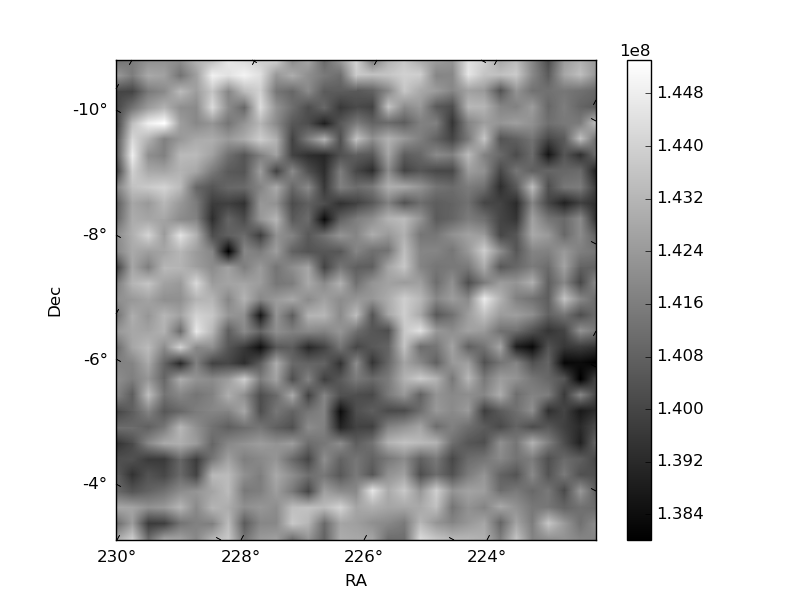
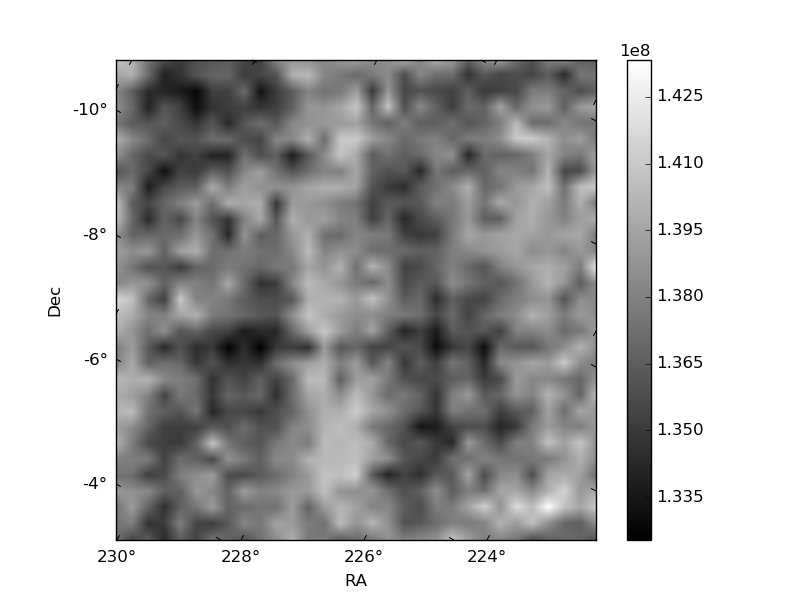
Histogram calculated using DETX and DETY for each event in the final _common_clean file
| Quadrant A | 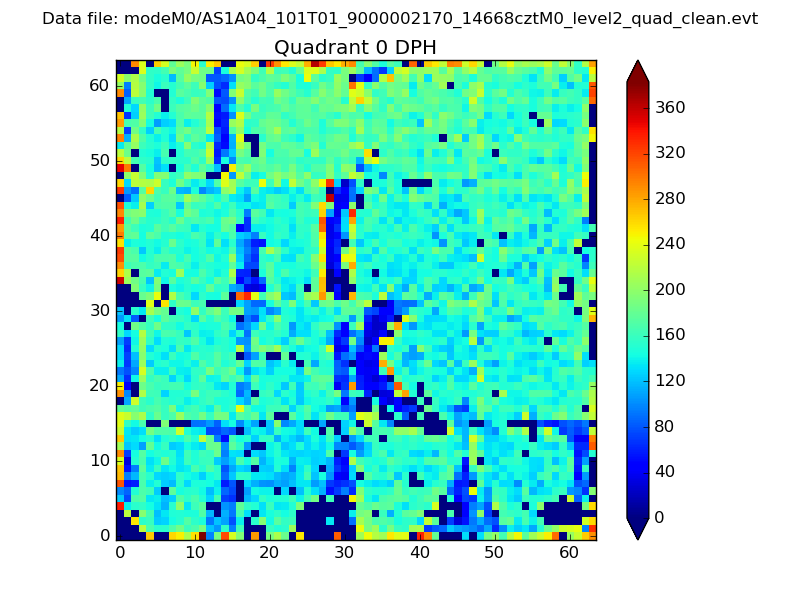 |
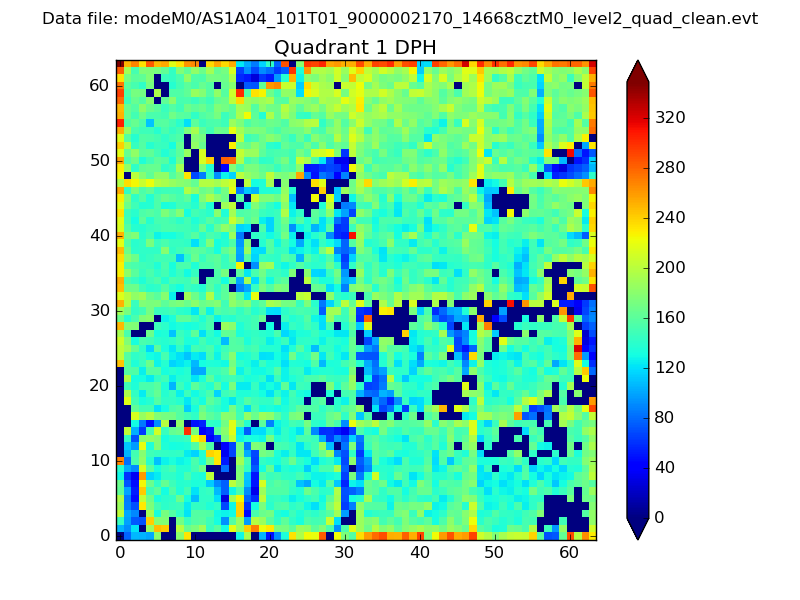 |
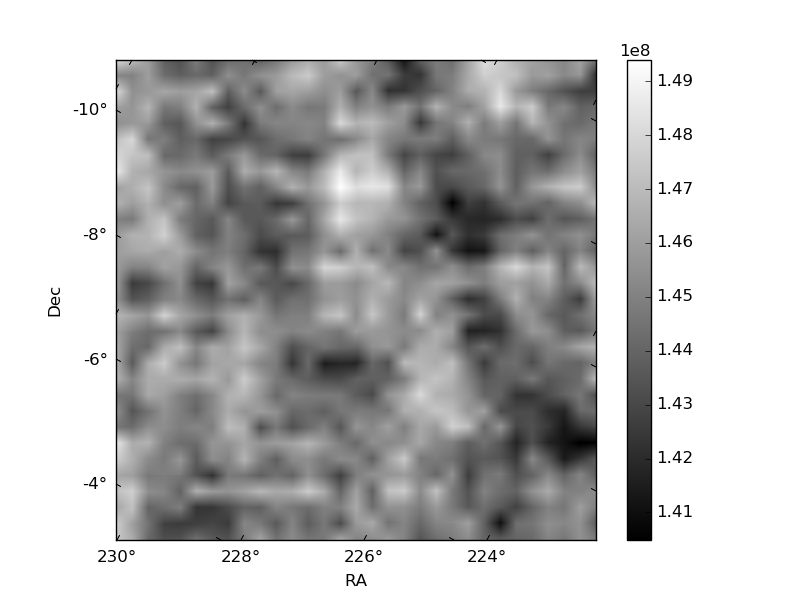
Quadrant B |
|---|---|---|---|
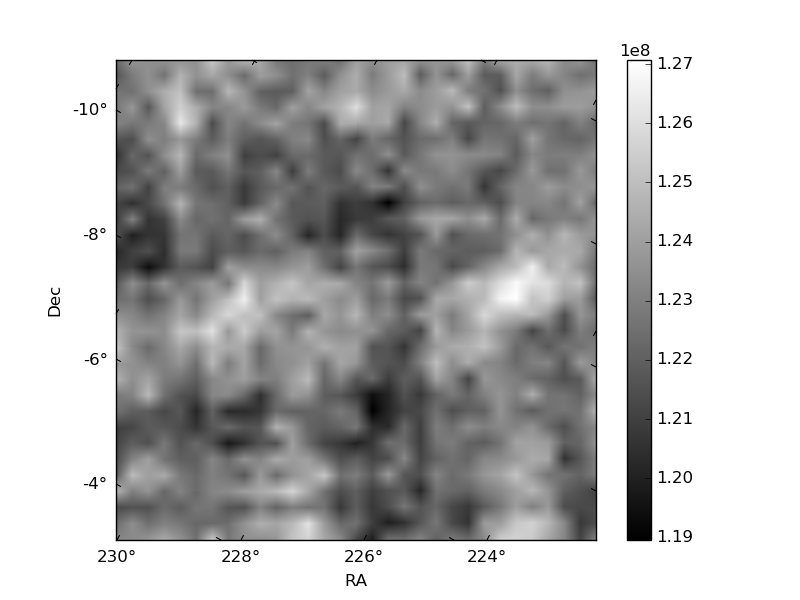
| Quadrant D | 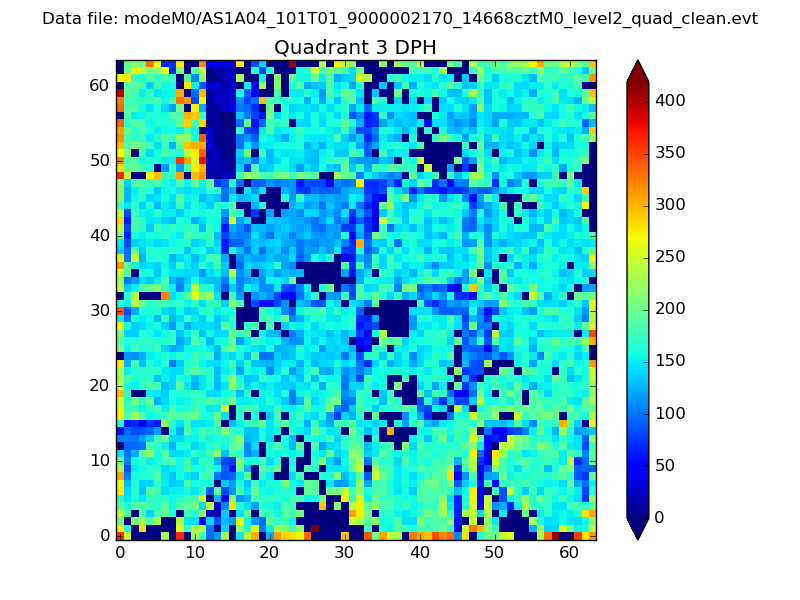 |
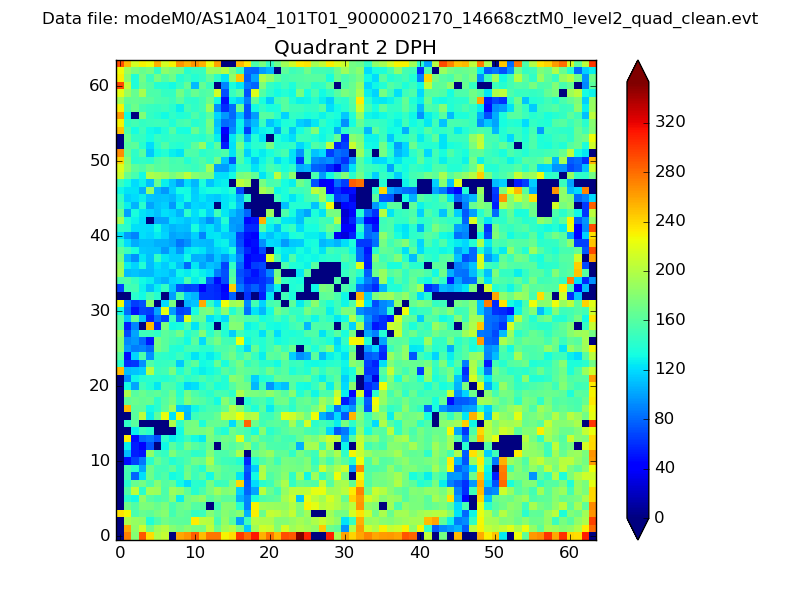 |
Quadrant C |
| Plot type | Count rate plots | Images |
|---|---|---|
| Comparison with Poisson distribution Blue bars denote a histogram of data divided into 1 sec bins. Red curve is a Poisson curve with rate = median count rate of data. |
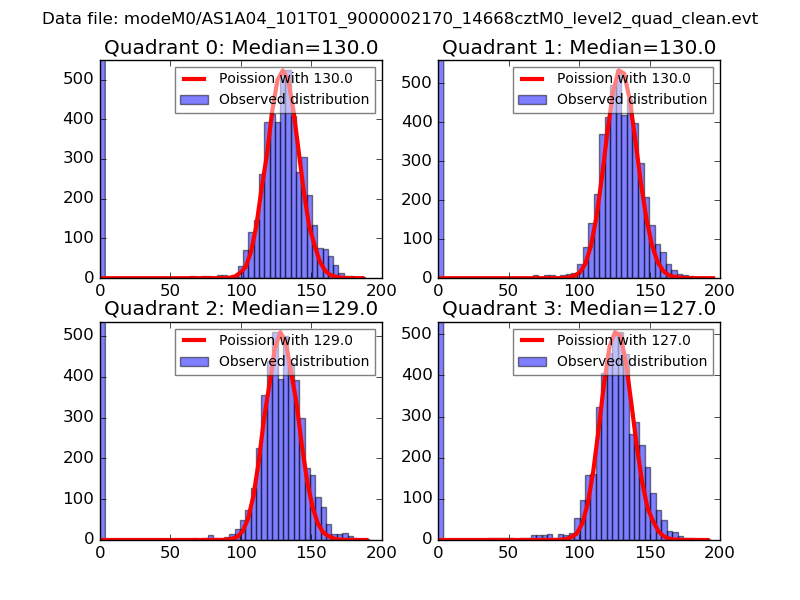 |
 |
| Quadrant-wise count rates Data is divided into 100 sec bins |
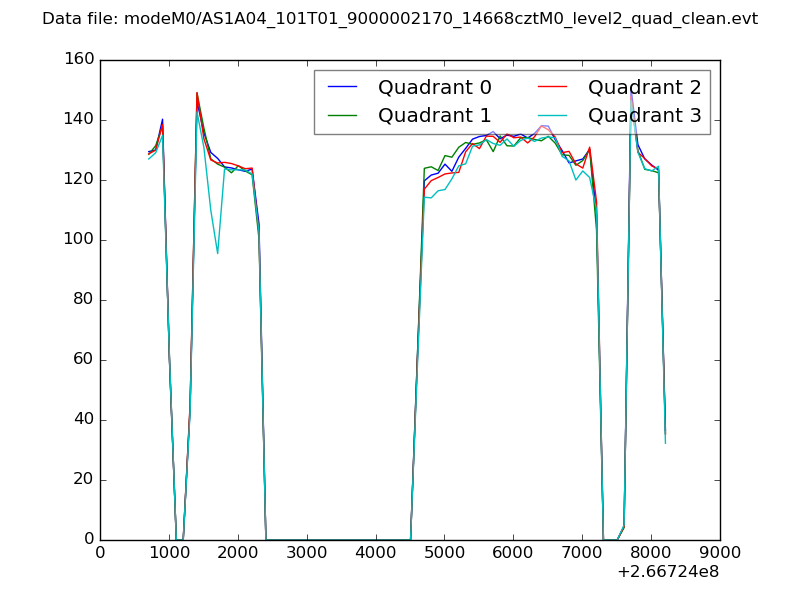 |
|
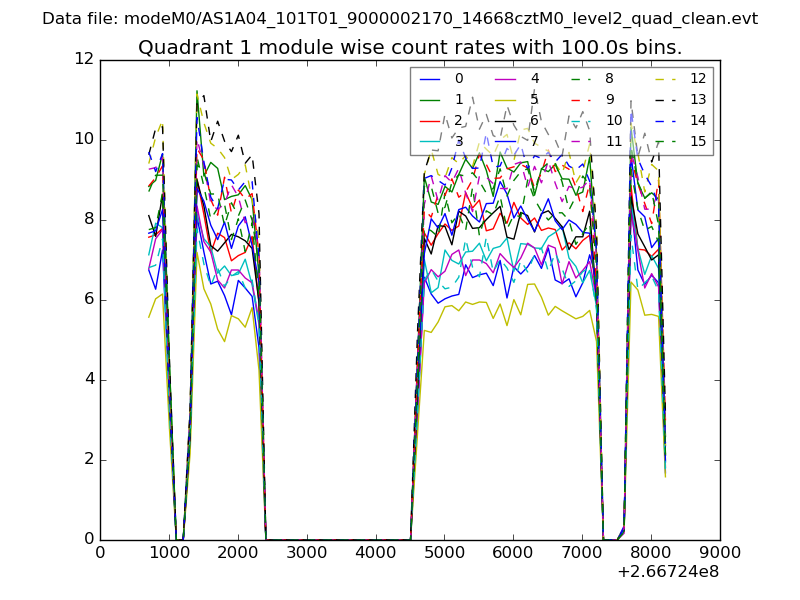
| Module-wise count rates for Quadrant A Data is divided into 100 sec bins |
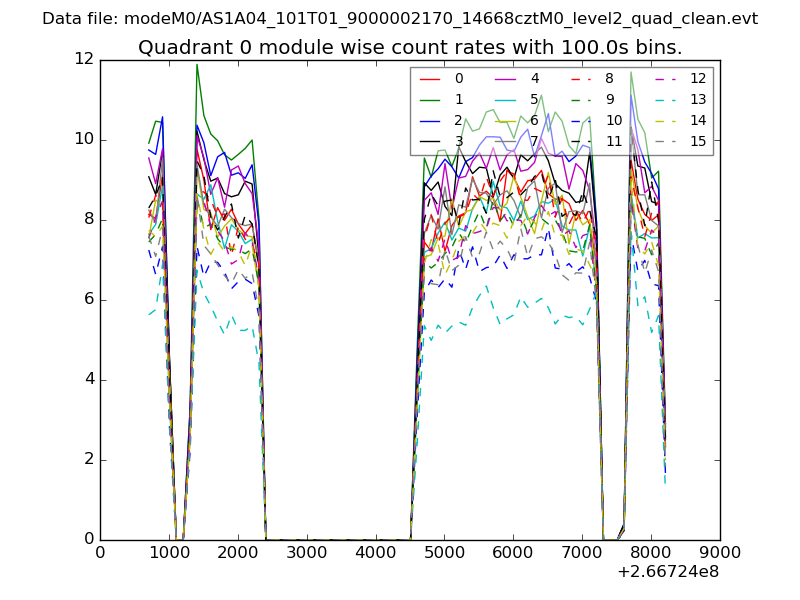 |
 |
| Module-wise count rates for Quadrant B Data is divided into 100 sec bins |
 |
 |
| Module-wise count rates for Quadrant C Data is divided into 100 sec bins |
 |
 |
| Module-wise count rates for Quadrant D Data is divided into 100 sec bins |
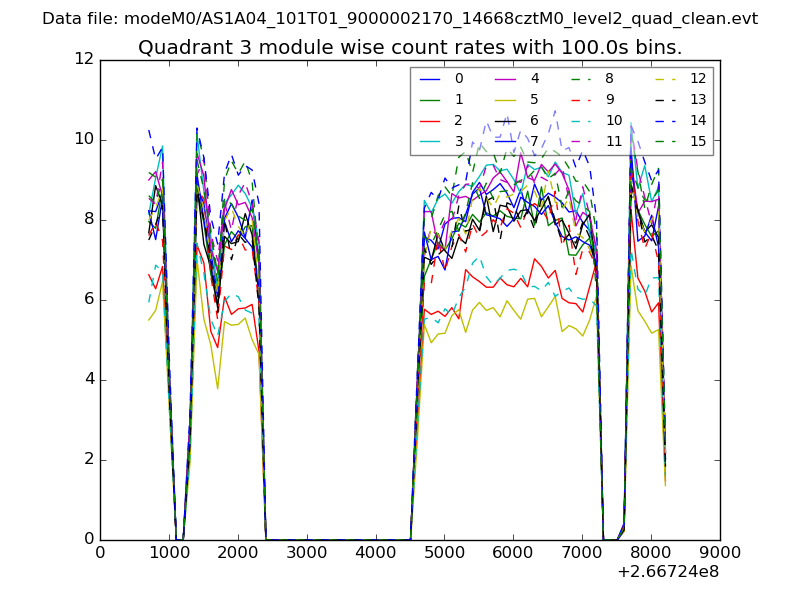 |
 |
| Parameter | Plot |
|---|---|
| CZT HV Monitor |  |
| D_VDD | 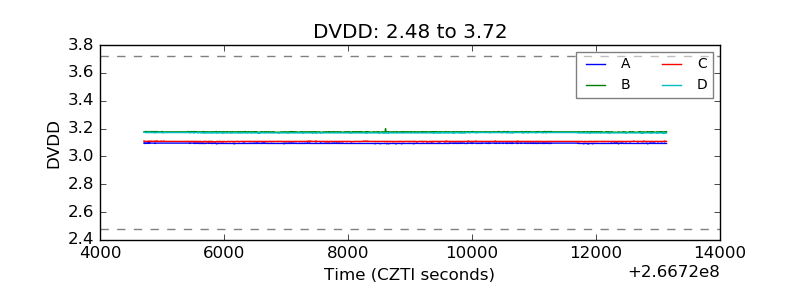 |
| Temperature 1 | 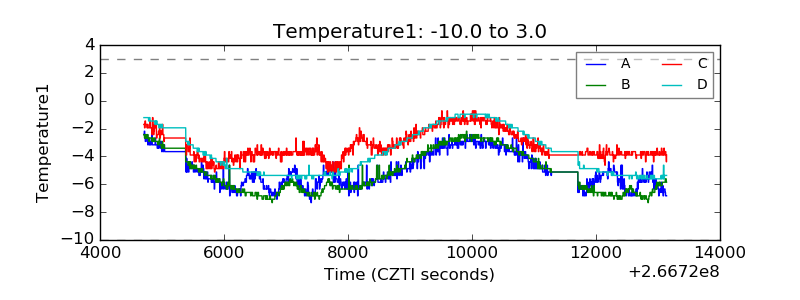 |
| Veto HV Monitor | 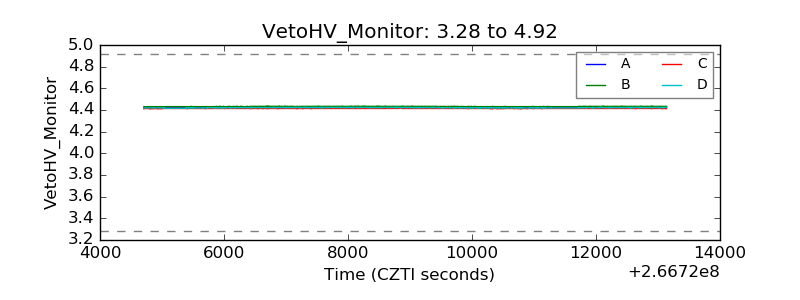 |
| Veto LLD | 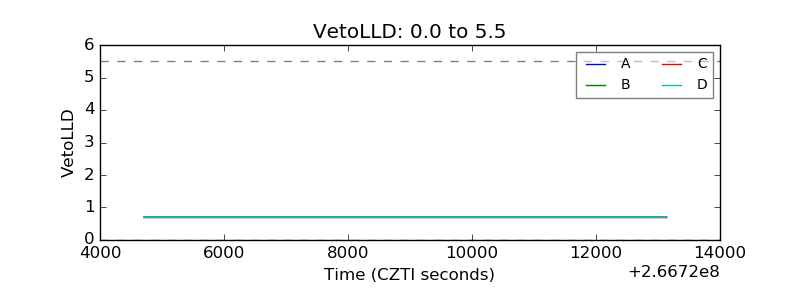 |
| Alpha Counter | 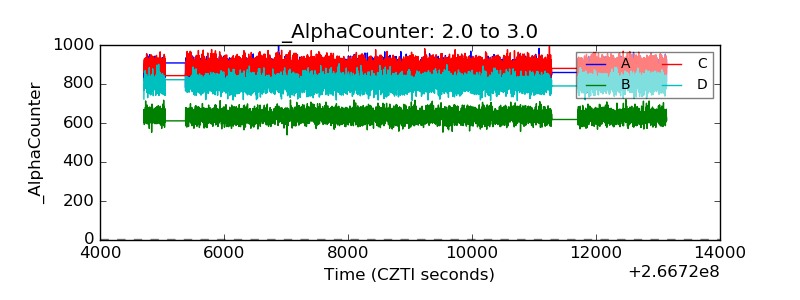 |
| _CPM_Rate | 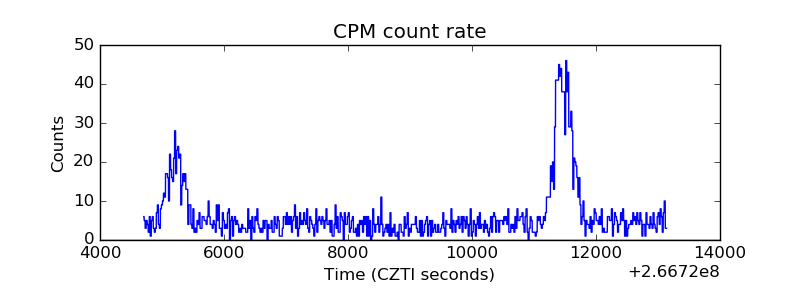 |
| CZT Counter | 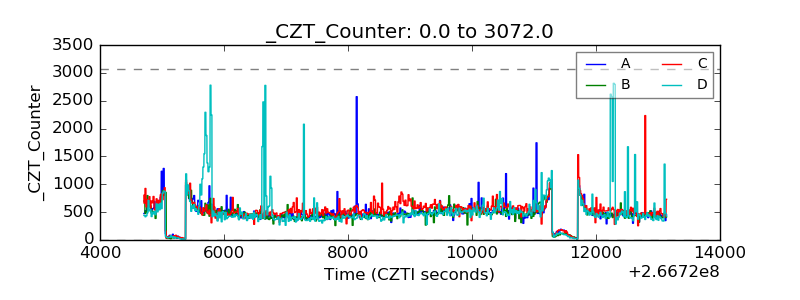 |
| +2.5 Volts monitor | 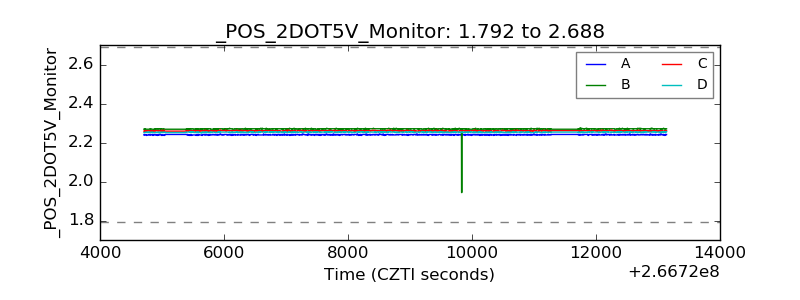 |
| +5 Volts monitor | 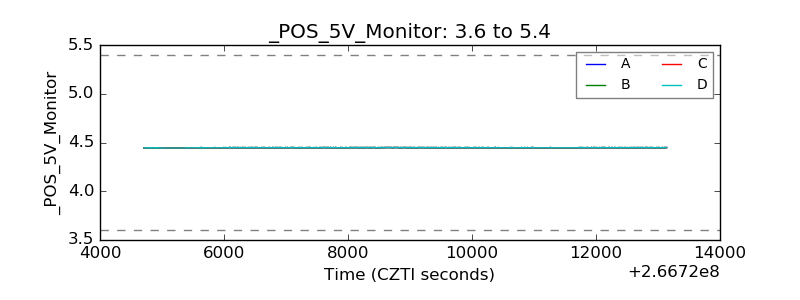 |
| _ROLL_ROT |  |
| _Roll_DEC |  |
| _Roll_RA | 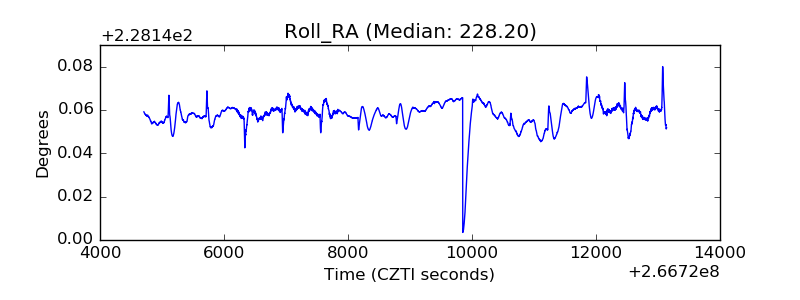 |
| Veto Counter |  |