| Param | Original file | Final file |
|---|---|---|
| Filename | modeM0/AS1A04_101T01_9000002170_14670cztM0_level2.evt | modeM0/AS1A04_101T01_9000002170_14670cztM0_level2_quad_clean.evt |
| Size (bytes) | 985,697,280 | 161,591,040 |
| Size | 940.0 MB | 154.1 MB |
| Events in quadrant A | 6,721,408 | 999,562 |
| Events in quadrant B | 6,798,896 | 986,027 |
| Events in quadrant C | 7,822,022 | 991,226 |
| Events in quadrant D | 7,580,193 | 967,991 |
| Mode M9 | |||
|---|---|---|---|
| Quadrant | BADHDUFLAG | Total packets | Discarded packets |
| A | 0 | 18 | 0 |
| B | 0 | 18 | 0 |
| C | 0 | 18 | 0 |
| D | 0 | 18 | 0 |
| Mode SS | |||
|---|---|---|---|
| Quadrant | BADHDUFLAG | Total packets | Discarded packets |
| A | 0 | 280 | 0 |
| B | 0 | 280 | 0 |
| C | 0 | 280 | 0 |
| D | 0 | 280 | 0 |
| Mode M0 | |||
|---|---|---|---|
| Quadrant | BADHDUFLAG | Total packets | Discarded packets |
| A | 0 | 28601 | 4 |
| B | 0 | 28848 | 3 |
| C | 0 | 31678 | 3 |
| D | 0 | 32032 | 3 |
| Quadrant | Total seconds | Saturated seconds | Saturation percentage |
|---|---|---|---|
| A | 13740 | 139 | 1.011645% |
| B | 13740 | 181 | 1.317322% |
| C | 13740 | 124 | 0.902475% |
| D | 13740 | 453 | 3.296943% |
Noise dominated data is calculated using 1-second bins in cleaned event files. If a bin has >2000 counts, and if more than 50% of those come from <1% of pixels, then it is considered to be noise-dominated and hence unusable.
| Quadrant | # 1 sec bins | Bins with >0 counts | Bins with >2000 counts | High rate bins dominated by noise | Noise dominated (total time) | Noise dominated (detector-on time) | Marked lightcurve |
|---|---|---|---|---|---|---|---|
| A | 15476 | 13741 | 1 | 1 | 0.01% | 0.01% | 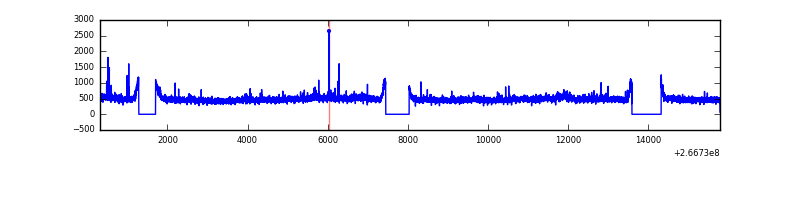 |
| B | 15476 | 13741 | 4 | 4 | 0.03% | 0.03% | 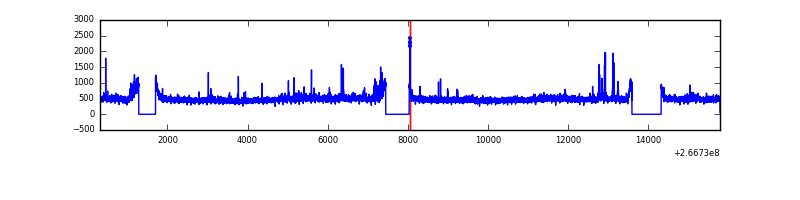 |
| C | 15476 | 13741 | 3 | 3 | 0.02% | 0.02% | 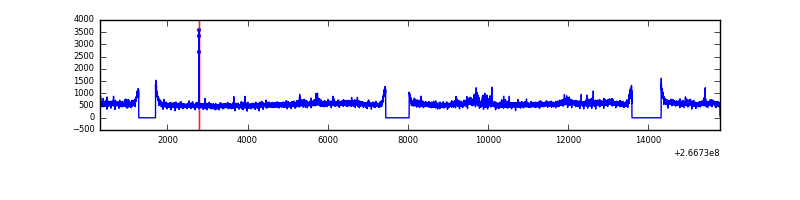 |
| D | 15476 | 13742 | 378 | 378 | 2.44% | 2.75% | 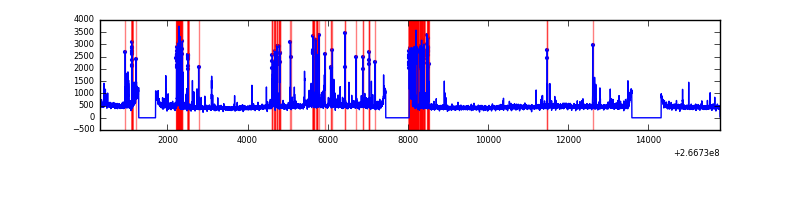 |
Top three noisy pixels from each quadrant. If the there are fewer than three noisy pixels in the level2.evt file, extra rows are filled as -1
| Pixel properties | Quadrant properties | ||||||
|---|---|---|---|---|---|---|---|
| Quadrant | DetID | PixID | Counts | Sigma | Mean | Median | Sigma |
| A | 12 | 189 | 148516 | 439.71 | 1667 | 1633 | 334.0 |
| A | 8 | 15 | 101533 | 299.06 | 1667 | 1633 | 334.0 |
| A | 1 | 162 | 32313 | 91.84 | 1667 | 1633 | 334.0 |
| B | 0 | 219 | 121547 | 372.6 | 1659 | 1617 | 321.9 |
| B | 0 | 197 | 60394 | 182.61 | 1659 | 1617 | 321.9 |
| B | 0 | 214 | 51116 | 153.79 | 1659 | 1617 | 321.9 |
| C | 3 | 233 | 1496391 | 3972.55 | 1616 | 1625 | 376.3 |
| C | 0 | 207 | 20664 | 50.6 | 1616 | 1625 | 376.3 |
| C | 13 | 61 | 11502 | 26.25 | 1616 | 1625 | 376.3 |
| D | 10 | 199 | 848631 | 2051.06 | 1580 | 1545 | 413.0 |
| D | 1 | 52 | 378586 | 912.93 | 1580 | 1545 | 413.0 |
| D | 12 | 110 | 94964 | 226.2 | 1580 | 1545 | 413.0 |
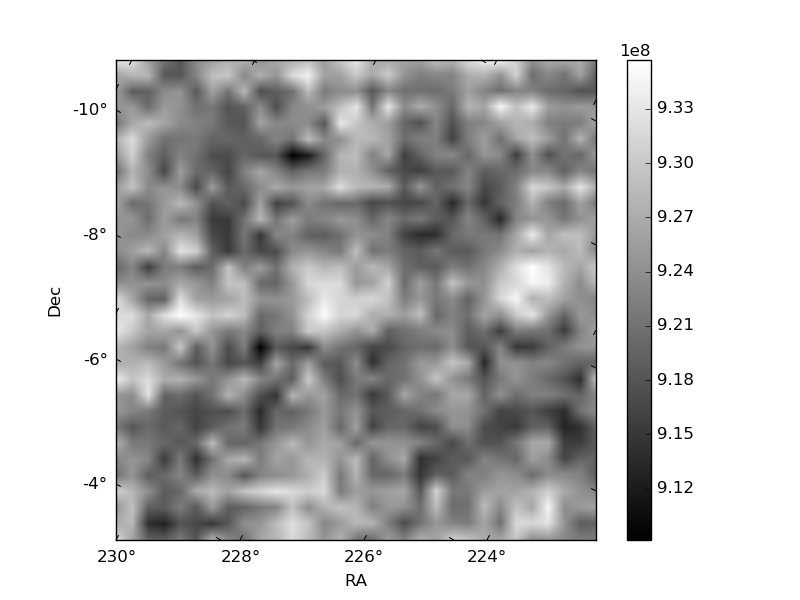
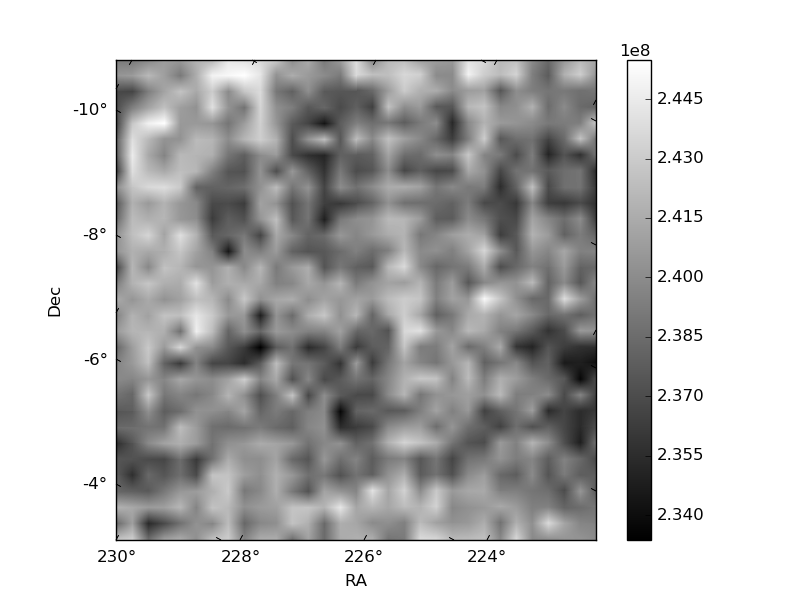
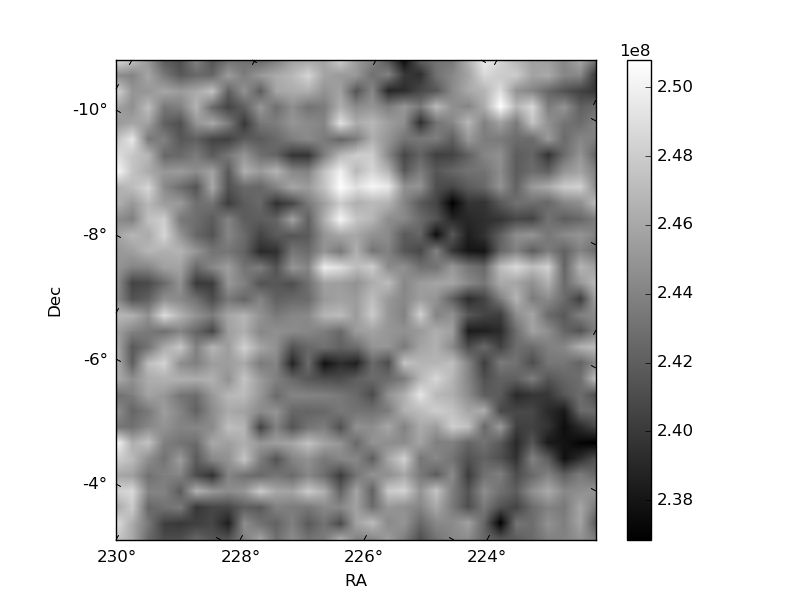
Histogram calculated using DETX and DETY for each event in the final _common_clean file
| Quadrant A | 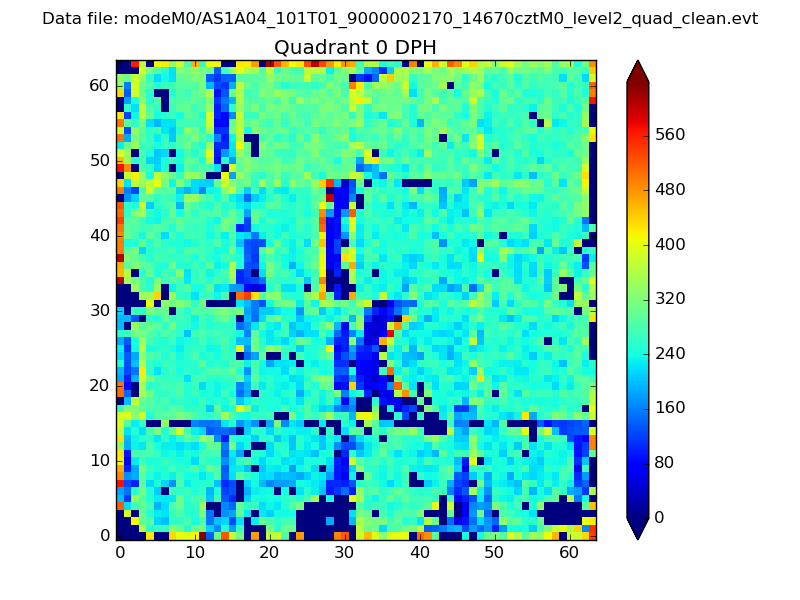 |
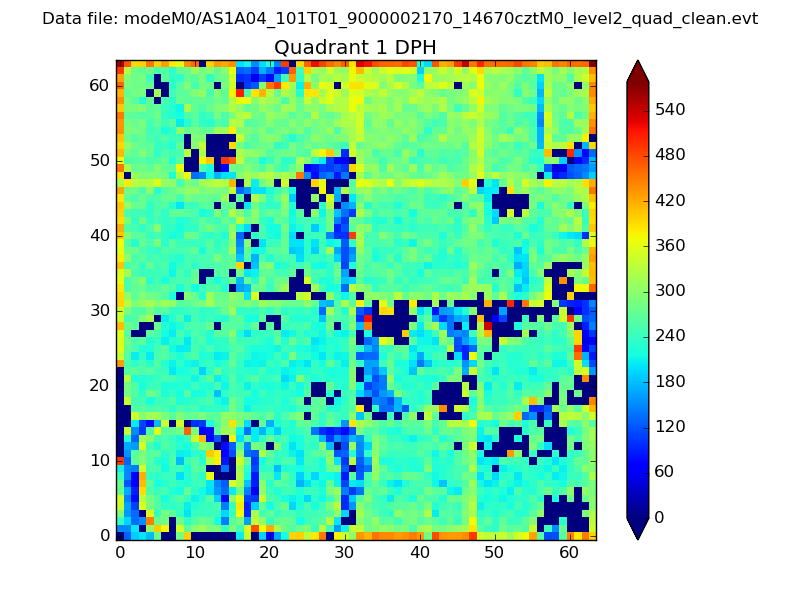 |
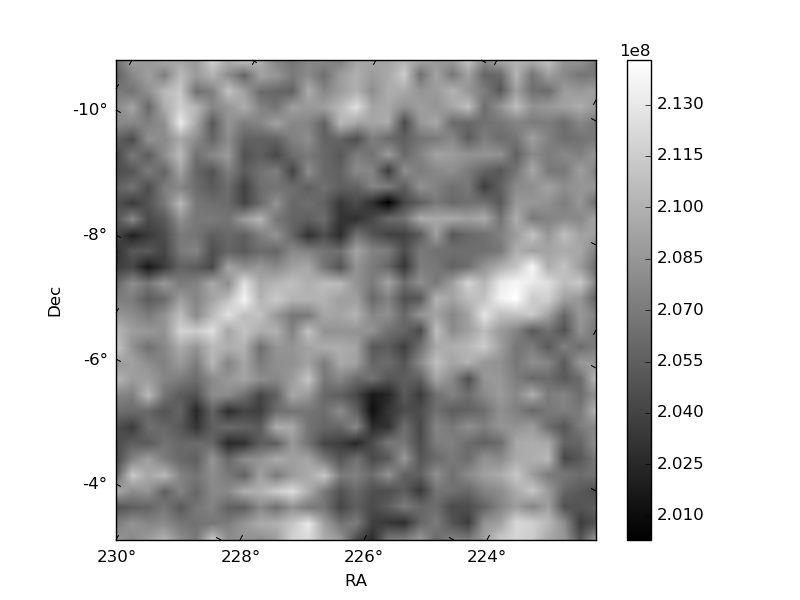
Quadrant B |
|---|---|---|---|
| Quadrant D | 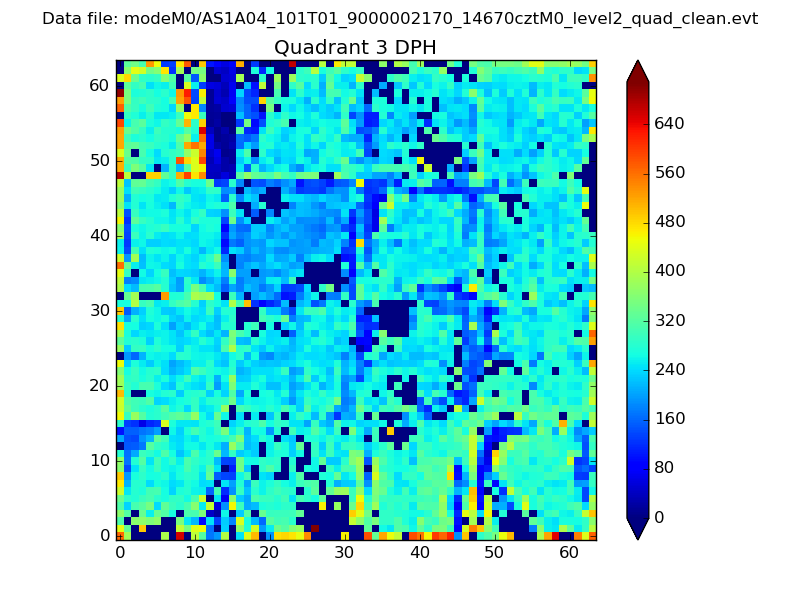 |
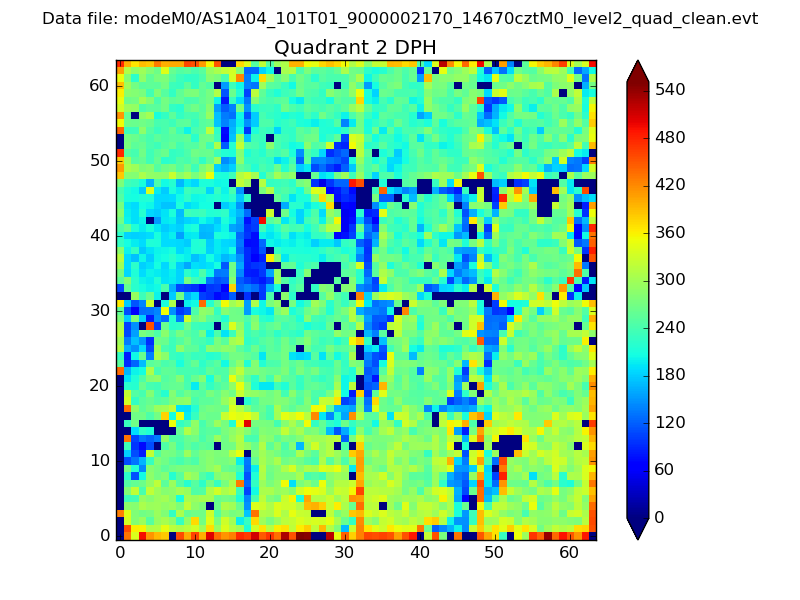 |
Quadrant C |
| Plot type | Count rate plots | Images |
|---|---|---|
| Comparison with Poisson distribution Blue bars denote a histogram of data divided into 1 sec bins. Red curve is a Poisson curve with rate = median count rate of data. |
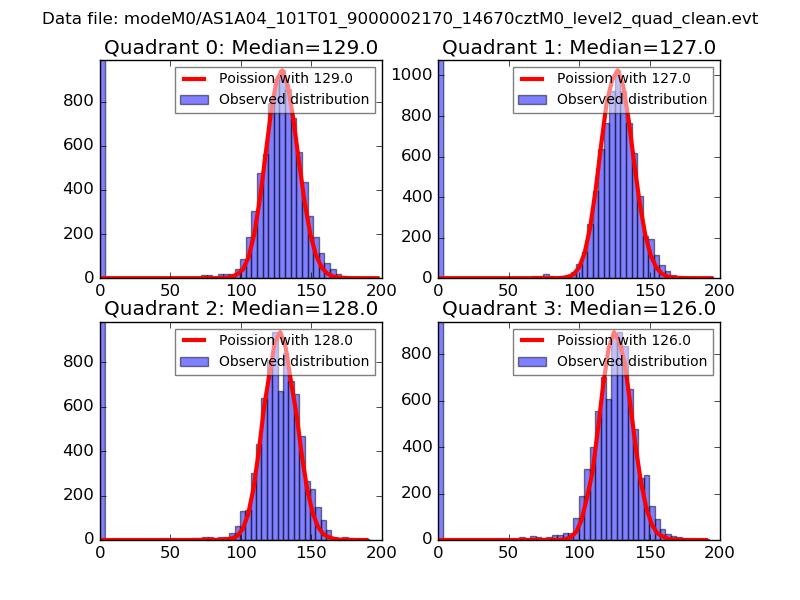 |
 |
| Quadrant-wise count rates Data is divided into 100 sec bins |
 |
|
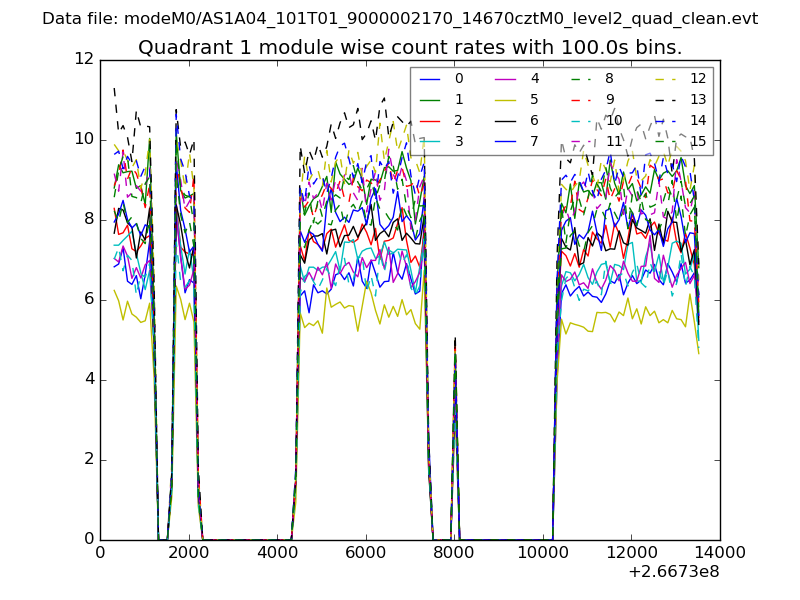
| Module-wise count rates for Quadrant A Data is divided into 100 sec bins |
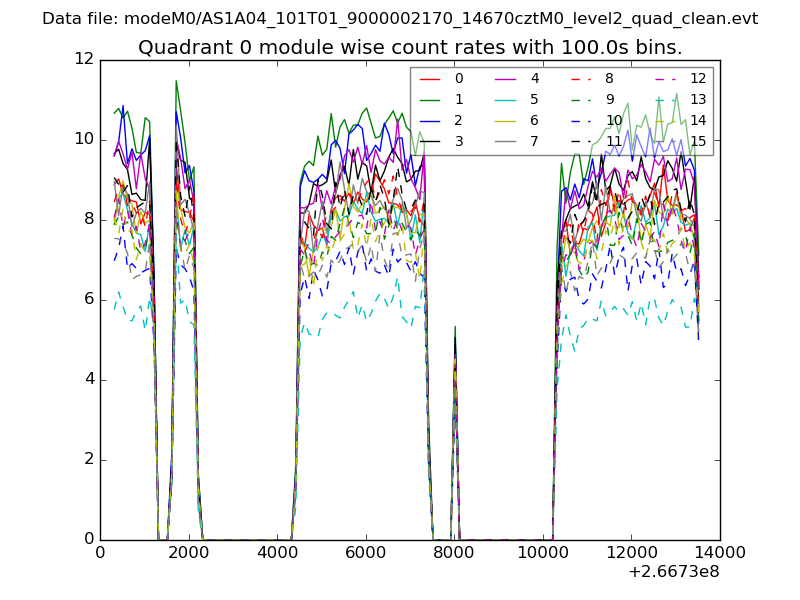 |
 |
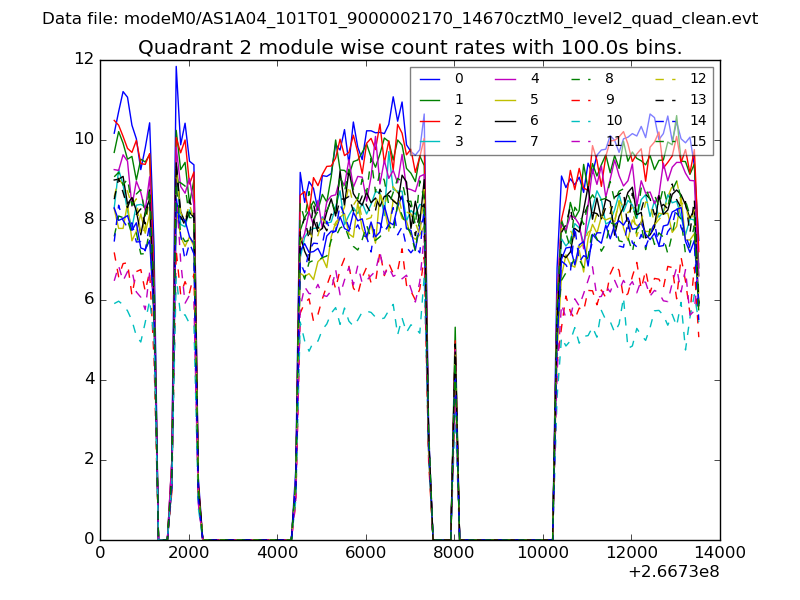
| Module-wise count rates for Quadrant B Data is divided into 100 sec bins |
 |
 |
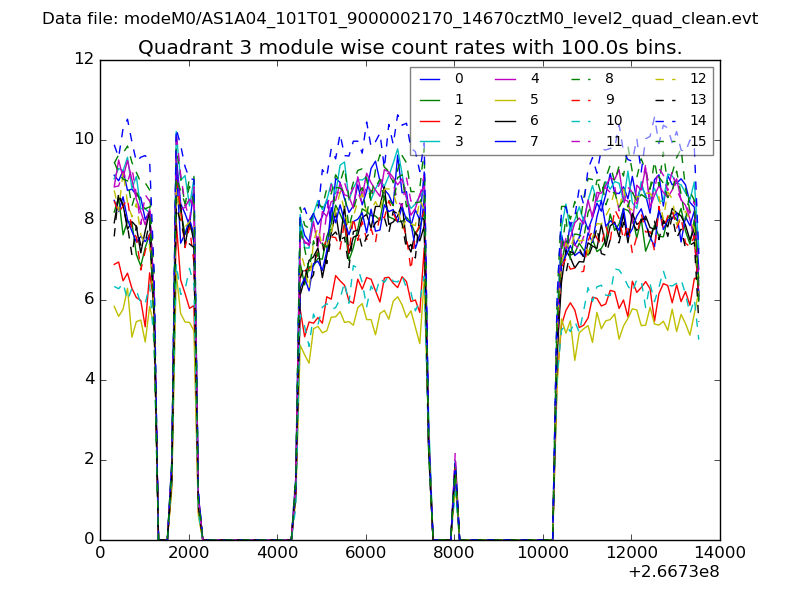
| Module-wise count rates for Quadrant C Data is divided into 100 sec bins |
 |
 |
| Module-wise count rates for Quadrant D Data is divided into 100 sec bins |
 |
 |
| Parameter | Plot |
|---|---|
| CZT HV Monitor | 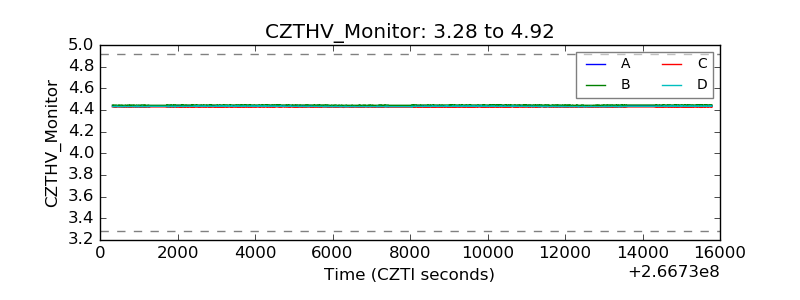 |
| D_VDD | 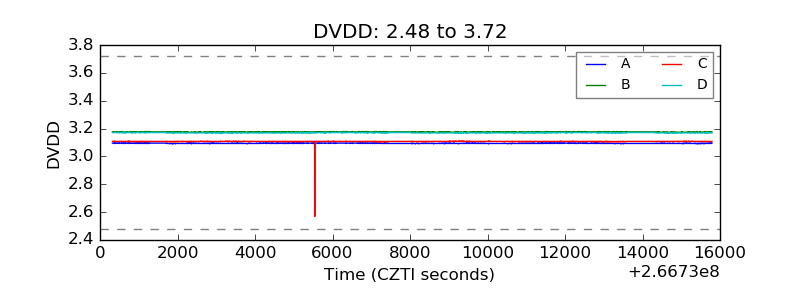 |
| Temperature 1 | 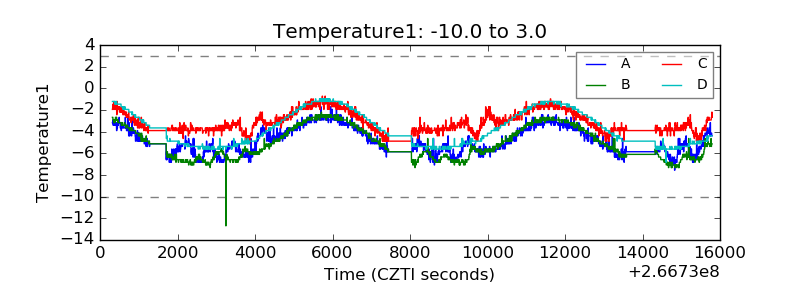 |
| Veto HV Monitor | 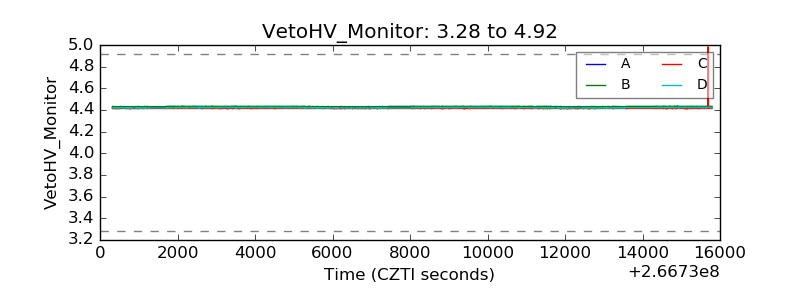 |
| Veto LLD | 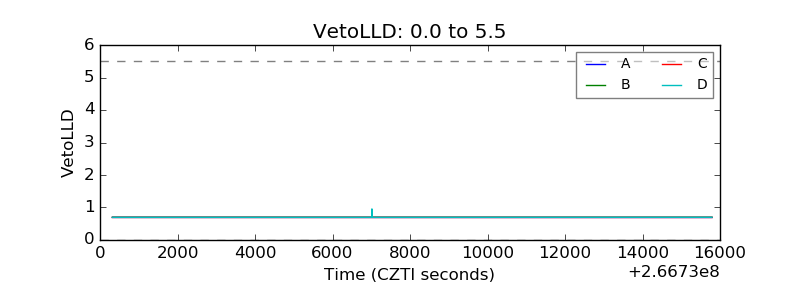 |
| Alpha Counter | 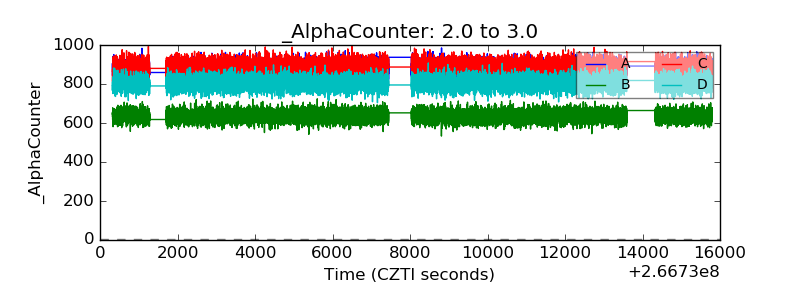 |
| _CPM_Rate | 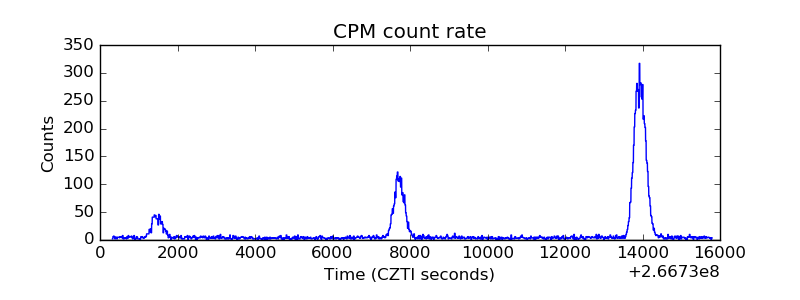 |
| CZT Counter | 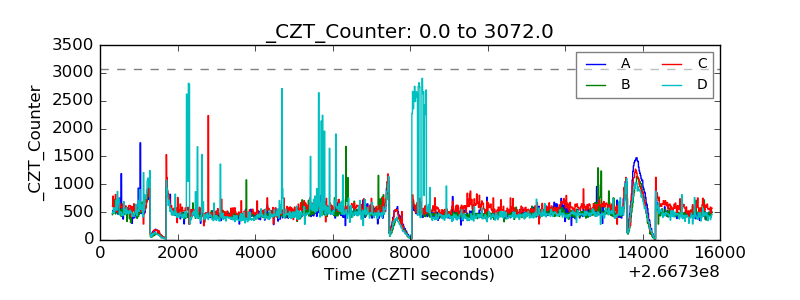 |
| +2.5 Volts monitor |  |
| +5 Volts monitor |  |
| _ROLL_ROT | 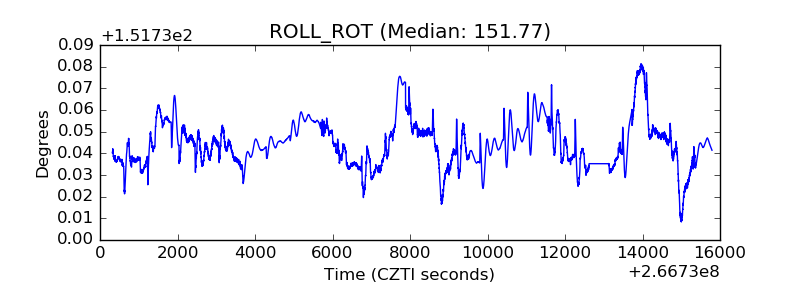 |
| _Roll_DEC |  |
| _Roll_RA | 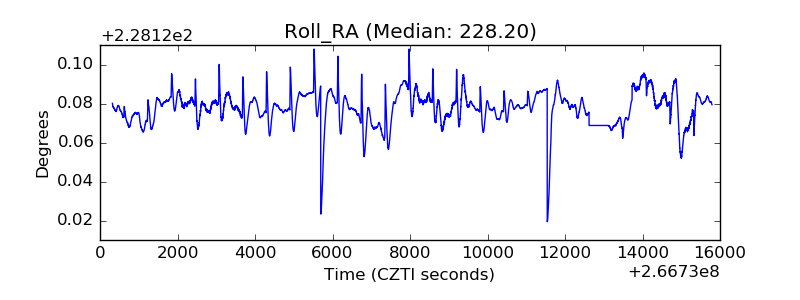 |
| Veto Counter | 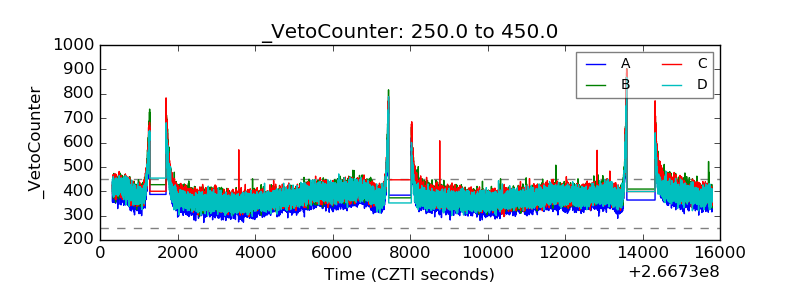 |