| Param | Original file | Final file |
|---|---|---|
| Filename | modeM0/AS1A04_101T01_9000002170_14671cztM0_level2.evt | modeM0/AS1A04_101T01_9000002170_14671cztM0_level2_quad_clean.evt |
| Size (bytes) | 500,529,600 | 81,158,400 |
| Size | 477.3 MB | 77.4 MB |
| Events in quadrant A | 3,505,144 | 494,816 |
| Events in quadrant B | 3,529,372 | 490,294 |
| Events in quadrant C | 4,168,260 | 490,565 |
| Events in quadrant D | 3,468,461 | 482,049 |
| Mode M9 | |||
|---|---|---|---|
| Quadrant | BADHDUFLAG | Total packets | Discarded packets |
| A | 0 | 16 | 0 |
| B | 0 | 16 | 0 |
| C | 0 | 16 | 0 |
| D | 0 | 16 | 0 |
| Mode SS | |||
|---|---|---|---|
| Quadrant | BADHDUFLAG | Total packets | Discarded packets |
| A | 0 | 148 | 0 |
| B | 0 | 148 | 0 |
| C | 0 | 148 | 0 |
| D | 0 | 148 | 0 |
| Mode M0 | |||
|---|---|---|---|
| Quadrant | BADHDUFLAG | Total packets | Discarded packets |
| A | 0 | 15029 | 3 |
| B | 0 | 14859 | 2 |
| C | 0 | 16830 | 2 |
| D | 0 | 15135 | 2 |
| Quadrant | Total seconds | Saturated seconds | Saturation percentage |
|---|---|---|---|
| A | 7176 | 93 | 1.295987% |
| B | 7176 | 103 | 1.435340% |
| C | 7176 | 88 | 1.226310% |
| D | 7176 | 94 | 1.309922% |
Noise dominated data is calculated using 1-second bins in cleaned event files. If a bin has >2000 counts, and if more than 50% of those come from <1% of pixels, then it is considered to be noise-dominated and hence unusable.
| Quadrant | # 1 sec bins | Bins with >0 counts | Bins with >2000 counts | High rate bins dominated by noise | Noise dominated (total time) | Noise dominated (detector-on time) | Marked lightcurve |
|---|---|---|---|---|---|---|---|
| A | 8797 | 7177 | 0 | 0 | 0.00% | 0.00% | 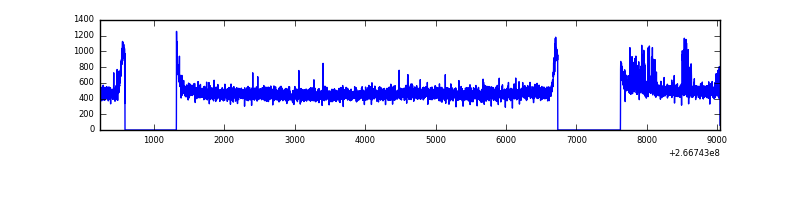 |
| B | 8797 | 7177 | 0 | 0 | 0.00% | 0.00% | 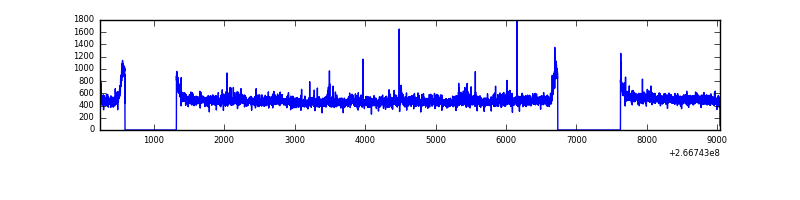 |
| C | 8797 | 7177 | 1 | 1 | 0.01% | 0.01% | 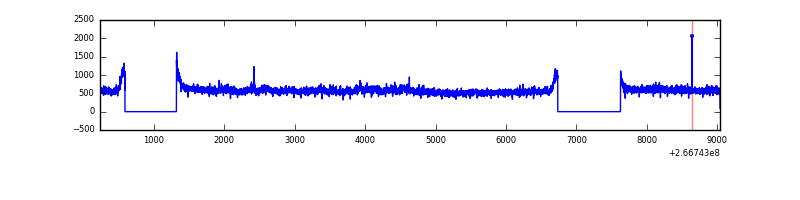 |
| D | 8797 | 7177 | 24 | 24 | 0.27% | 0.33% | 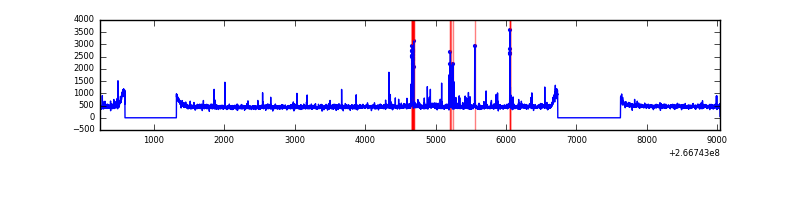 |
Top three noisy pixels from each quadrant. If the there are fewer than three noisy pixels in the level2.evt file, extra rows are filled as -1
| Pixel properties | Quadrant properties | ||||||
|---|---|---|---|---|---|---|---|
| Quadrant | DetID | PixID | Counts | Sigma | Mean | Median | Sigma |
| A | 0 | 253 | 73226 | 402.9 | 887 | 869 | 179.6 |
| A | 8 | 15 | 16426 | 86.62 | 887 | 869 | 179.6 |
| A | 0 | 226 | 7928 | 39.31 | 887 | 869 | 179.6 |
| B | 0 | 214 | 29620 | 168.18 | 884 | 860 | 171.0 |
| B | 12 | 111 | 20768 | 116.42 | 884 | 860 | 171.0 |
| B | 0 | 205 | 19583 | 109.49 | 884 | 860 | 171.0 |
| C | 3 | 233 | 806466 | 4010.25 | 859 | 863 | 200.9 |
| C | 12 | 4 | 6789 | 29.5 | 859 | 863 | 200.9 |
| C | 13 | 61 | 6085 | 25.99 | 859 | 863 | 200.9 |
| D | 10 | 70 | 59571 | 272.05 | 855 | 831 | 215.9 |
| D | 1 | 52 | 58430 | 266.77 | 855 | 831 | 215.9 |
| D | 2 | 152 | 32925 | 148.64 | 855 | 831 | 215.9 |
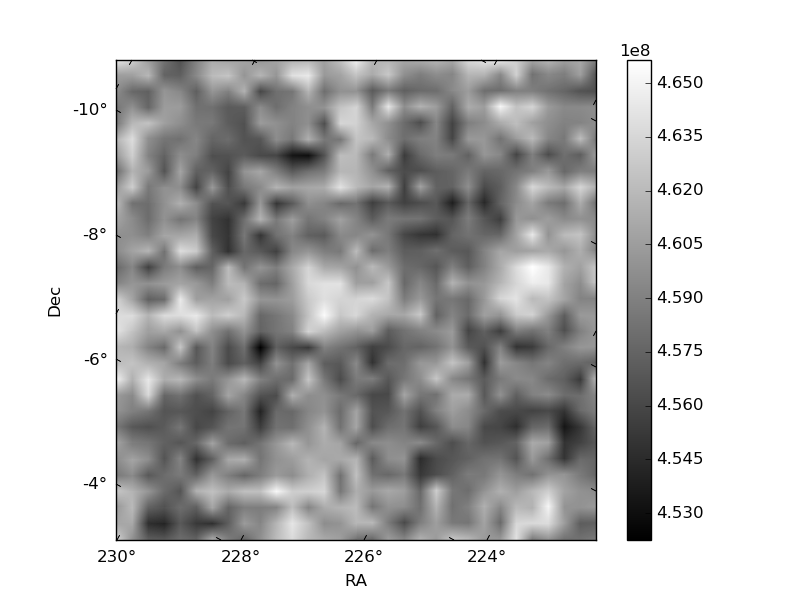
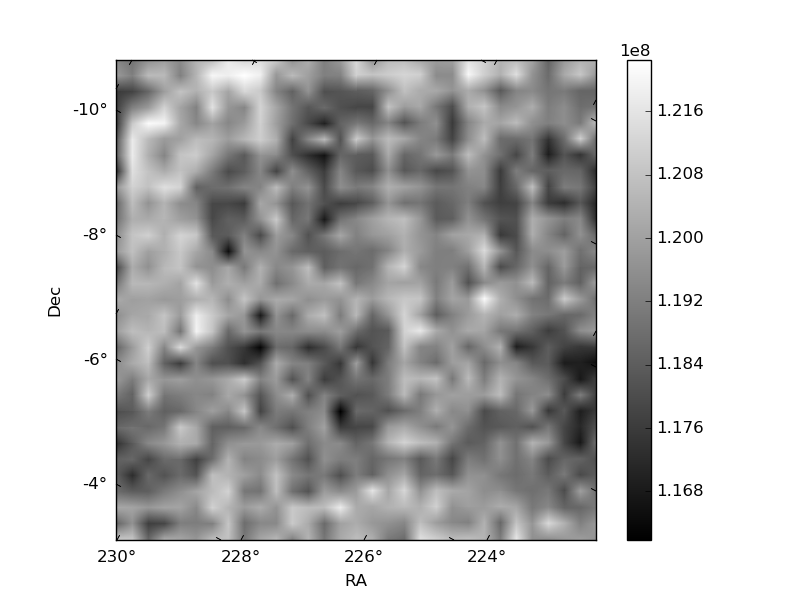
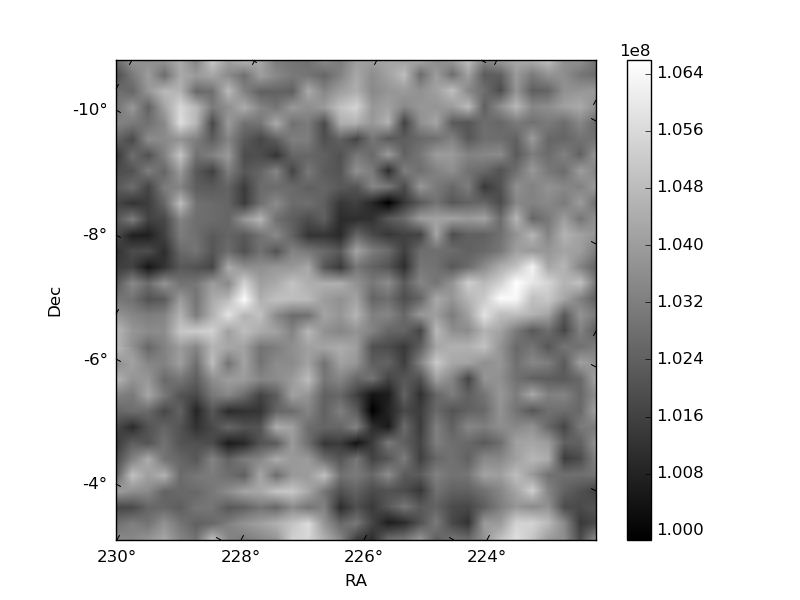
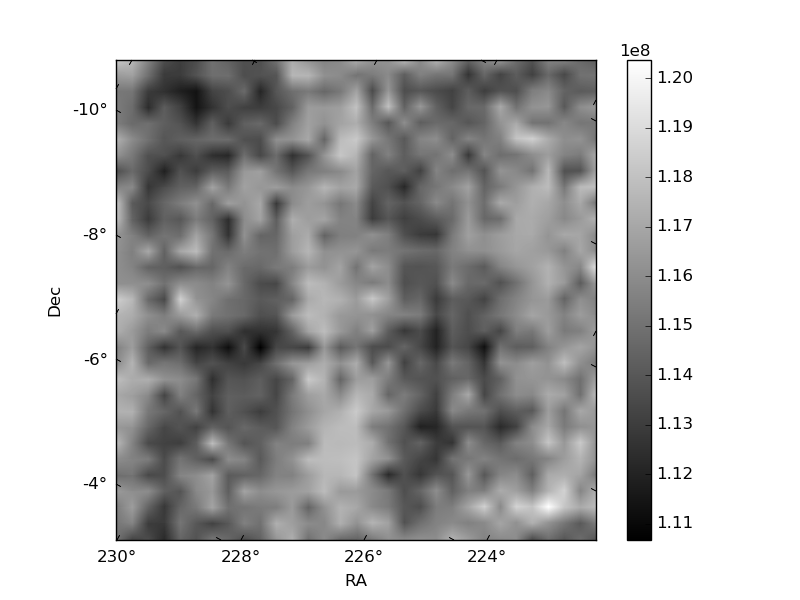
Histogram calculated using DETX and DETY for each event in the final _common_clean file
| Quadrant A | 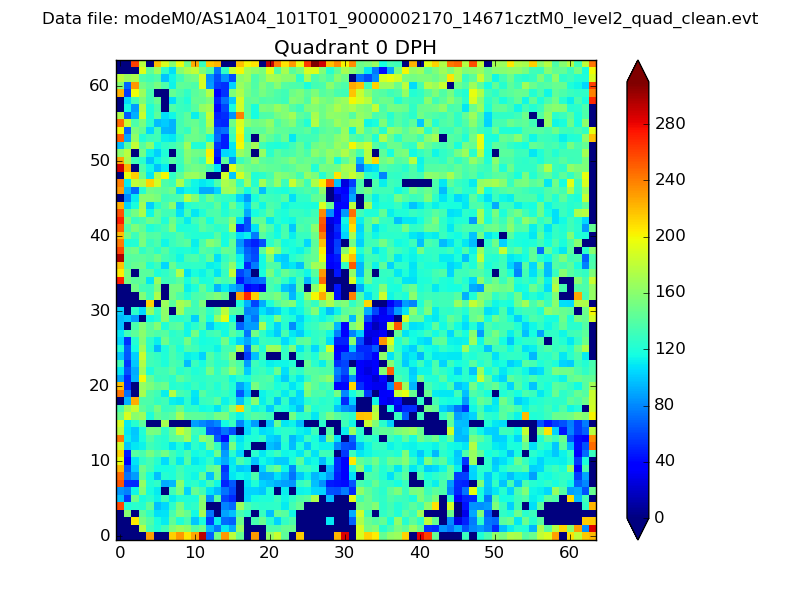 |
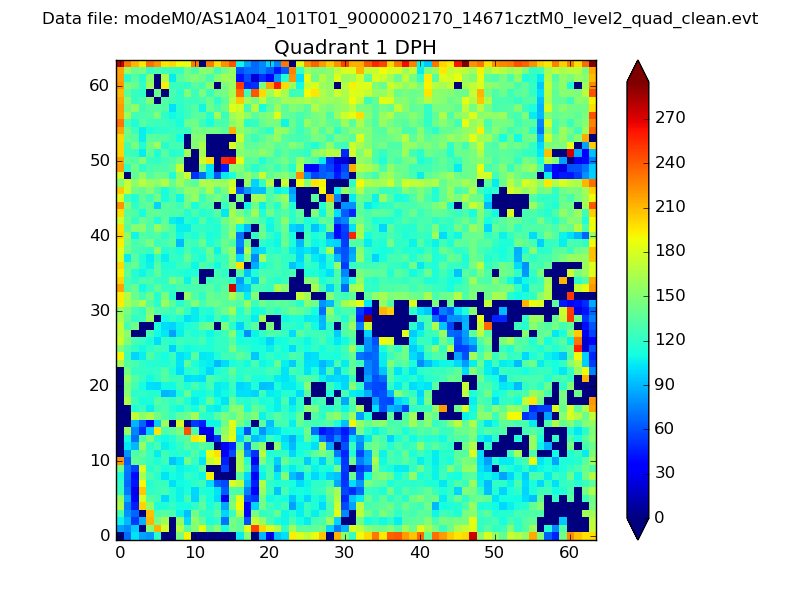 |
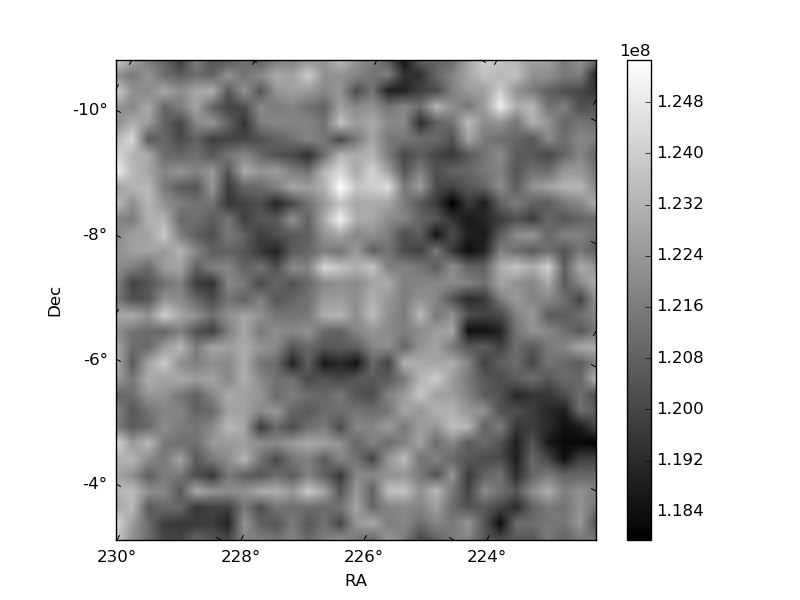
Quadrant B |
|---|---|---|---|
| Quadrant D | 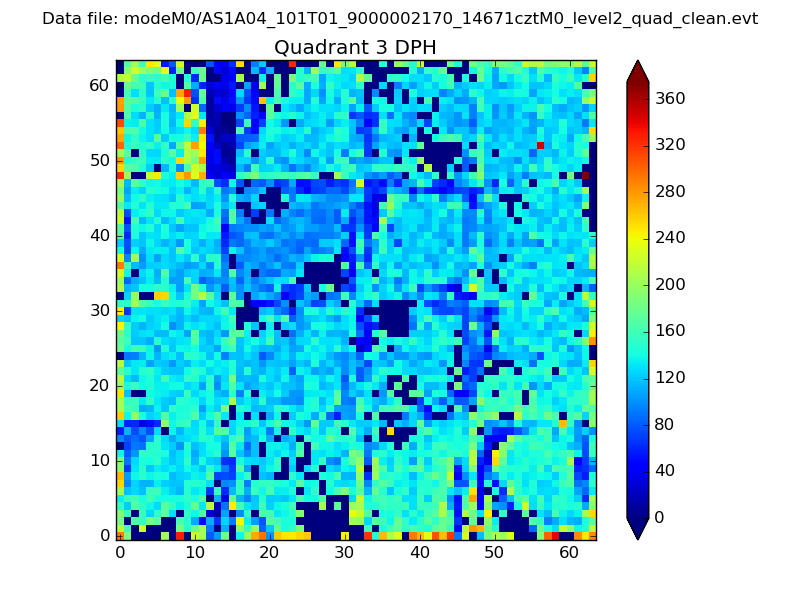 |
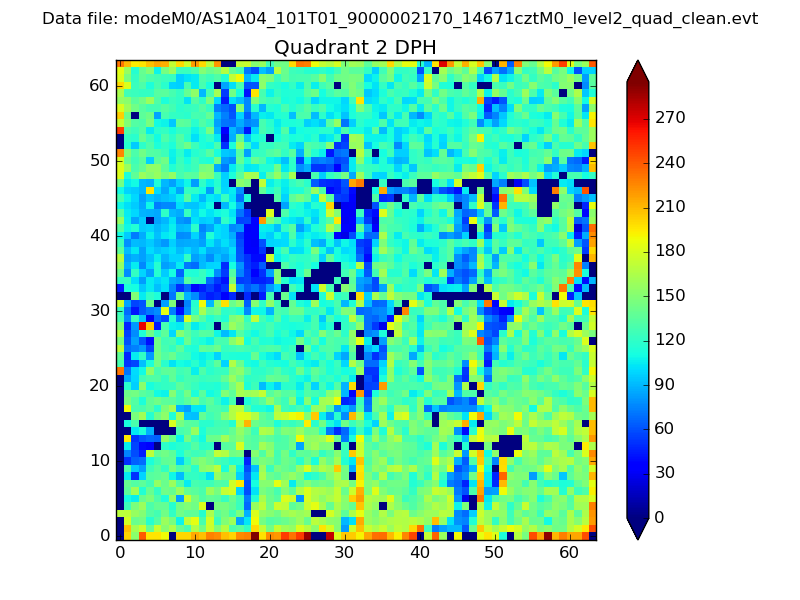 |
Quadrant C |
| Plot type | Count rate plots | Images |
|---|---|---|
| Comparison with Poisson distribution Blue bars denote a histogram of data divided into 1 sec bins. Red curve is a Poisson curve with rate = median count rate of data. |
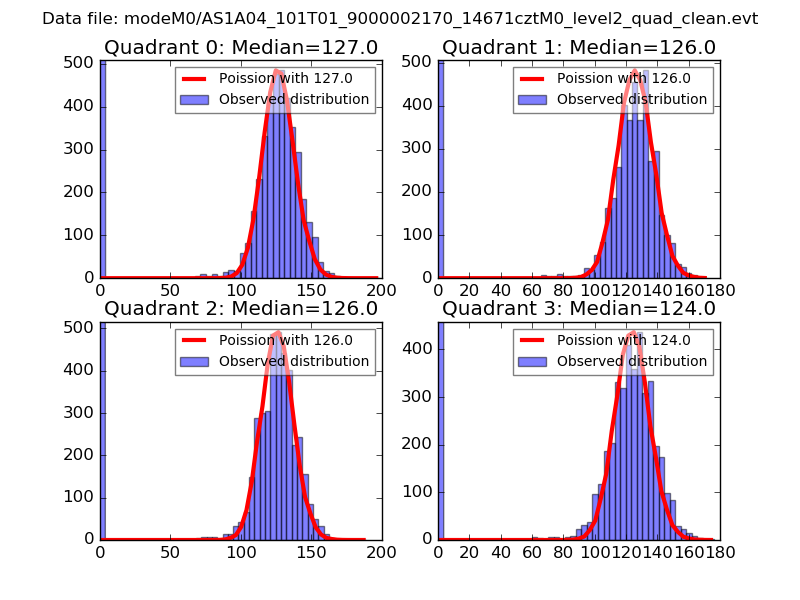 |
 |
| Quadrant-wise count rates Data is divided into 100 sec bins |
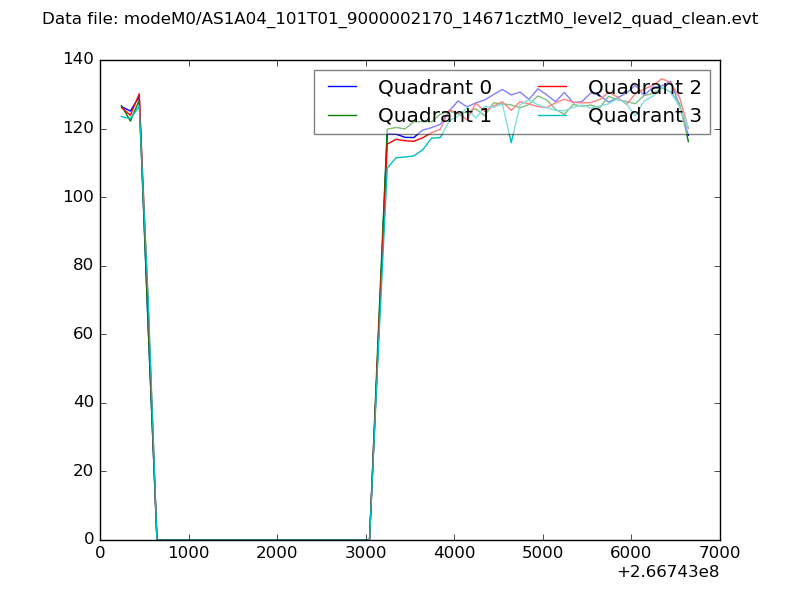 |
|
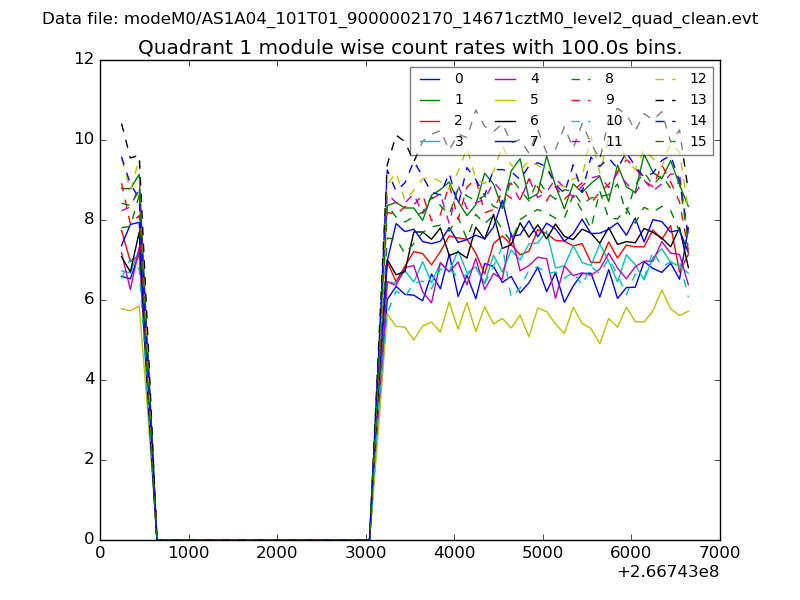
| Module-wise count rates for Quadrant A Data is divided into 100 sec bins |
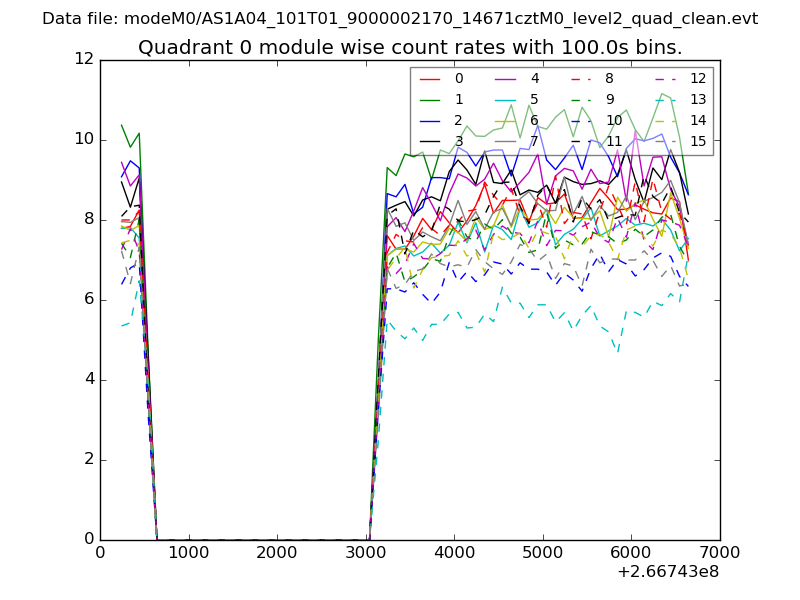 |
 |
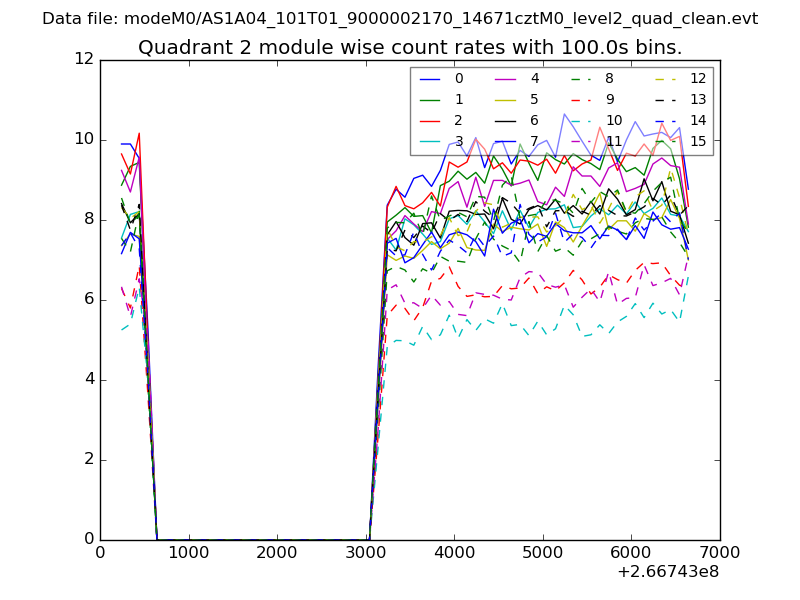
| Module-wise count rates for Quadrant B Data is divided into 100 sec bins |
 |
 |
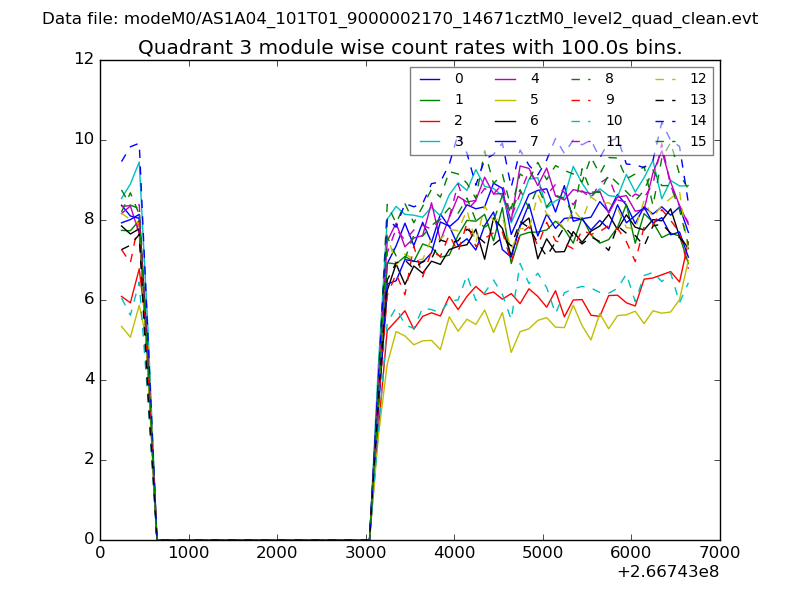
| Module-wise count rates for Quadrant C Data is divided into 100 sec bins |
 |
 |
| Module-wise count rates for Quadrant D Data is divided into 100 sec bins |
 |
 |
| Parameter | Plot |
|---|---|
| CZT HV Monitor | 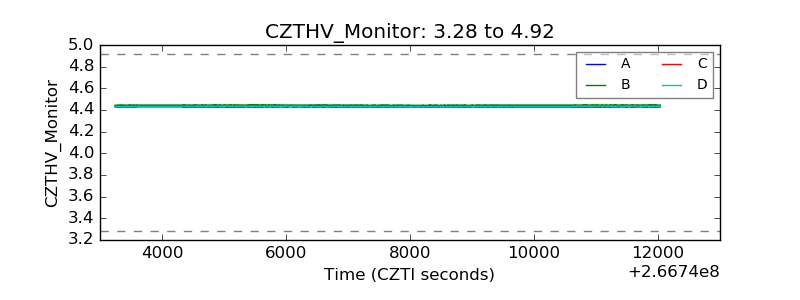 |
| D_VDD | 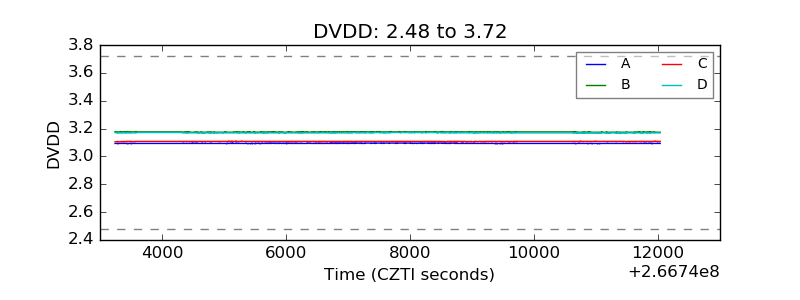 |
| Temperature 1 | 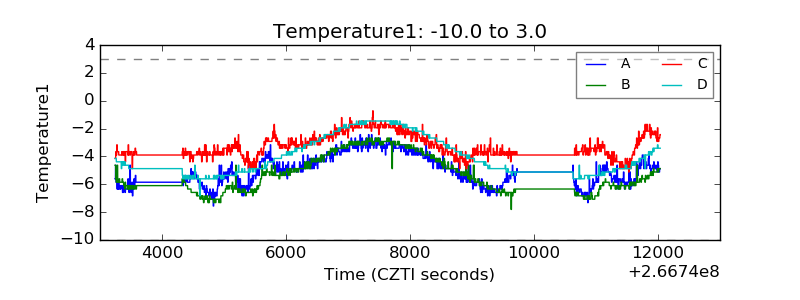 |
| Veto HV Monitor | 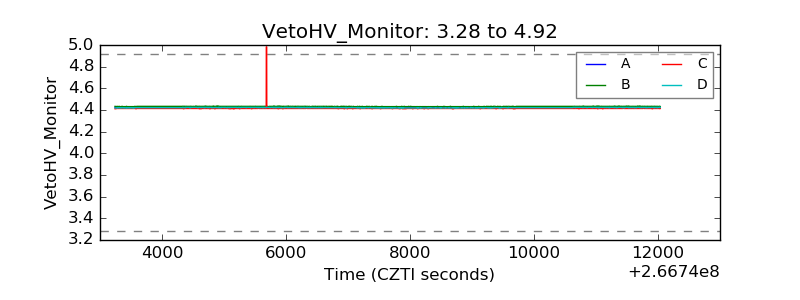 |
| Veto LLD | 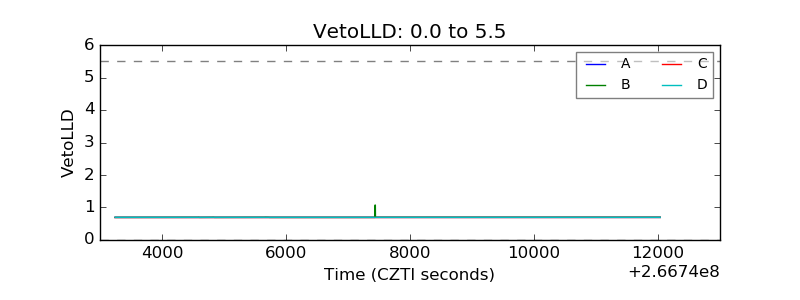 |
| Alpha Counter | 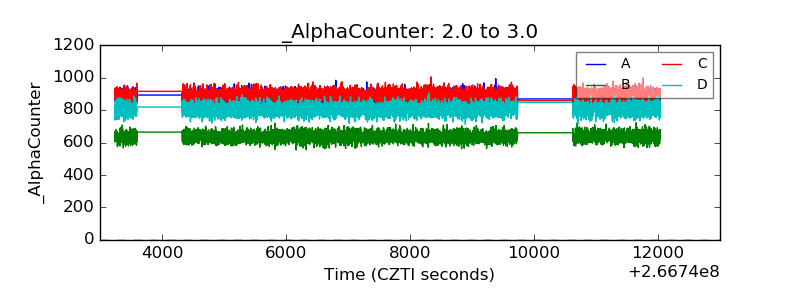 |
| _CPM_Rate | 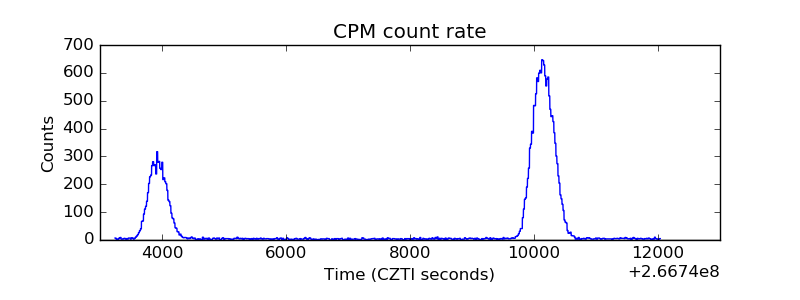 |
| CZT Counter | 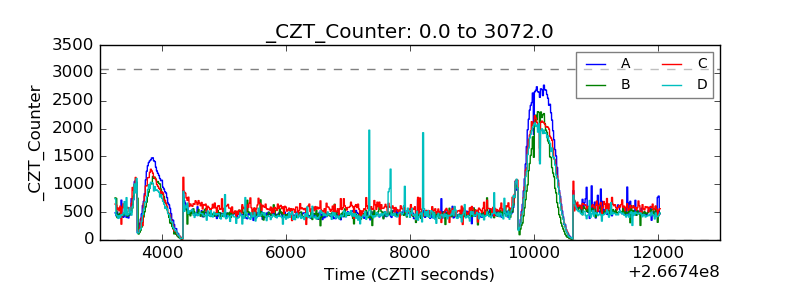 |
| +2.5 Volts monitor |  |
| +5 Volts monitor |  |
| _ROLL_ROT | 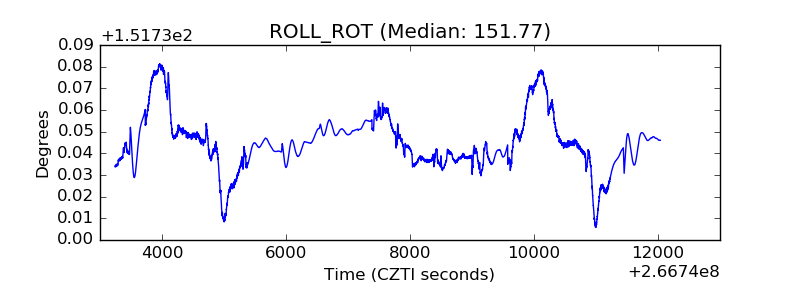 |
| _Roll_DEC | 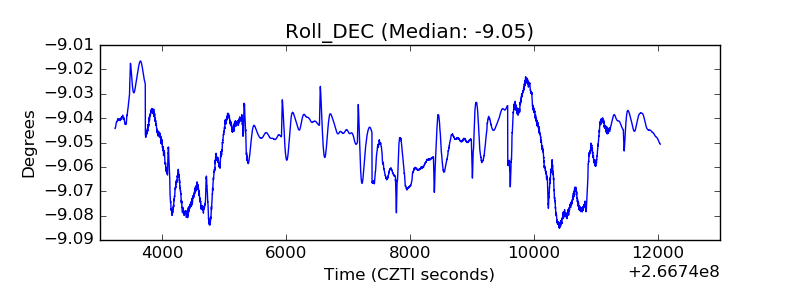 |
| _Roll_RA | 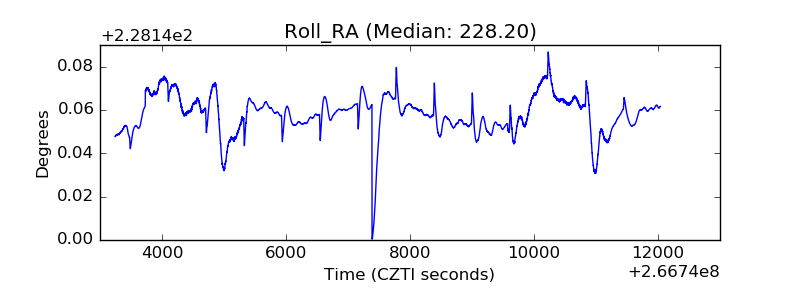 |
| Veto Counter | 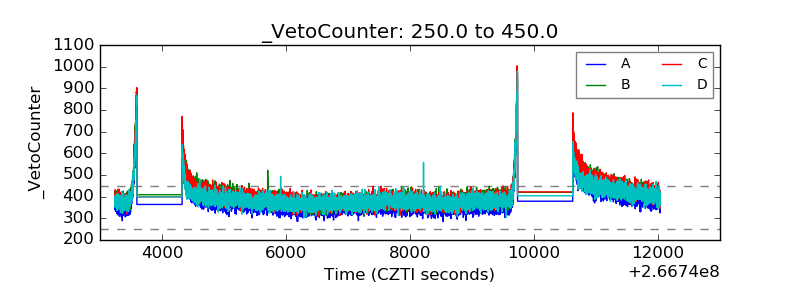 |