| Param | Original file | Final file |
|---|---|---|
| Filename | modeM0/AS1A04_101T01_9000002170_14672cztM0_level2.evt | modeM0/AS1A04_101T01_9000002170_14672cztM0_level2_quad_clean.evt |
| Size (bytes) | 569,200,320 | 99,627,840 |
| Size | 542.8 MB | 95.0 MB |
| Events in quadrant A | 4,066,666 | 630,660 |
| Events in quadrant B | 3,801,532 | 628,341 |
| Events in quadrant C | 4,411,152 | 624,632 |
| Events in quadrant D | 4,445,979 | 607,247 |
| Mode M9 | |||
|---|---|---|---|
| Quadrant | BADHDUFLAG | Total packets | Discarded packets |
| A | 0 | 18 | 0 |
| B | 0 | 18 | 0 |
| C | 0 | 18 | 0 |
| D | 0 | 18 | 0 |
| Mode SS | |||
|---|---|---|---|
| Quadrant | BADHDUFLAG | Total packets | Discarded packets |
| A | 0 | 156 | 0 |
| B | 0 | 156 | 0 |
| C | 0 | 156 | 0 |
| D | 0 | 156 | 0 |
| Mode M0 | |||
|---|---|---|---|
| Quadrant | BADHDUFLAG | Total packets | Discarded packets |
| A | 0 | 16799 | 3 |
| B | 0 | 15897 | 2 |
| C | 0 | 17766 | 2 |
| D | 0 | 18037 | 2 |
| Quadrant | Total seconds | Saturated seconds | Saturation percentage |
|---|---|---|---|
| A | 7562 | 138 | 1.824914% |
| B | 7562 | 141 | 1.864586% |
| C | 7562 | 122 | 1.613330% |
| D | 7562 | 176 | 2.327427% |
Noise dominated data is calculated using 1-second bins in cleaned event files. If a bin has >2000 counts, and if more than 50% of those come from <1% of pixels, then it is considered to be noise-dominated and hence unusable.
| Quadrant | # 1 sec bins | Bins with >0 counts | Bins with >2000 counts | High rate bins dominated by noise | Noise dominated (total time) | Noise dominated (detector-on time) | Marked lightcurve |
|---|---|---|---|---|---|---|---|
| A | 9443 | 7563 | 0 | 0 | 0.00% | 0.00% | 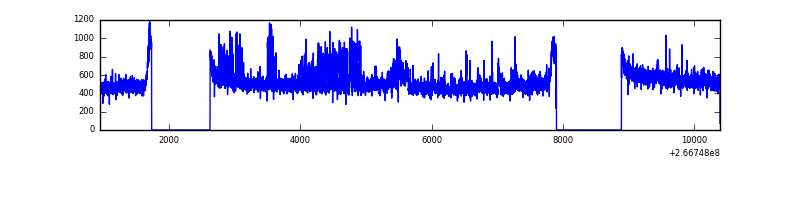 |
| B | 9443 | 7563 | 0 | 0 | 0.00% | 0.00% | 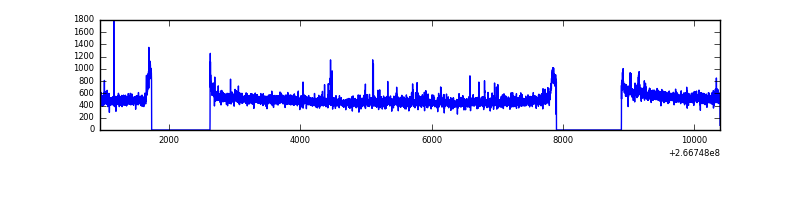 |
| C | 9443 | 7563 | 9 | 9 | 0.10% | 0.12% | 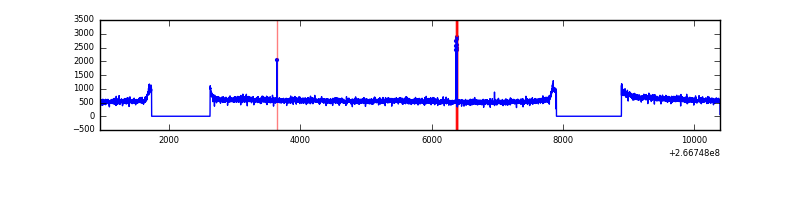 |
| D | 9443 | 7563 | 112 | 112 | 1.19% | 1.48% | 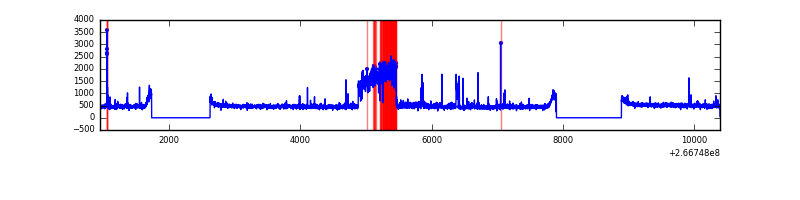 |
Top three noisy pixels from each quadrant. If the there are fewer than three noisy pixels in the level2.evt file, extra rows are filled as -1
| Pixel properties | Quadrant properties | ||||||
|---|---|---|---|---|---|---|---|
| Quadrant | DetID | PixID | Counts | Sigma | Mean | Median | Sigma |
| A | 0 | 253 | 275461 | 1405.45 | 964 | 944 | 195.3 |
| A | 8 | 15 | 46950 | 235.54 | 964 | 944 | 195.3 |
| A | 12 | 189 | 32131 | 159.67 | 964 | 944 | 195.3 |
| B | 0 | 214 | 29105 | 153.19 | 955 | 932 | 183.9 |
| B | 12 | 111 | 22302 | 116.2 | 955 | 932 | 183.9 |
| B | 11 | 111 | 19036 | 98.44 | 955 | 932 | 183.9 |
| C | 3 | 233 | 748556 | 3457.0 | 931 | 936 | 216.3 |
| C | 10 | 22 | 20567 | 90.77 | 931 | 936 | 216.3 |
| C | 13 | 61 | 6520 | 25.82 | 931 | 936 | 216.3 |
| D | 12 | 110 | 743633 | 3244.95 | 931 | 909 | 228.9 |
| D | 2 | 152 | 85753 | 370.68 | 931 | 909 | 228.9 |
| D | 15 | 145 | 34093 | 144.98 | 931 | 909 | 228.9 |
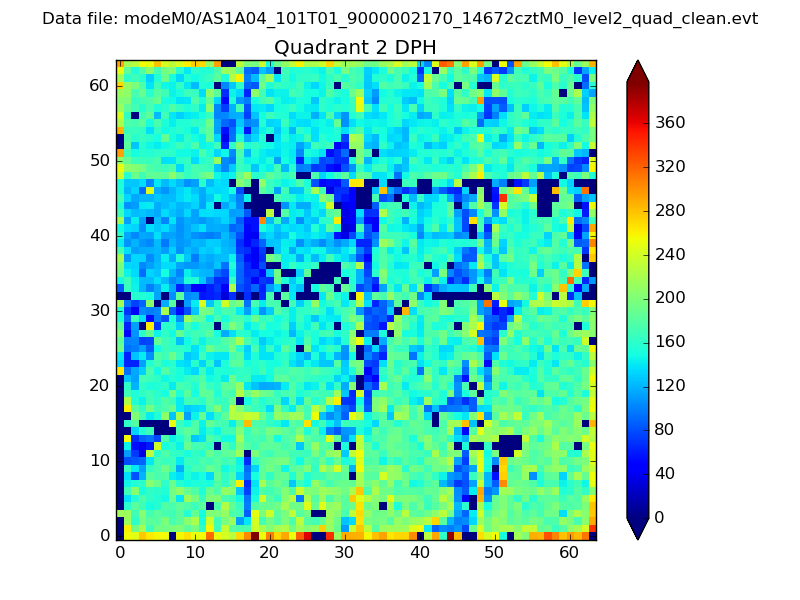
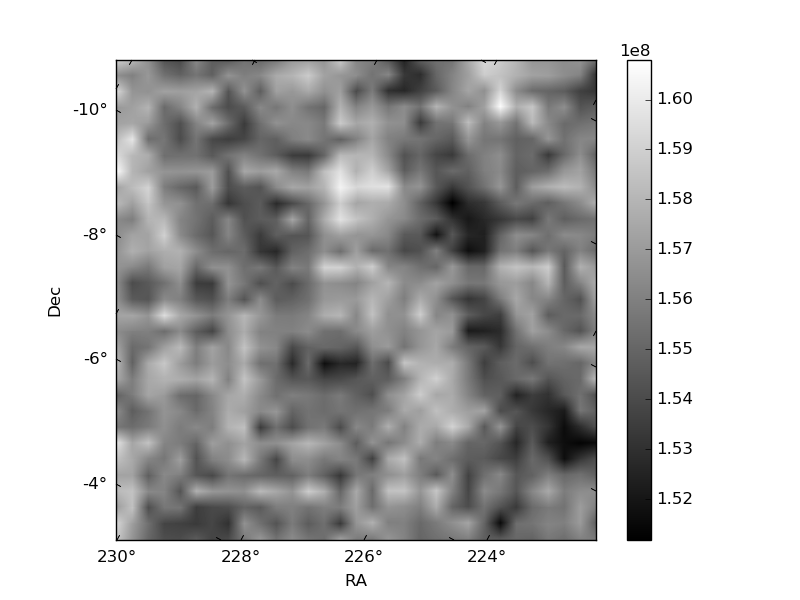
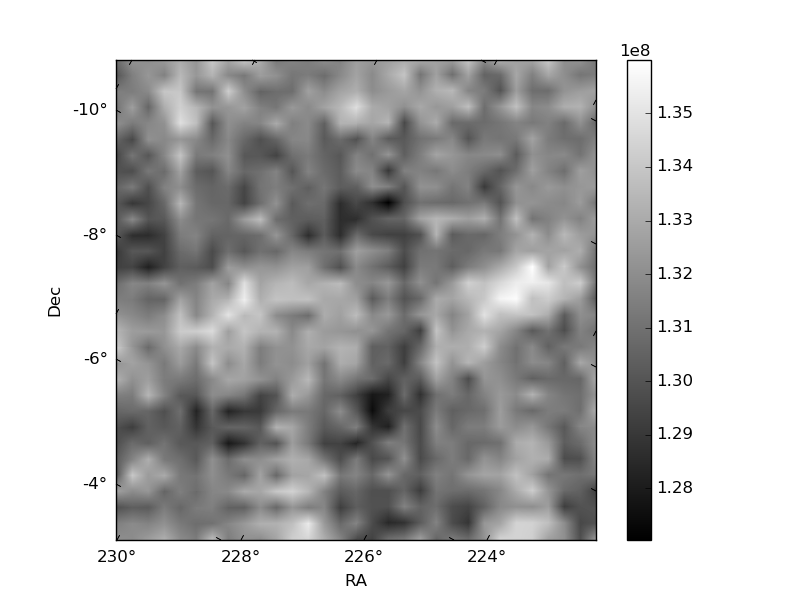
Histogram calculated using DETX and DETY for each event in the final _common_clean file
| Quadrant A | 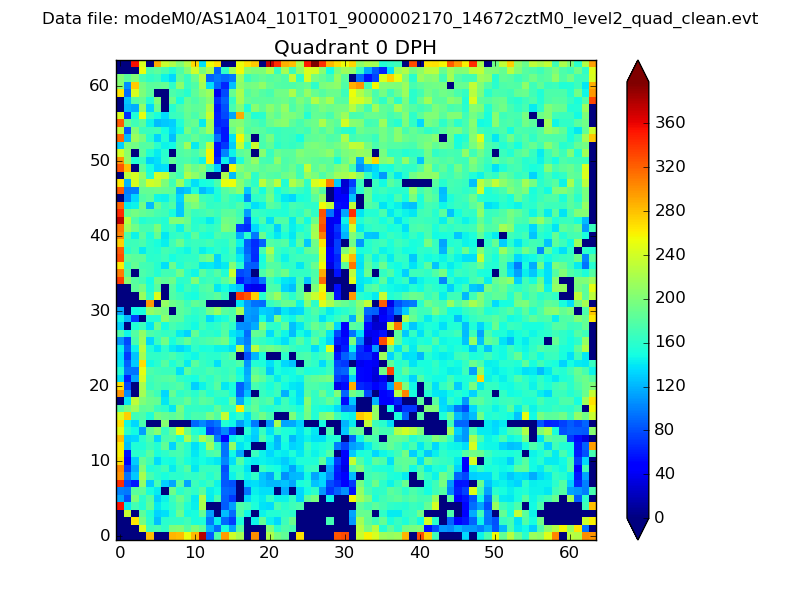 |
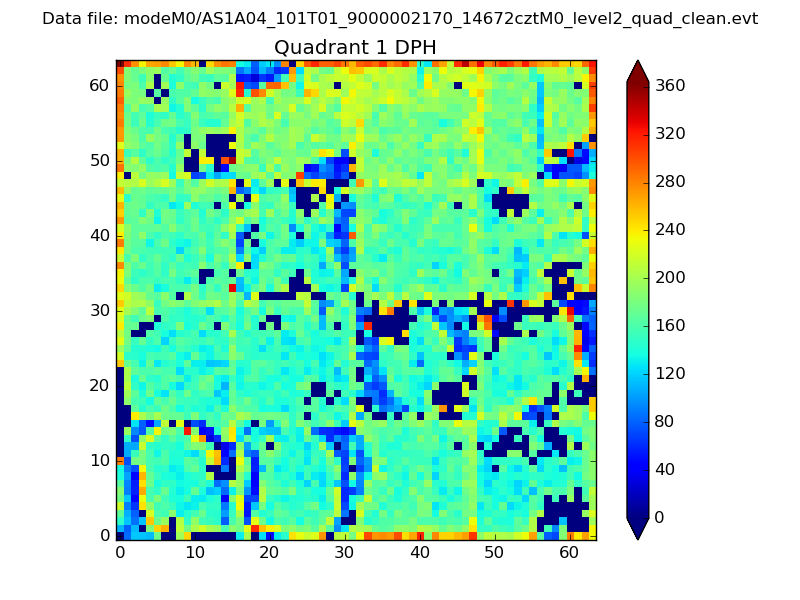 |
Quadrant B |
|---|---|---|---|
| Quadrant D | 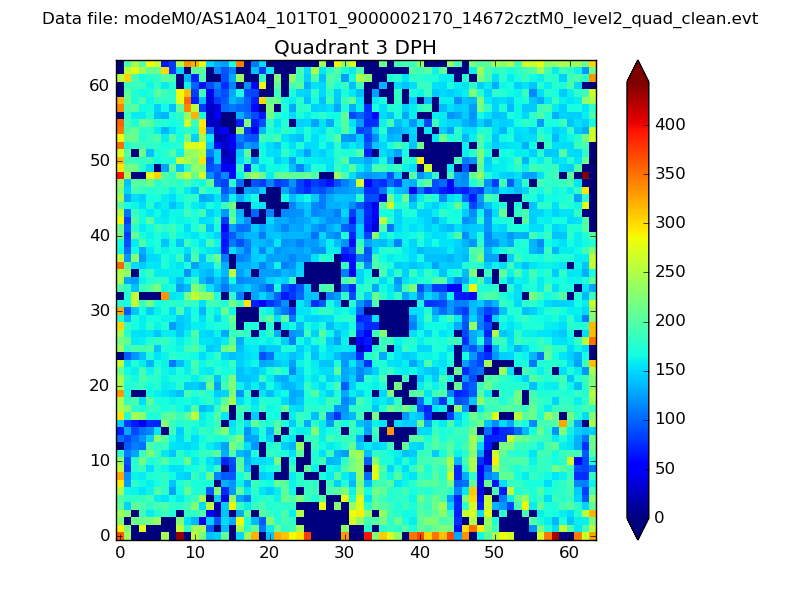 |
 |
Quadrant C |
| Plot type | Count rate plots | Images |
|---|---|---|
| Comparison with Poisson distribution Blue bars denote a histogram of data divided into 1 sec bins. Red curve is a Poisson curve with rate = median count rate of data. |
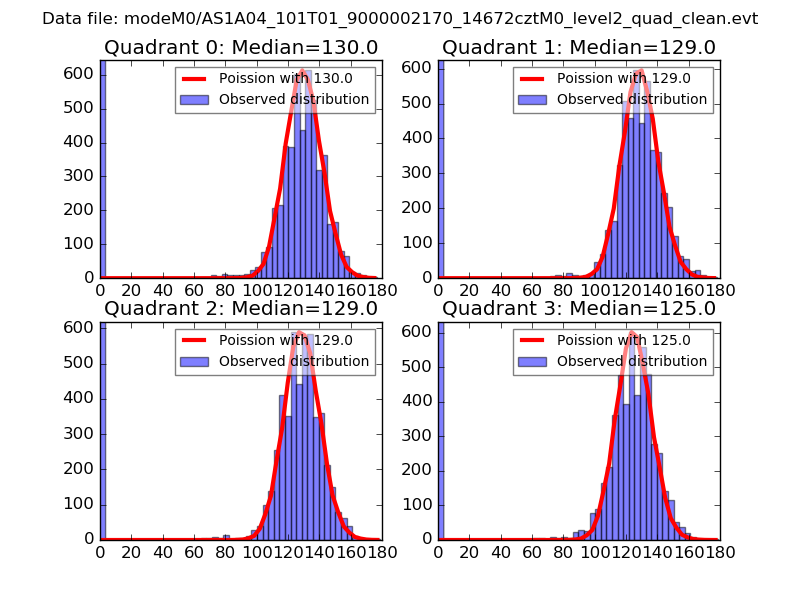 |
 |
| Quadrant-wise count rates Data is divided into 100 sec bins |
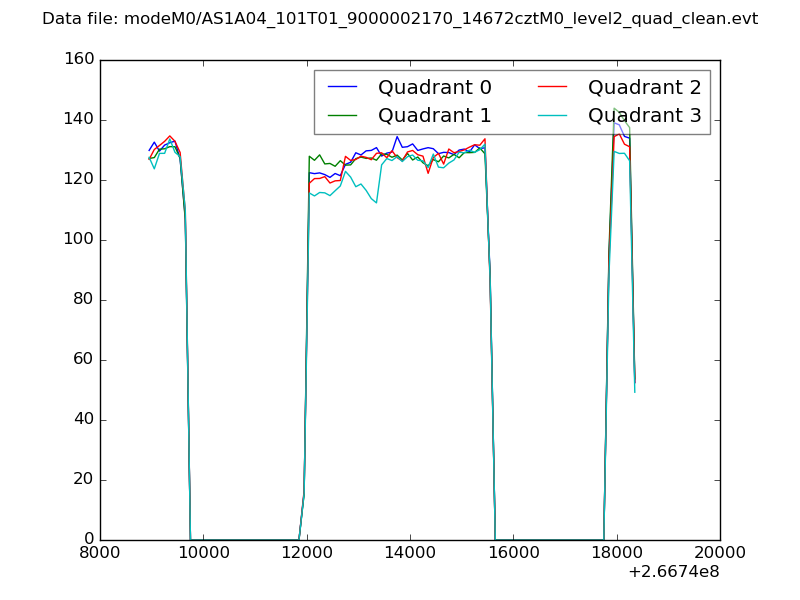 |
|
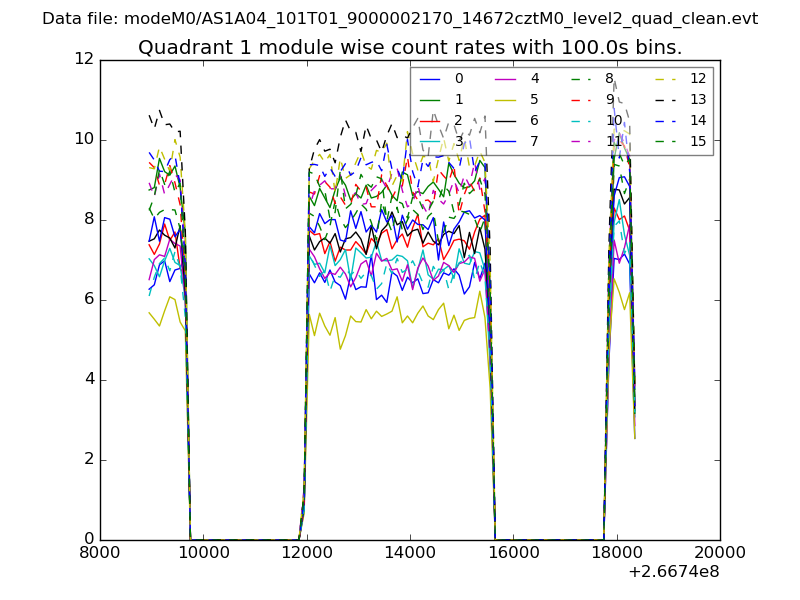
| Module-wise count rates for Quadrant A Data is divided into 100 sec bins |
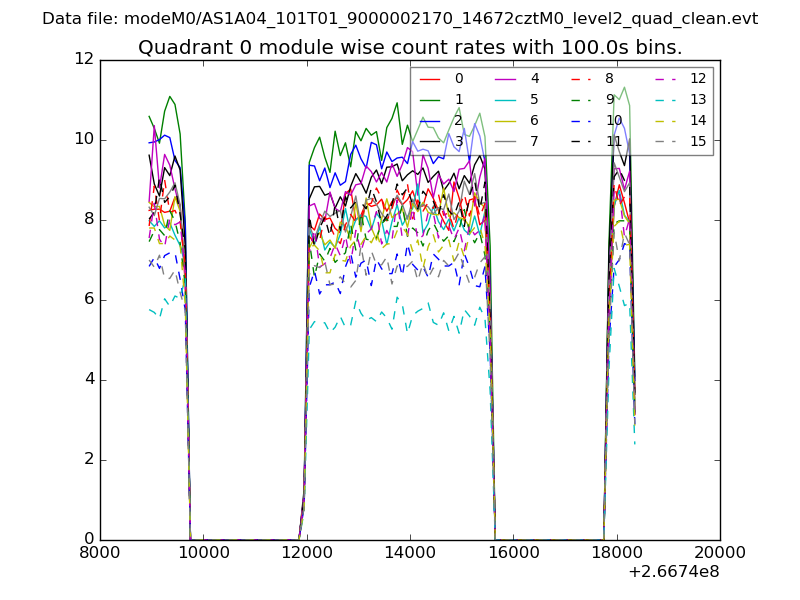 |
 |
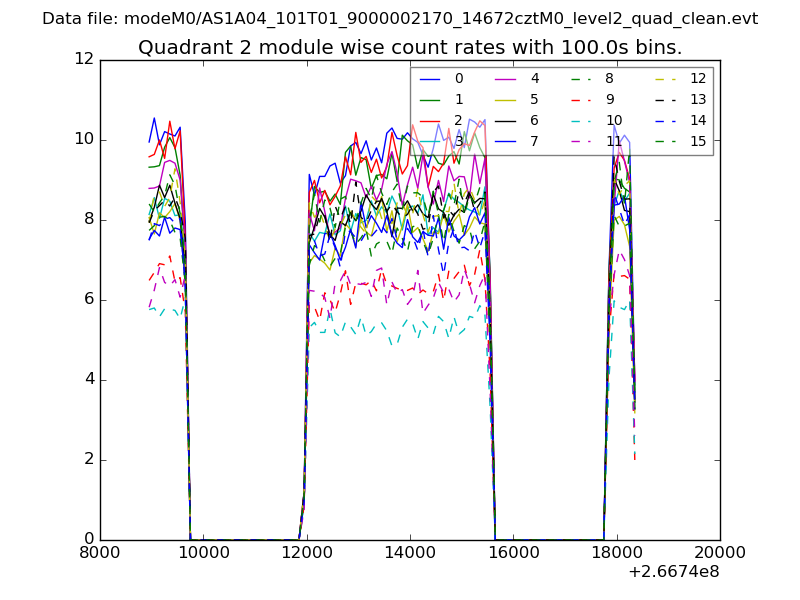
| Module-wise count rates for Quadrant B Data is divided into 100 sec bins |
 |
 |
| Module-wise count rates for Quadrant C Data is divided into 100 sec bins |
 |
 |
| Module-wise count rates for Quadrant D Data is divided into 100 sec bins |
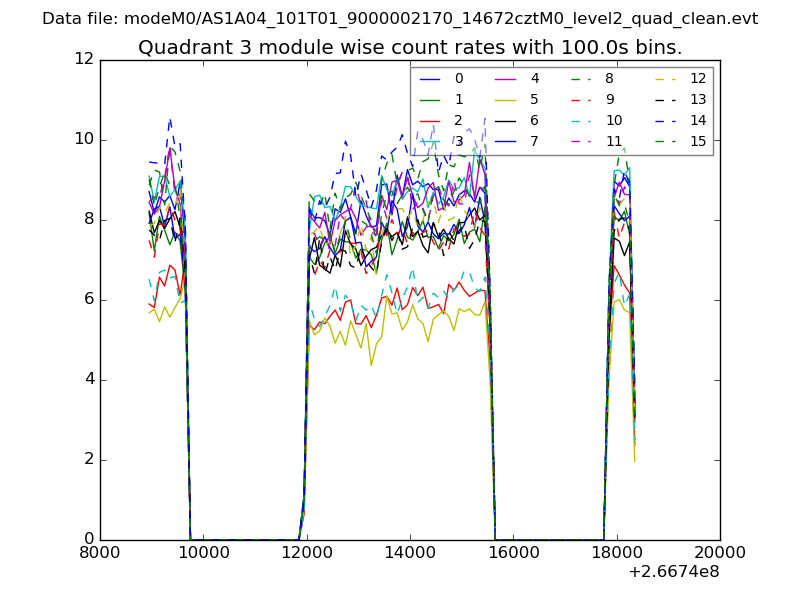 |
 |
| Parameter | Plot |
|---|---|
| CZT HV Monitor | 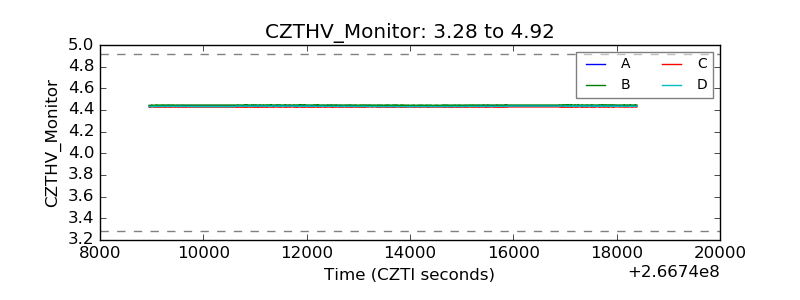 |
| D_VDD | 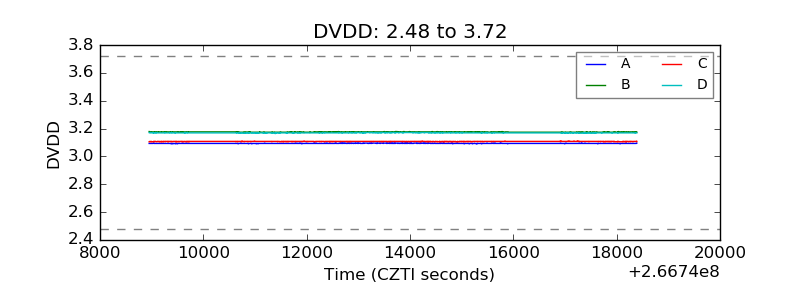 |
| Temperature 1 | 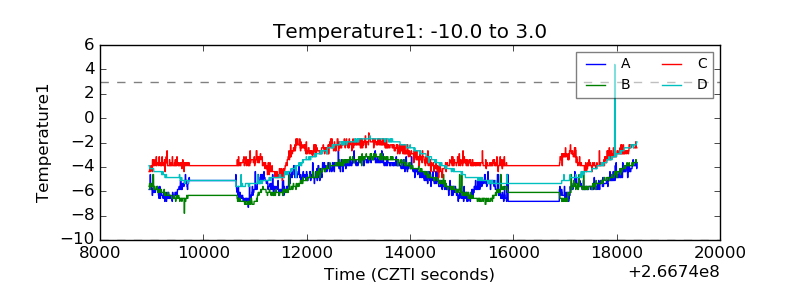 |
| Veto HV Monitor | 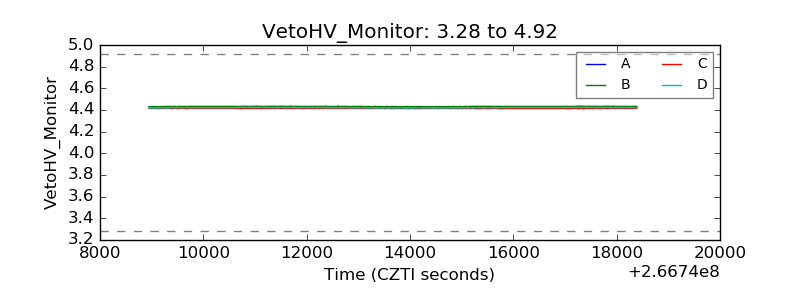 |
| Veto LLD | 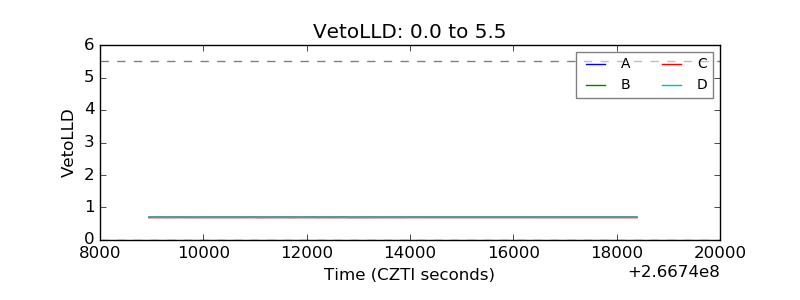 |
| Alpha Counter | 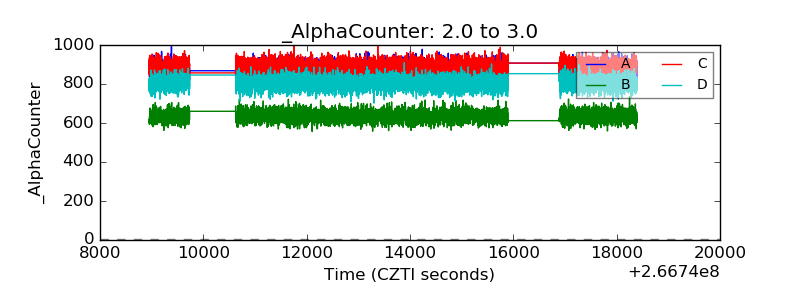 |
| _CPM_Rate | 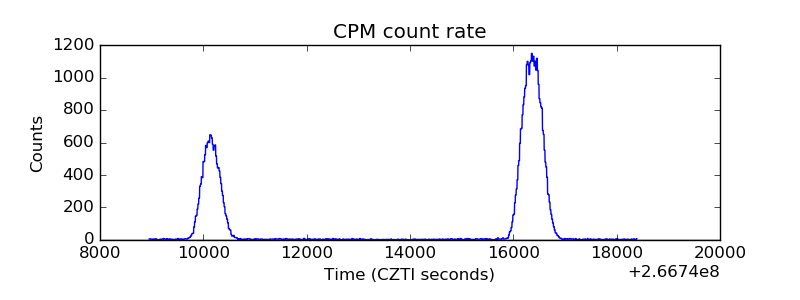 |
| CZT Counter | 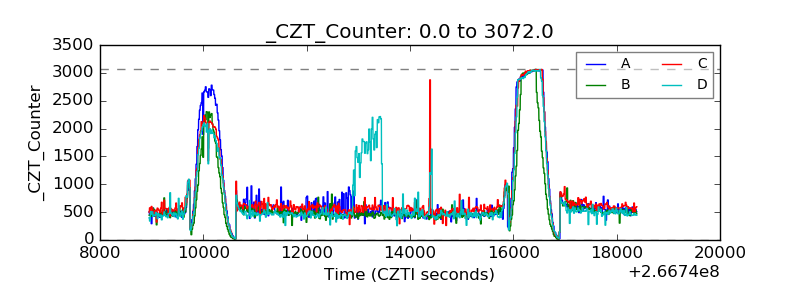 |
| +2.5 Volts monitor |  |
| +5 Volts monitor |  |
| _ROLL_ROT | 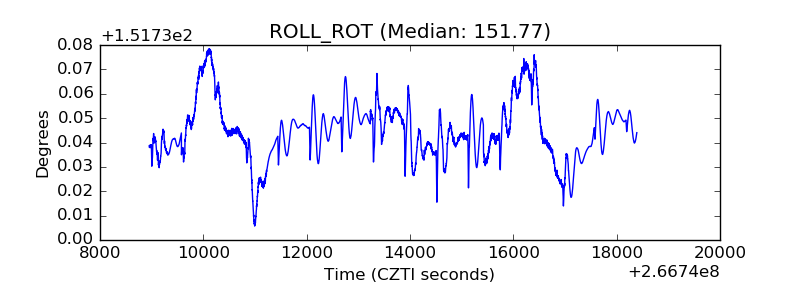 |
| _Roll_DEC |  |
| _Roll_RA | 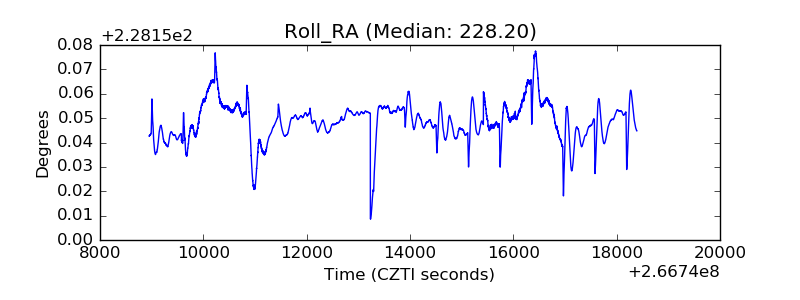 |
| Veto Counter |  |