| Param | Original file | Final file |
|---|---|---|
| Filename | modeM0/AS1A04_101T01_9000002170_14675cztM0_level2.evt | modeM0/AS1A04_101T01_9000002170_14675cztM0_level2_quad_clean.evt |
| Size (bytes) | 508,222,080 | 109,851,840 |
| Size | 484.7 MB | 104.8 MB |
| Events in quadrant A | 3,752,142 | 733,521 |
| Events in quadrant B | 3,473,625 | 723,865 |
| Events in quadrant C | 4,225,084 | 712,264 |
| Events in quadrant D | 3,502,718 | 706,783 |
| Mode M9 | |||
|---|---|---|---|
| Quadrant | BADHDUFLAG | Total packets | Discarded packets |
| A | 0 | 21 | 0 |
| B | 0 | 21 | 0 |
| C | 0 | 21 | 0 |
| D | 0 | 22 | 0 |
| Mode SS | |||
|---|---|---|---|
| Quadrant | BADHDUFLAG | Total packets | Discarded packets |
| A | 0 | 132 | 0 |
| B | 0 | 132 | 0 |
| C | 0 | 132 | 0 |
| D | 0 | 132 | 0 |
| Mode M0 | |||
|---|---|---|---|
| Quadrant | BADHDUFLAG | Total packets | Discarded packets |
| A | 0 | 15291 | 3 |
| B | 0 | 14499 | 2 |
| C | 0 | 17489 | 2 |
| D | 0 | 14518 | 2 |
| Quadrant | Total seconds | Saturated seconds | Saturation percentage |
|---|---|---|---|
| A | 6458 | 92 | 1.424590% |
| B | 6458 | 83 | 1.285228% |
| C | 6458 | 82 | 1.269743% |
| D | 6458 | 77 | 1.192320% |
Noise dominated data is calculated using 1-second bins in cleaned event files. If a bin has >2000 counts, and if more than 50% of those come from <1% of pixels, then it is considered to be noise-dominated and hence unusable.
| Quadrant | # 1 sec bins | Bins with >0 counts | Bins with >2000 counts | High rate bins dominated by noise | Noise dominated (total time) | Noise dominated (detector-on time) | Marked lightcurve |
|---|---|---|---|---|---|---|---|
| A | 7684 | 6459 | 1 | 1 | 0.01% | 0.02% | 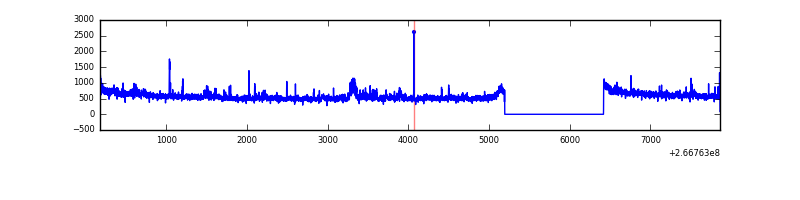 |
| B | 7684 | 6459 | 1 | 1 | 0.01% | 0.02% | 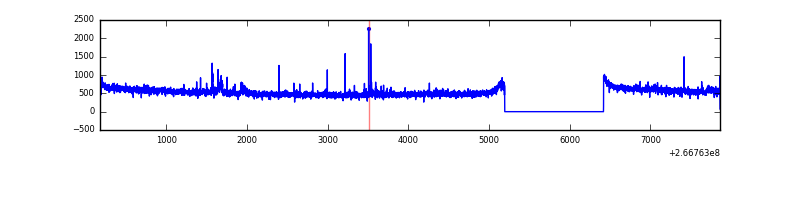 |
| C | 7684 | 6459 | 0 | 0 | 0.00% | 0.00% | 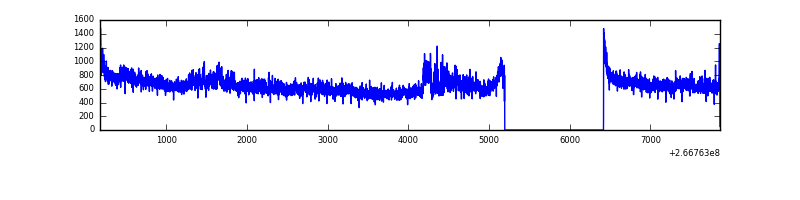 |
| D | 7684 | 6459 | 8 | 8 | 0.10% | 0.12% | 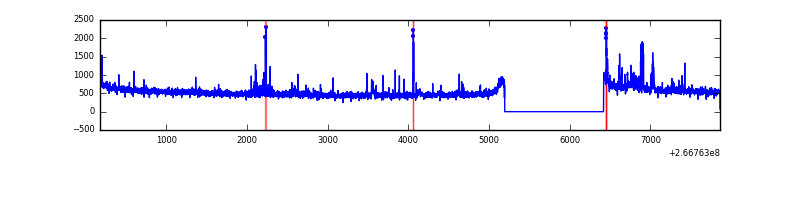 |
Top three noisy pixels from each quadrant. If the there are fewer than three noisy pixels in the level2.evt file, extra rows are filled as -1
| Pixel properties | Quadrant properties | ||||||
|---|---|---|---|---|---|---|---|
| Quadrant | DetID | PixID | Counts | Sigma | Mean | Median | Sigma |
| A | 0 | 253 | 161020 | 898.04 | 888 | 873 | 178.3 |
| A | 8 | 15 | 115200 | 641.1 | 888 | 873 | 178.3 |
| A | 12 | 189 | 57448 | 317.25 | 888 | 873 | 178.3 |
| B | 0 | 214 | 26868 | 160.15 | 864 | 847 | 162.5 |
| B | 0 | 205 | 25802 | 153.59 | 864 | 847 | 162.5 |
| B | 0 | 230 | 23951 | 142.19 | 864 | 847 | 162.5 |
| C | 3 | 233 | 912614 | 4672.42 | 847 | 855 | 195.1 |
| C | 3 | 234 | 6334 | 28.08 | 847 | 855 | 195.1 |
| C | 13 | 61 | 6049 | 26.62 | 847 | 855 | 195.1 |
| D | 2 | 152 | 70365 | 324.64 | 857 | 836 | 214.2 |
| D | 12 | 2 | 62167 | 286.36 | 857 | 836 | 214.2 |
| D | 1 | 255 | 53872 | 247.63 | 857 | 836 | 214.2 |
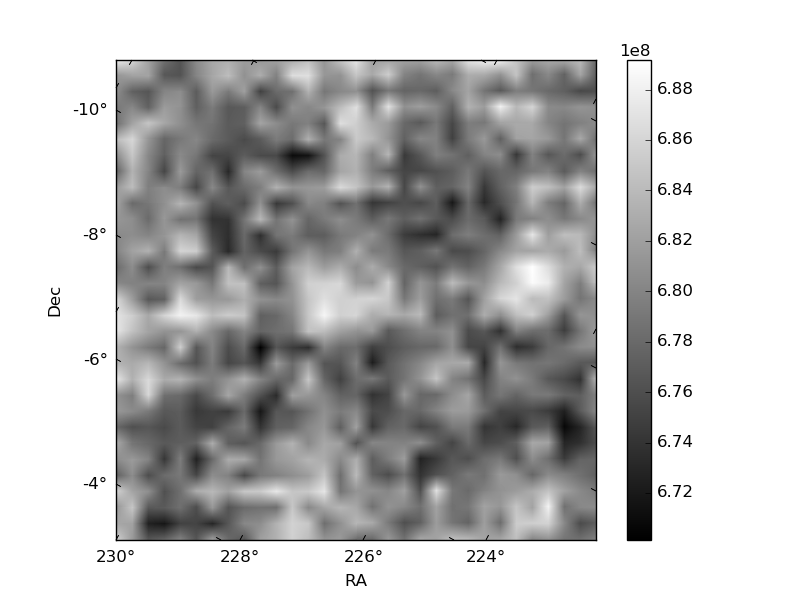
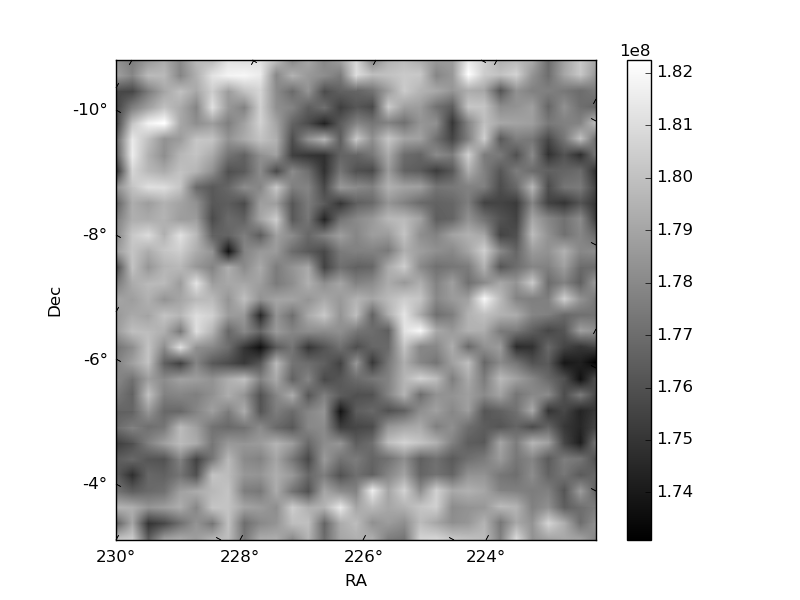
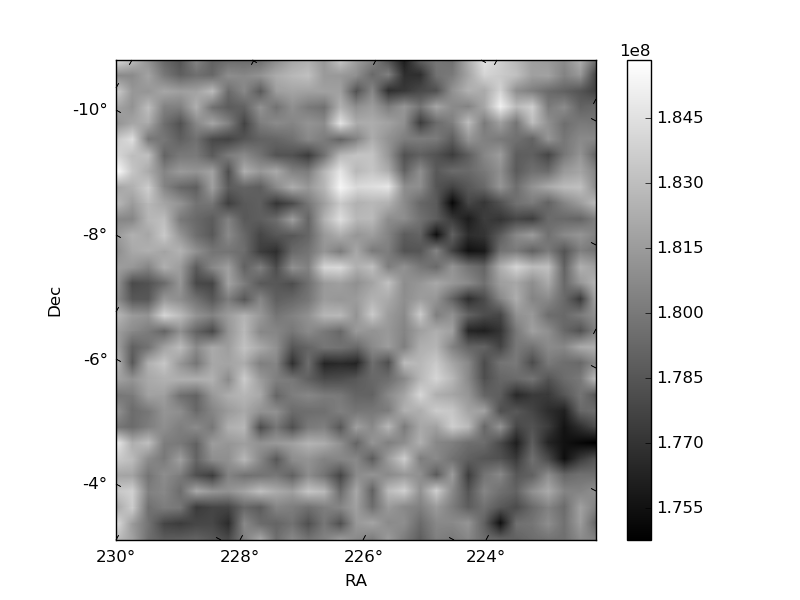
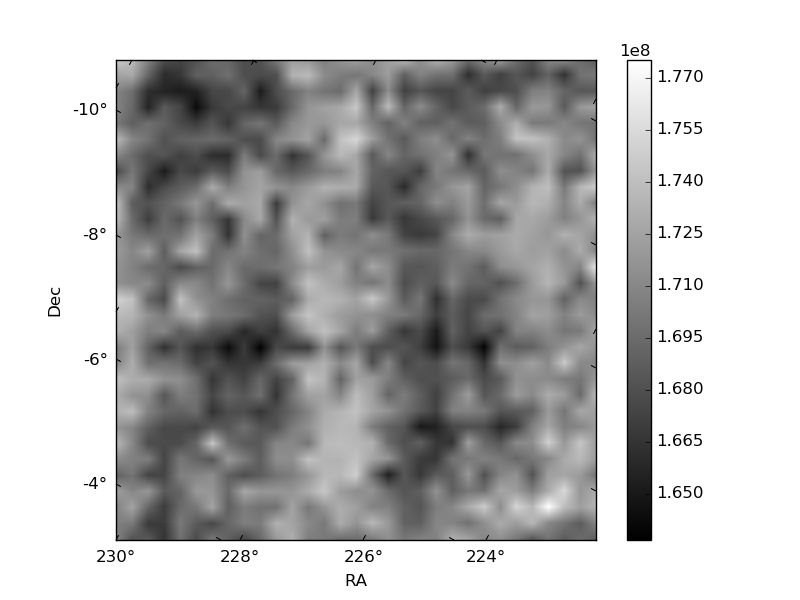
Histogram calculated using DETX and DETY for each event in the final _common_clean file
| Quadrant A | 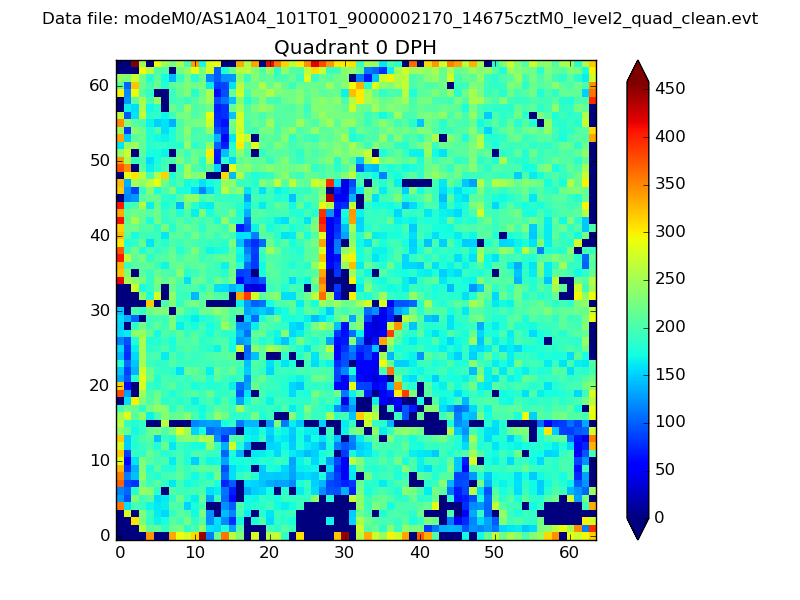 |
 |
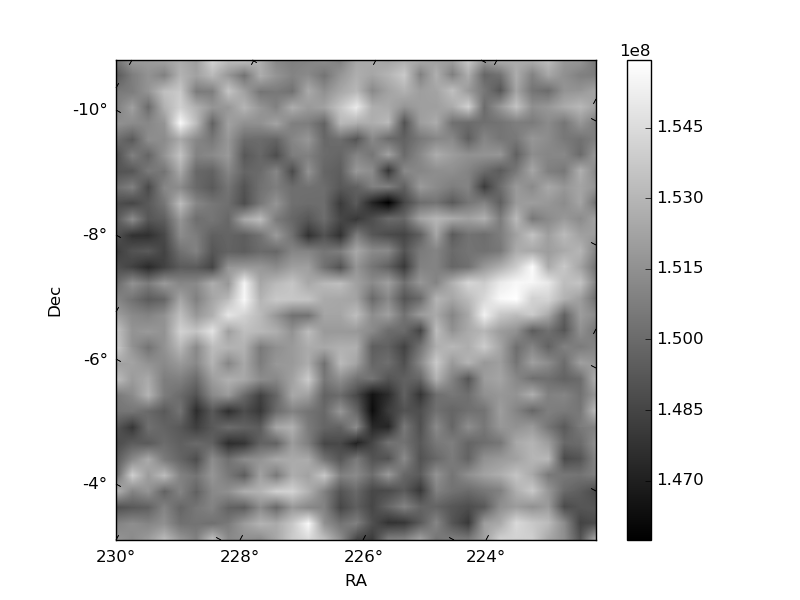
Quadrant B |
|---|---|---|---|
| Quadrant D | 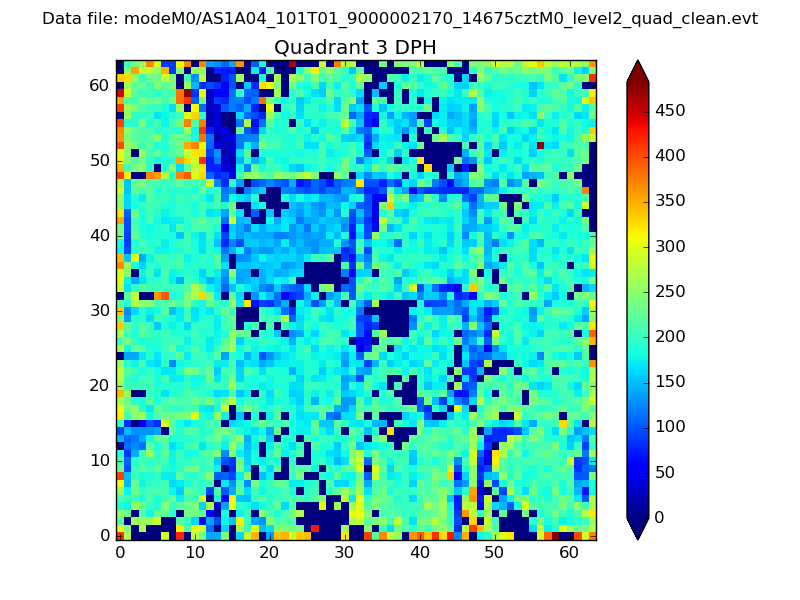 |
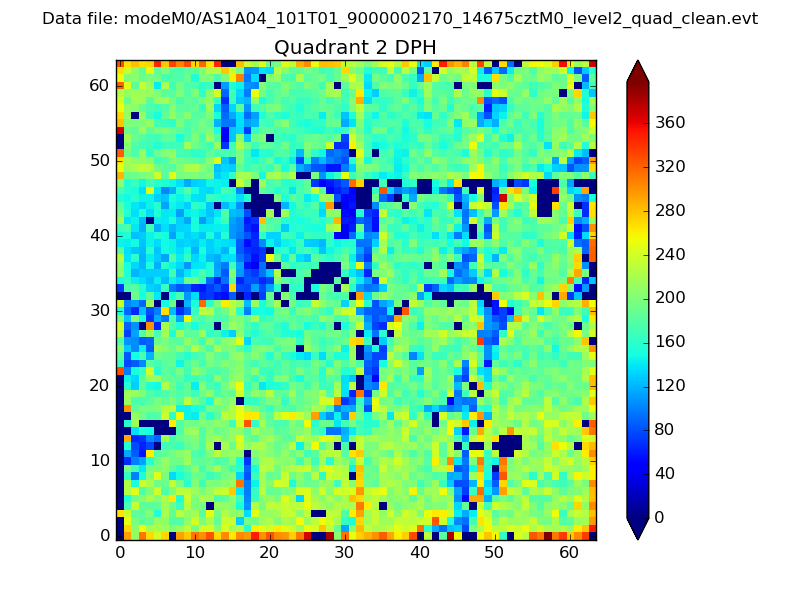 |
Quadrant C |
| Plot type | Count rate plots | Images |
|---|---|---|
| Comparison with Poisson distribution Blue bars denote a histogram of data divided into 1 sec bins. Red curve is a Poisson curve with rate = median count rate of data. |
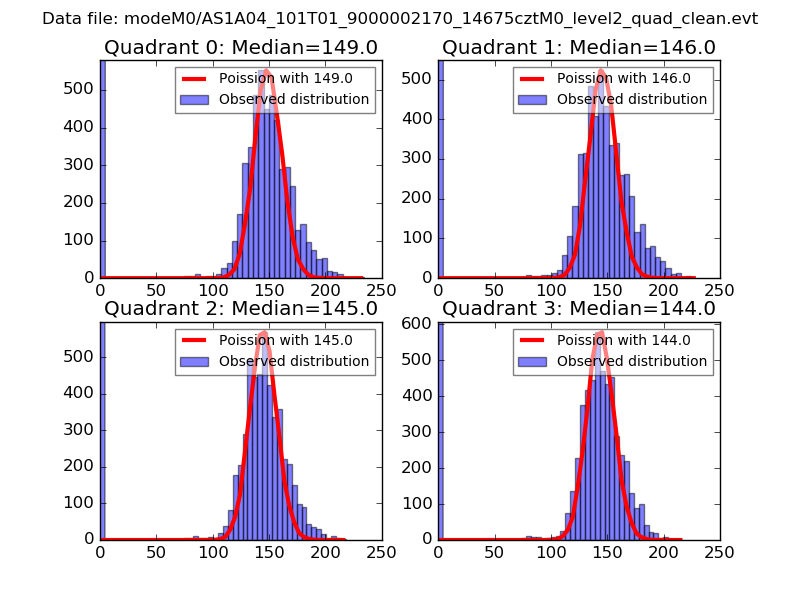 |
 |
| Quadrant-wise count rates Data is divided into 100 sec bins |
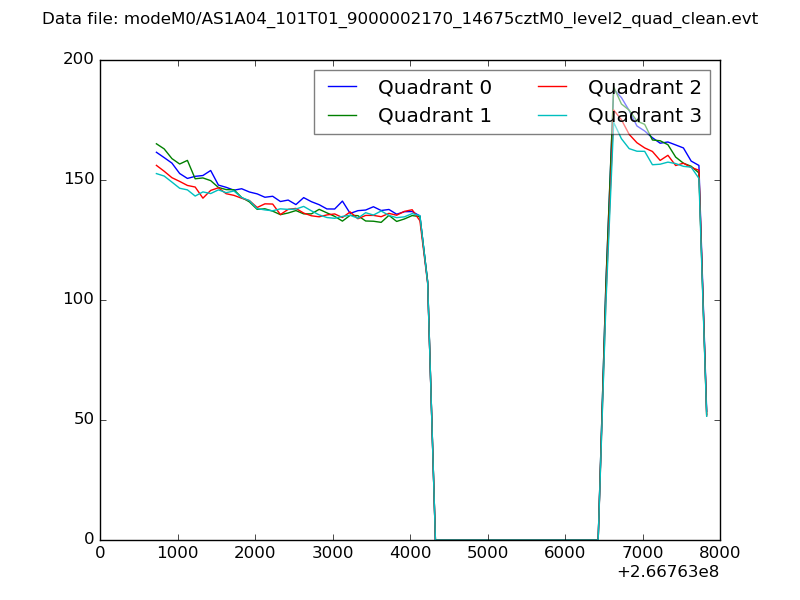 |
|
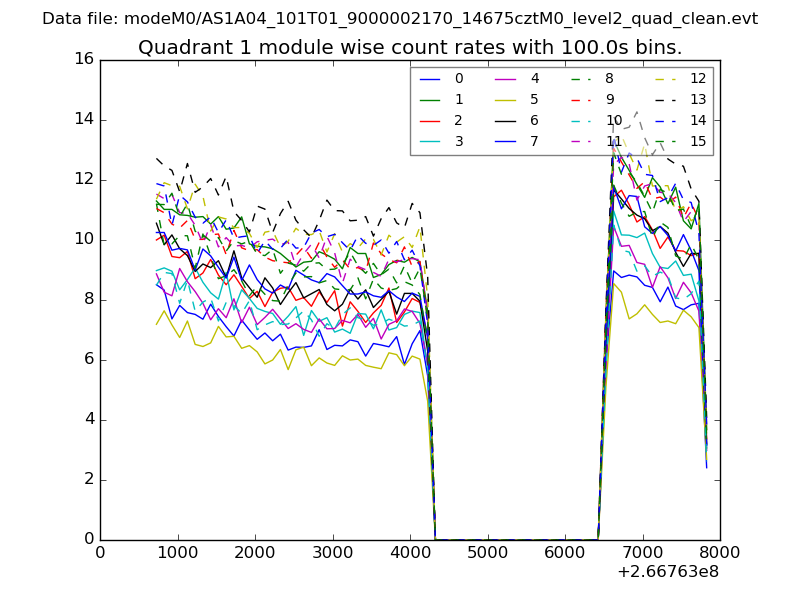
| Module-wise count rates for Quadrant A Data is divided into 100 sec bins |
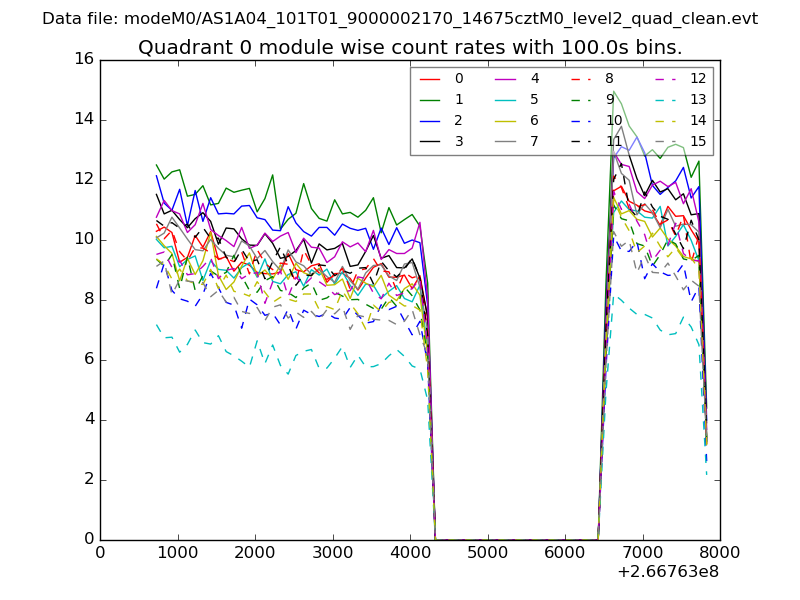 |
 |
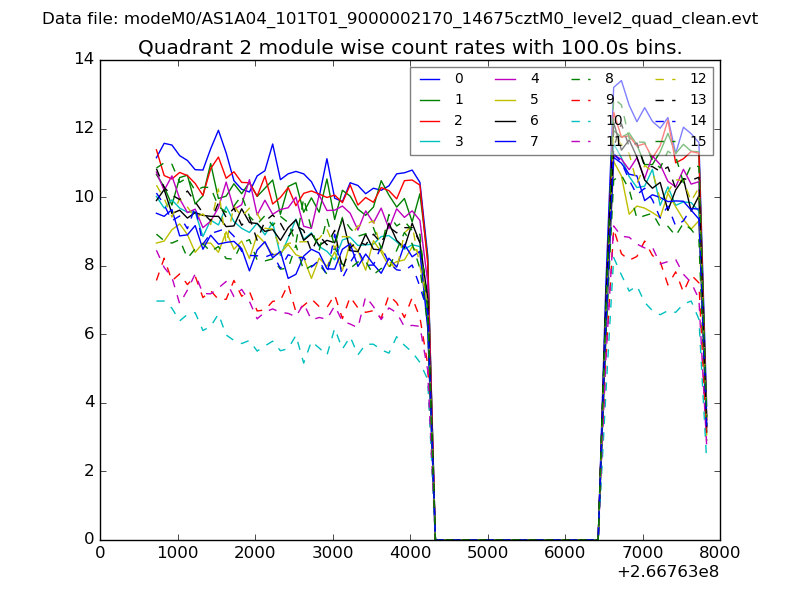
| Module-wise count rates for Quadrant B Data is divided into 100 sec bins |
 |
 |
| Module-wise count rates for Quadrant C Data is divided into 100 sec bins |
 |
 |
| Module-wise count rates for Quadrant D Data is divided into 100 sec bins |
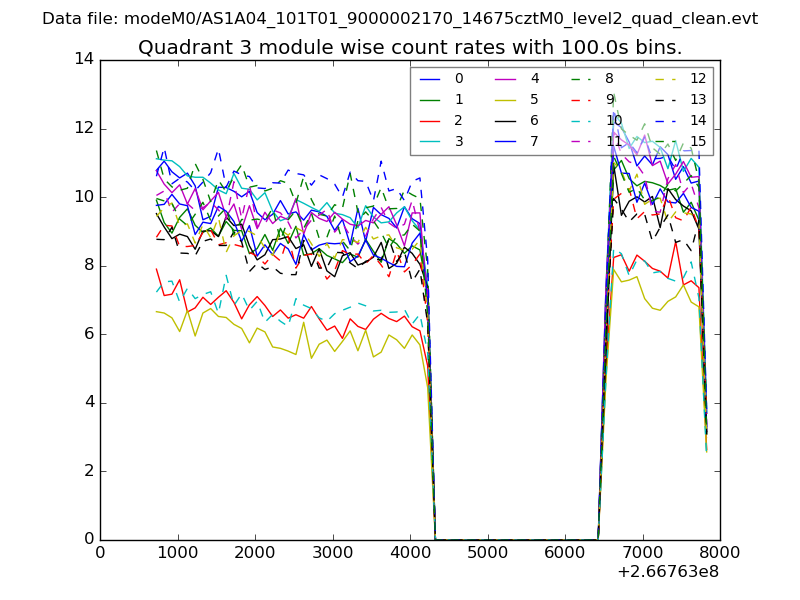 |
 |
| Parameter | Plot |
|---|---|
| CZT HV Monitor | 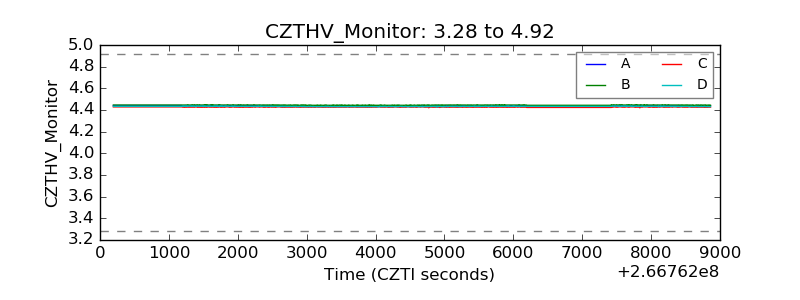 |
| D_VDD | 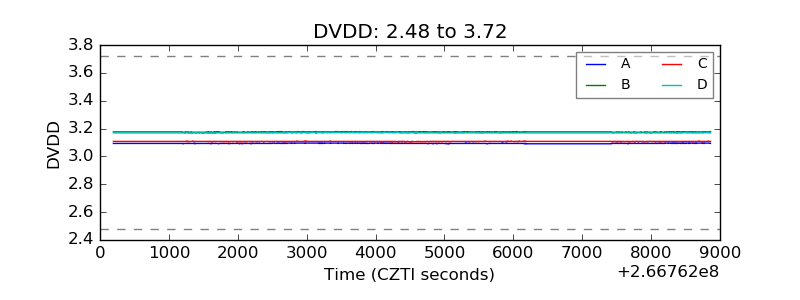 |
| Temperature 1 | 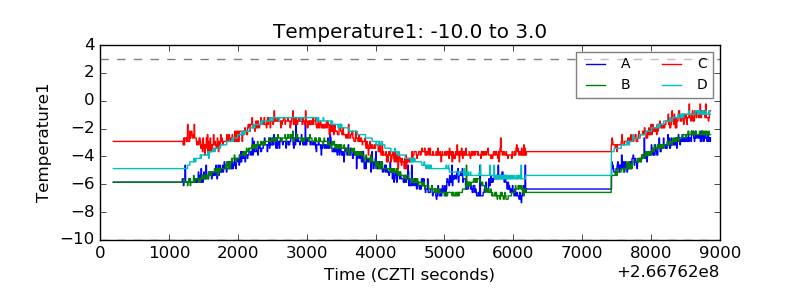 |
| Veto HV Monitor | 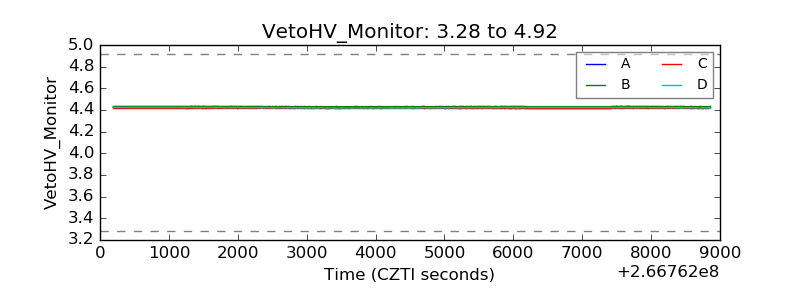 |
| Veto LLD | 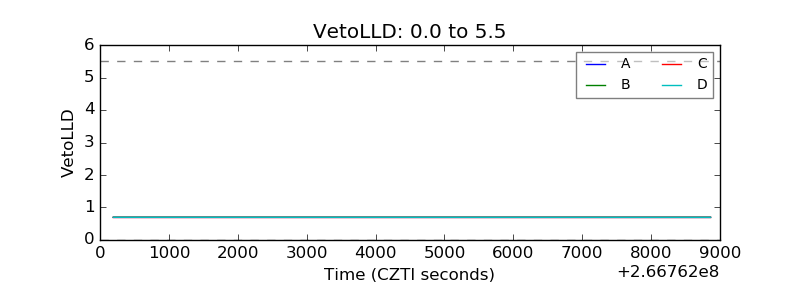 |
| Alpha Counter | 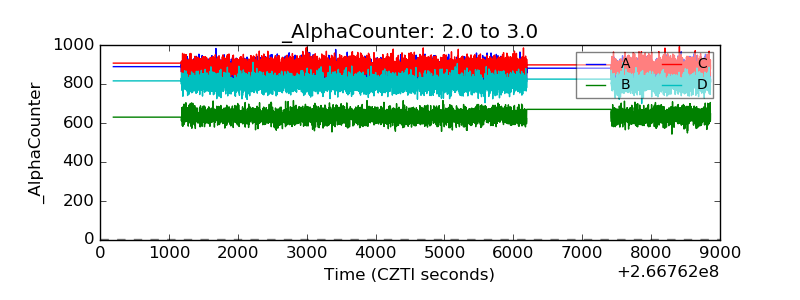 |
| _CPM_Rate | 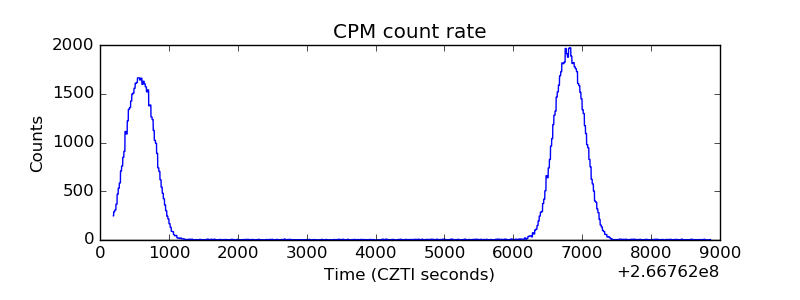 |
| CZT Counter |  |
| +2.5 Volts monitor |  |
| +5 Volts monitor |  |
| _ROLL_ROT |  |
| _Roll_DEC | 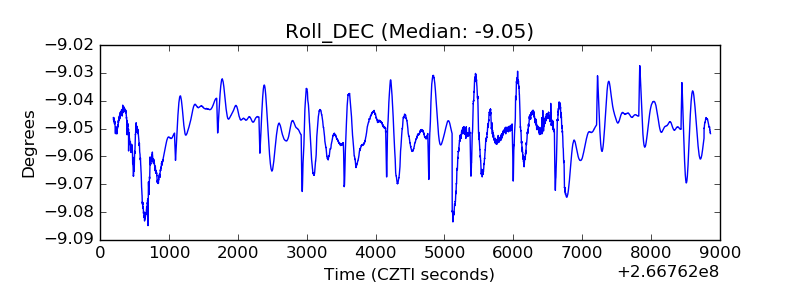 |
| _Roll_RA |  |
| Veto Counter | 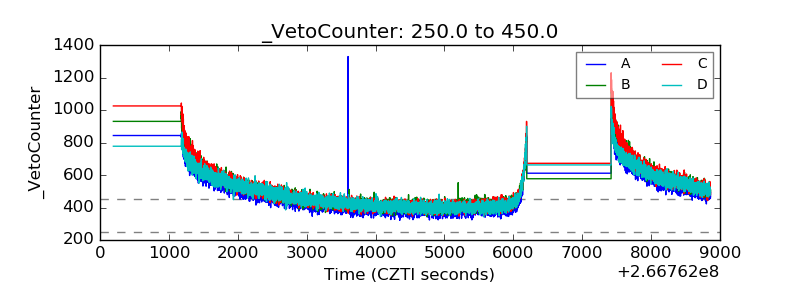 |