| Param | Original file | Final file |
|---|---|---|
| Filename | modeM0/AS1A04_101T01_9000002170_14676cztM0_level2.evt | modeM0/AS1A04_101T01_9000002170_14676cztM0_level2_quad_clean.evt |
| Size (bytes) | 462,905,280 | 108,999,360 |
| Size | 441.5 MB | 103.9 MB |
| Events in quadrant A | 3,538,423 | 736,862 |
| Events in quadrant B | 3,227,499 | 725,663 |
| Events in quadrant C | 3,685,245 | 716,323 |
| Events in quadrant D | 3,166,123 | 708,677 |
| Mode M9 | |||
|---|---|---|---|
| Quadrant | BADHDUFLAG | Total packets | Discarded packets |
| A | 0 | 13 | 0 |
| B | 0 | 13 | 0 |
| C | 0 | 13 | 0 |
| D | 0 | 13 | 0 |
| Mode SS | |||
|---|---|---|---|
| Quadrant | BADHDUFLAG | Total packets | Discarded packets |
| A | 0 | 120 | 0 |
| B | 0 | 120 | 0 |
| C | 0 | 120 | 0 |
| D | 0 | 120 | 0 |
| Mode M0 | |||
|---|---|---|---|
| Quadrant | BADHDUFLAG | Total packets | Discarded packets |
| A | 0 | 14566 | 2 |
| B | 0 | 13366 | 1 |
| C | 0 | 15334 | 1 |
| D | 0 | 13156 | 1 |
| Quadrant | Total seconds | Saturated seconds | Saturation percentage |
|---|---|---|---|
| A | 5924 | 77 | 1.299797% |
| B | 5924 | 75 | 1.266036% |
| C | 5924 | 68 | 1.147873% |
| D | 5924 | 57 | 0.962188% |
Noise dominated data is calculated using 1-second bins in cleaned event files. If a bin has >2000 counts, and if more than 50% of those come from <1% of pixels, then it is considered to be noise-dominated and hence unusable.
| Quadrant | # 1 sec bins | Bins with >0 counts | Bins with >2000 counts | High rate bins dominated by noise | Noise dominated (total time) | Noise dominated (detector-on time) | Marked lightcurve |
|---|---|---|---|---|---|---|---|
| A | 7215 | 5925 | 0 | 0 | 0.00% | 0.00% | 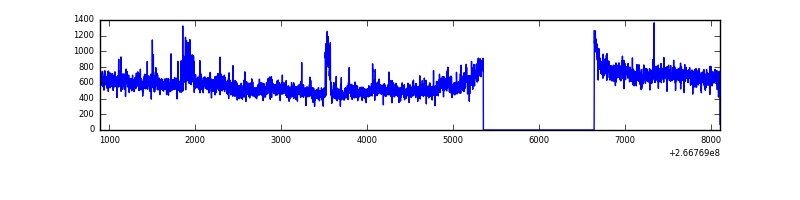 |
| B | 7215 | 5925 | 1 | 1 | 0.01% | 0.02% | 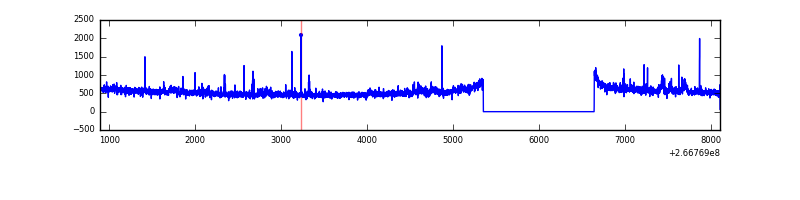 |
| C | 7215 | 5925 | 2 | 2 | 0.03% | 0.03% | 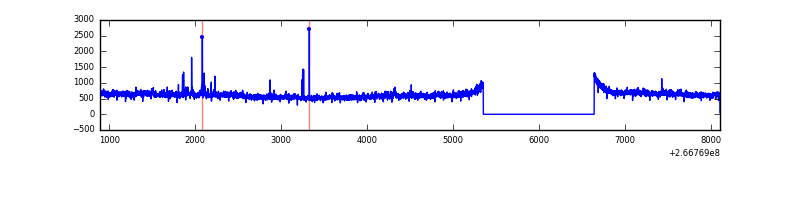 |
| D | 7215 | 5925 | 10 | 10 | 0.14% | 0.17% | 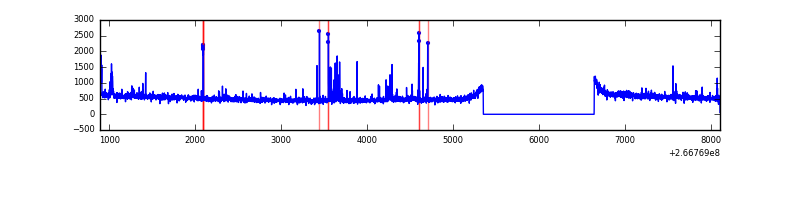 |
Top three noisy pixels from each quadrant. If the there are fewer than three noisy pixels in the level2.evt file, extra rows are filled as -1
| Pixel properties | Quadrant properties | ||||||
|---|---|---|---|---|---|---|---|
| Quadrant | DetID | PixID | Counts | Sigma | Mean | Median | Sigma |
| A | 8 | 15 | 295398 | 1810.63 | 806 | 792 | 162.7 |
| A | 0 | 253 | 104295 | 636.12 | 806 | 792 | 162.7 |
| A | 1 | 162 | 16416 | 96.02 | 806 | 792 | 162.7 |
| B | 10 | 16 | 74252 | 496.54 | 784 | 766 | 148.0 |
| B | 0 | 214 | 24587 | 160.96 | 784 | 766 | 148.0 |
| B | 0 | 205 | 22284 | 145.4 | 784 | 766 | 148.0 |
| C | 3 | 233 | 660527 | 3739.04 | 768 | 775 | 176.4 |
| C | 0 | 207 | 19117 | 103.95 | 768 | 775 | 176.4 |
| C | 14 | 234 | 9907 | 51.75 | 768 | 775 | 176.4 |
| D | 12 | 2 | 92798 | 447.74 | 775 | 761 | 205.6 |
| D | 2 | 152 | 37900 | 180.67 | 775 | 761 | 205.6 |
| D | 2 | 234 | 22124 | 103.93 | 775 | 761 | 205.6 |
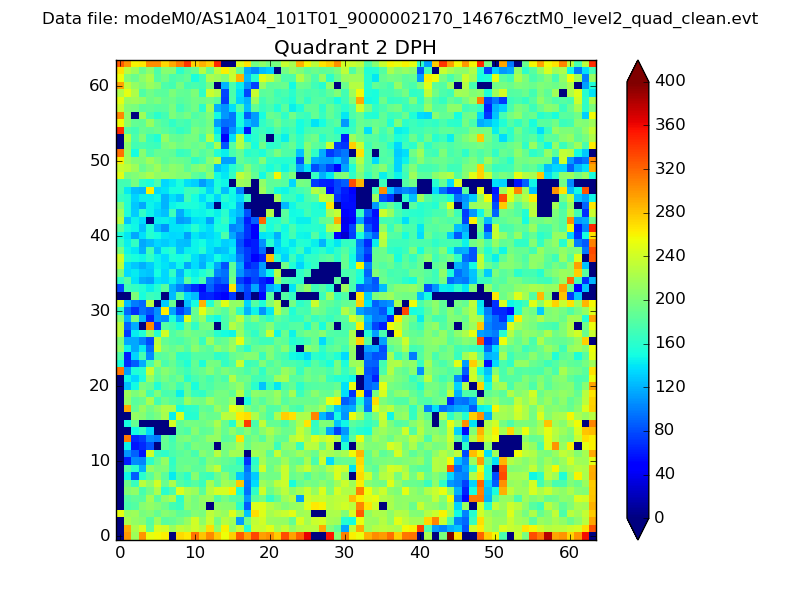
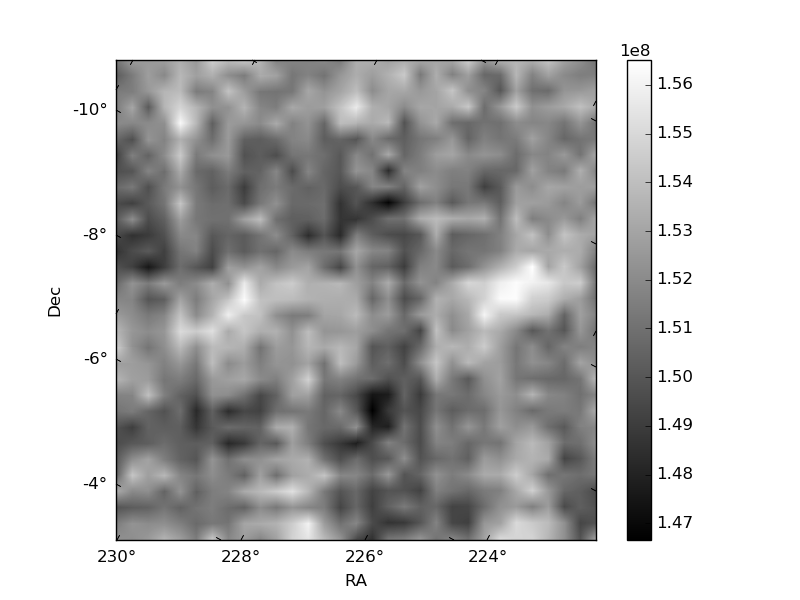
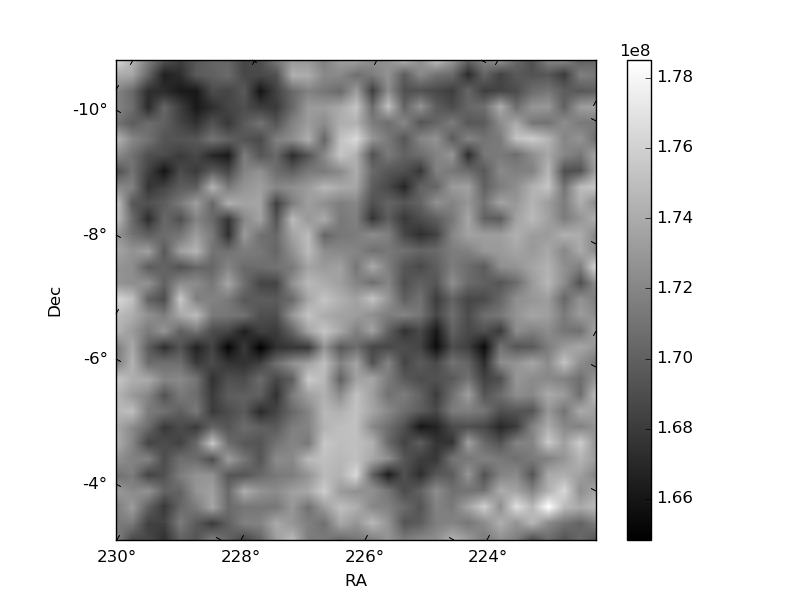
Histogram calculated using DETX and DETY for each event in the final _common_clean file
| Quadrant A | 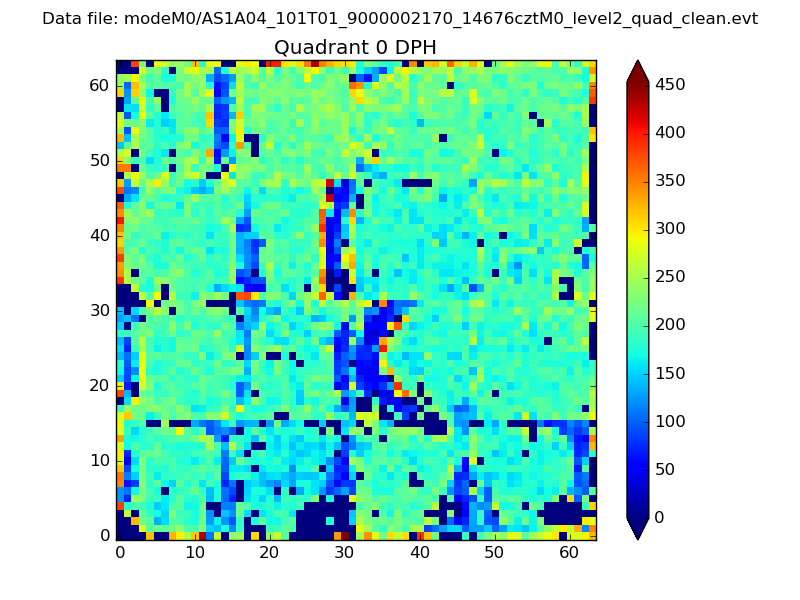 |
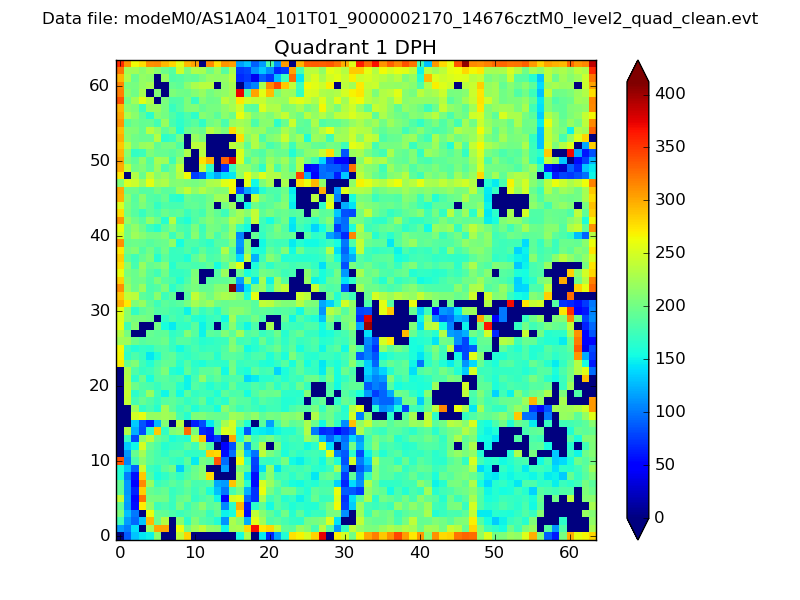 |
Quadrant B |
|---|---|---|---|
| Quadrant D | 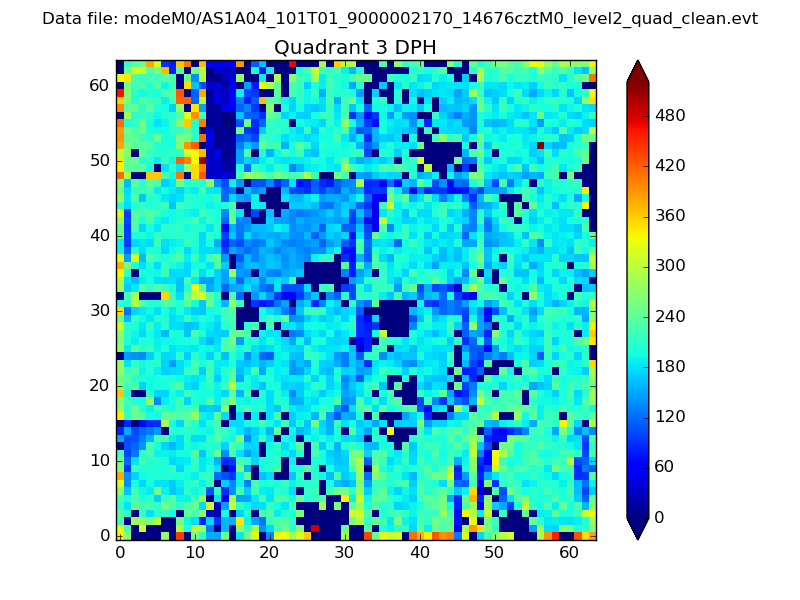 |
 |
Quadrant C |
| Plot type | Count rate plots | Images |
|---|---|---|
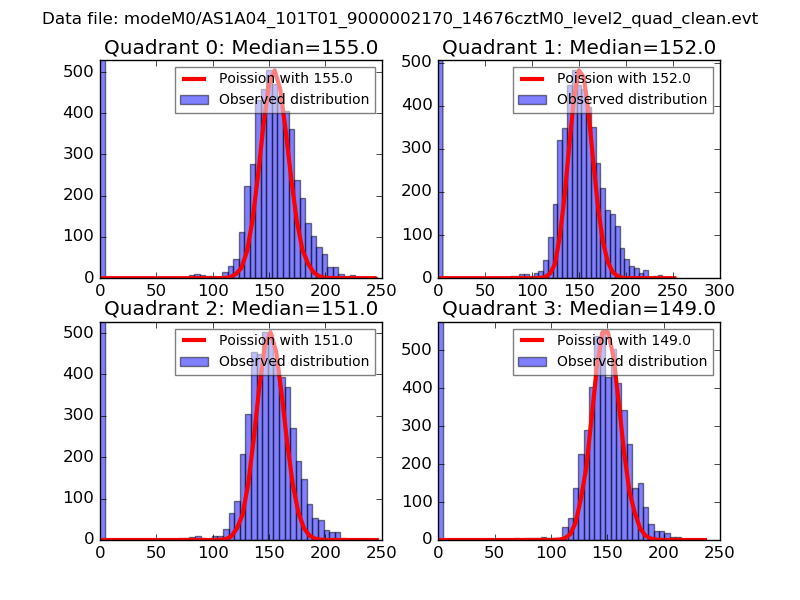
| Comparison with Poisson distribution Blue bars denote a histogram of data divided into 1 sec bins. Red curve is a Poisson curve with rate = median count rate of data. |
 |
 |
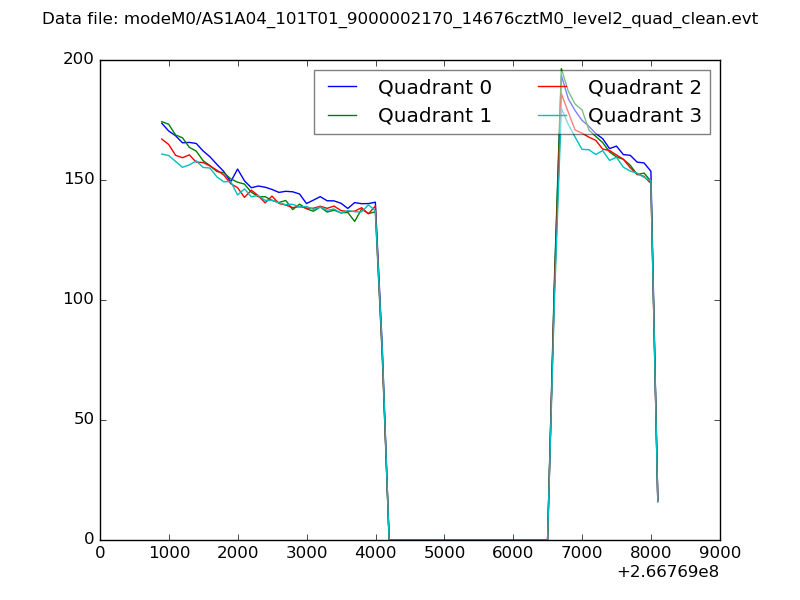
| Quadrant-wise count rates Data is divided into 100 sec bins |
 |
|
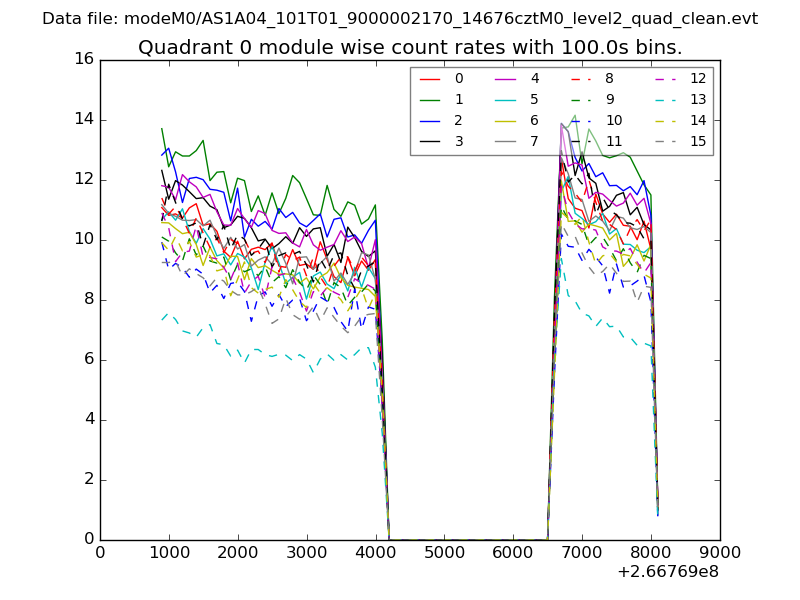
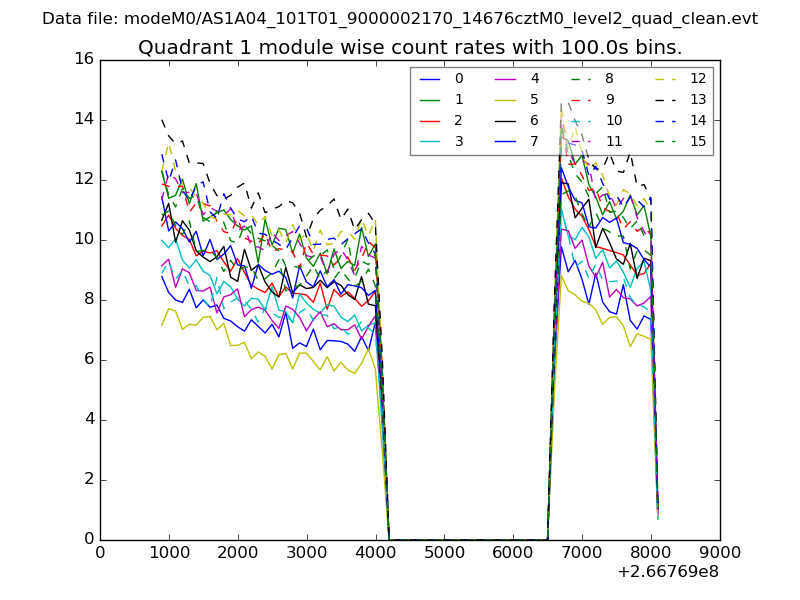
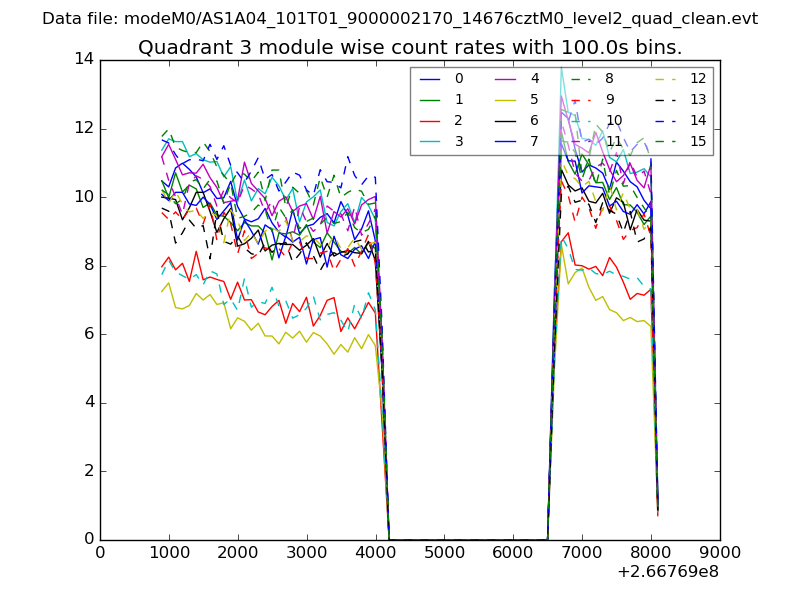
| Module-wise count rates for Quadrant A Data is divided into 100 sec bins |
 |
 |
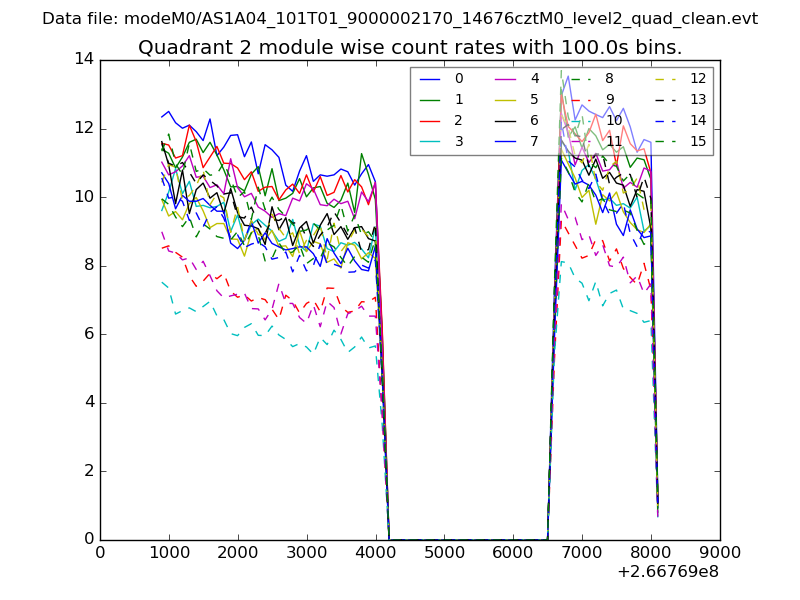
| Module-wise count rates for Quadrant B Data is divided into 100 sec bins |
 |
 |
| Module-wise count rates for Quadrant C Data is divided into 100 sec bins |
 |
 |
| Module-wise count rates for Quadrant D Data is divided into 100 sec bins |
 |
 |
| Parameter | Plot |
|---|---|
| CZT HV Monitor | 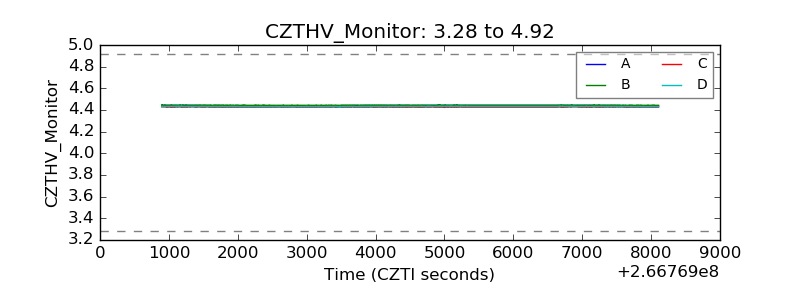 |
| D_VDD | 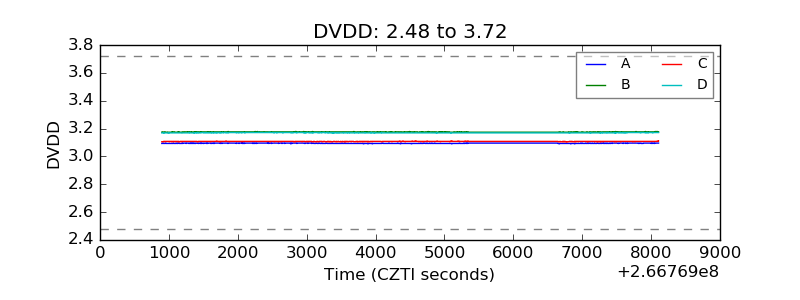 |
| Temperature 1 | 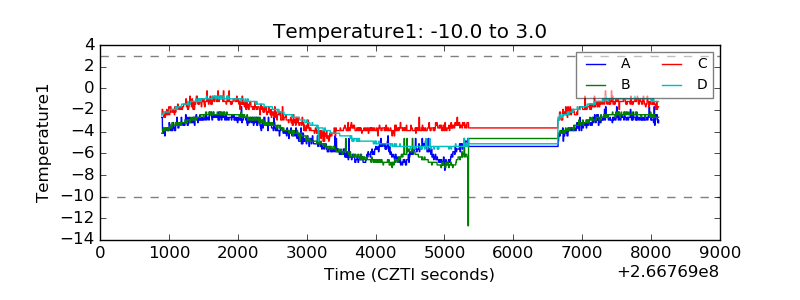 |
| Veto HV Monitor | 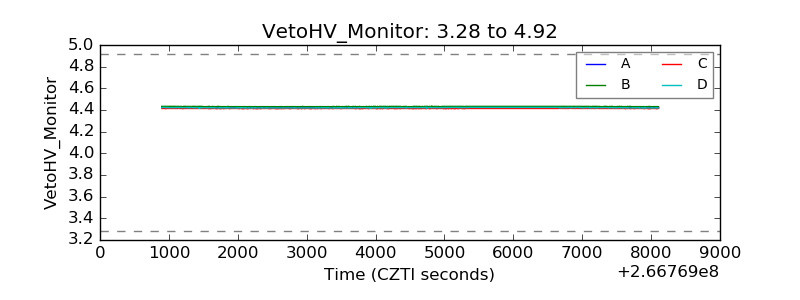 |
| Veto LLD | 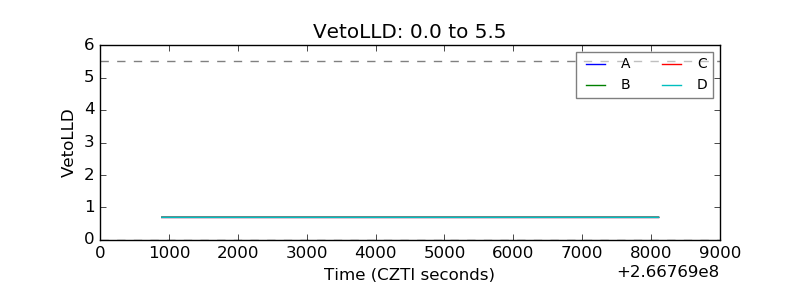 |
| Alpha Counter | 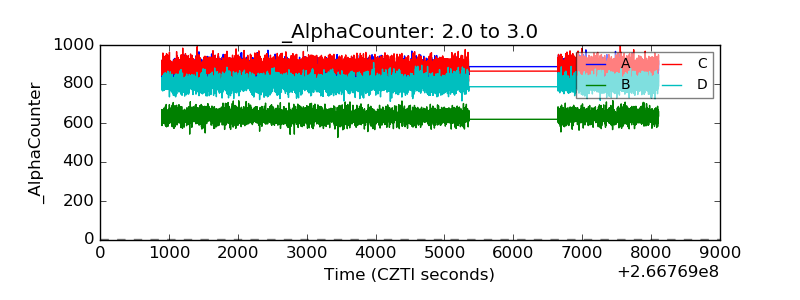 |
| _CPM_Rate | 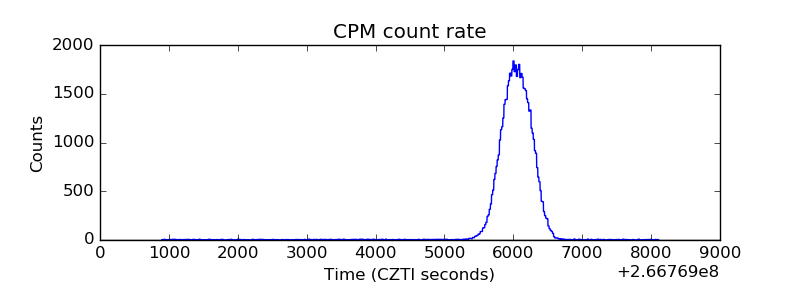 |
| CZT Counter | 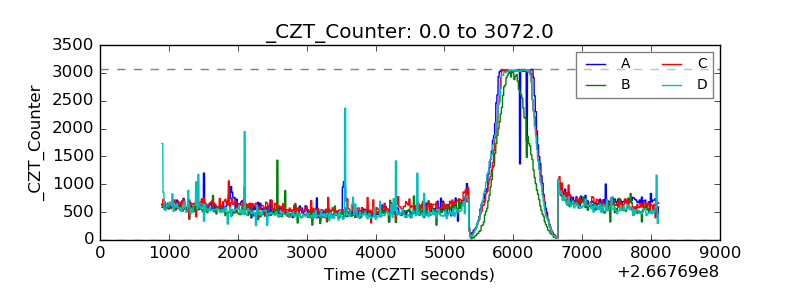 |
| +2.5 Volts monitor |  |
| +5 Volts monitor |  |
| _ROLL_ROT | 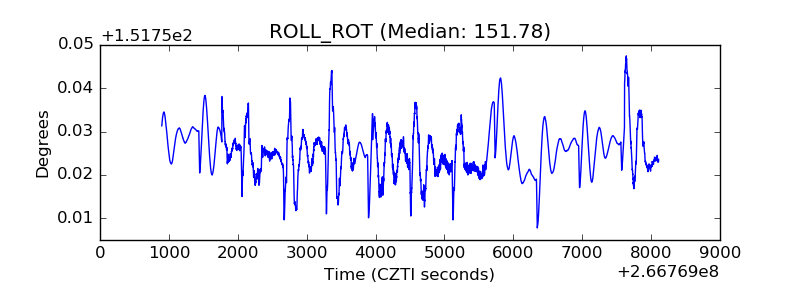 |
| _Roll_DEC | 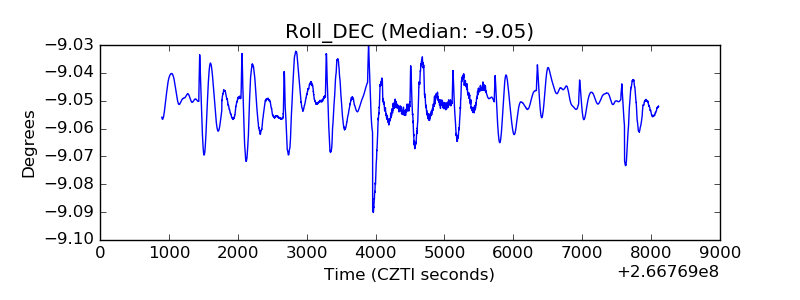 |
| _Roll_RA | 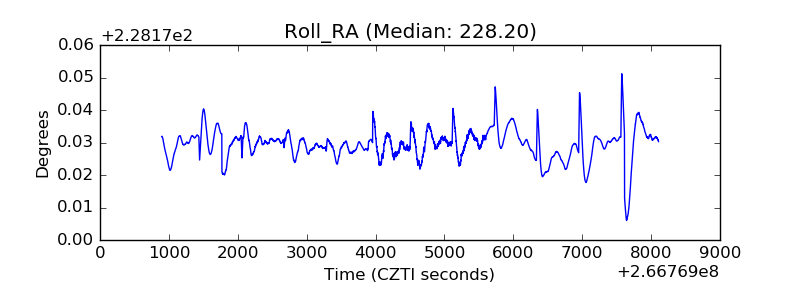 |
| Veto Counter | 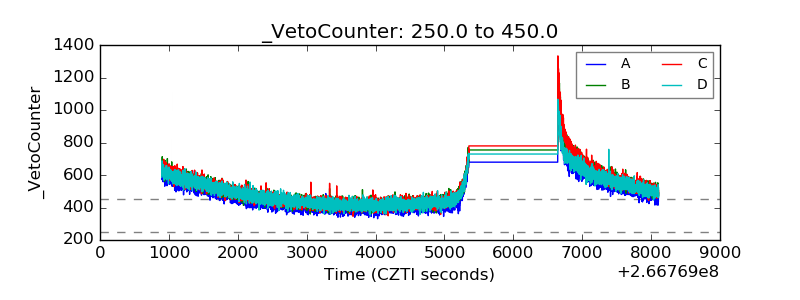 |