| Param | Original file | Final file |
|---|---|---|
| Filename | modeM0/AS1A04_101T01_9000002170_14678cztM0_level2.evt | modeM0/AS1A04_101T01_9000002170_14678cztM0_level2_quad_clean.evt |
| Size (bytes) | 520,692,480 | 97,617,600 |
| Size | 496.6 MB | 93.1 MB |
| Events in quadrant A | 4,888,868 | 629,189 |
| Events in quadrant B | 3,391,360 | 628,670 |
| Events in quadrant C | 3,823,453 | 626,644 |
| Events in quadrant D | 3,225,014 | 618,547 |
| Mode M9 | |||
|---|---|---|---|
| Quadrant | BADHDUFLAG | Total packets | Discarded packets |
| A | 0 | 16 | 0 |
| B | 0 | 16 | 0 |
| C | 0 | 16 | 0 |
| D | 0 | 17 | 0 |
| Mode SS | |||
|---|---|---|---|
| Quadrant | BADHDUFLAG | Total packets | Discarded packets |
| A | 0 | 132 | 0 |
| B | 0 | 132 | 0 |
| C | 0 | 132 | 0 |
| D | 0 | 132 | 0 |
| Mode M0 | |||
|---|---|---|---|
| Quadrant | BADHDUFLAG | Total packets | Discarded packets |
| A | 0 | 19196 | 3 |
| B | 0 | 14201 | 2 |
| C | 0 | 15660 | 2 |
| D | 0 | 13962 | 2 |
| Quadrant | Total seconds | Saturated seconds | Saturation percentage |
|---|---|---|---|
| A | 6498 | 174 | 2.677747% |
| B | 6498 | 100 | 1.538935% |
| C | 6498 | 86 | 1.323484% |
| D | 6498 | 61 | 0.938750% |
Noise dominated data is calculated using 1-second bins in cleaned event files. If a bin has >2000 counts, and if more than 50% of those come from <1% of pixels, then it is considered to be noise-dominated and hence unusable.
| Quadrant | # 1 sec bins | Bins with >0 counts | Bins with >2000 counts | High rate bins dominated by noise | Noise dominated (total time) | Noise dominated (detector-on time) | Marked lightcurve |
|---|---|---|---|---|---|---|---|
| A | 7709 | 6499 | 26 | 26 | 0.34% | 0.40% | 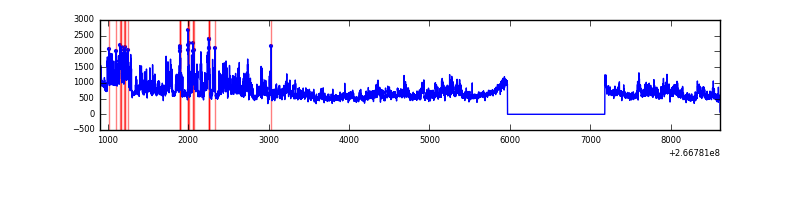 |
| B | 7709 | 6499 | 6 | 6 | 0.08% | 0.09% | 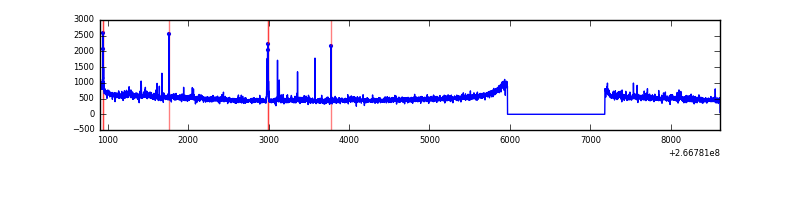 |
| C | 7709 | 6499 | 1 | 1 | 0.01% | 0.02% | 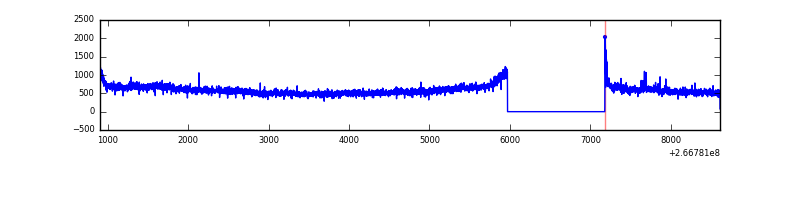 |
| D | 7709 | 6499 | 4 | 4 | 0.05% | 0.06% | 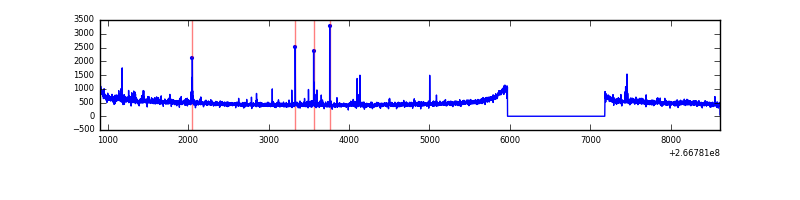 |
Top three noisy pixels from each quadrant. If the there are fewer than three noisy pixels in the level2.evt file, extra rows are filled as -1
| Pixel properties | Quadrant properties | ||||||
|---|---|---|---|---|---|---|---|
| Quadrant | DetID | PixID | Counts | Sigma | Mean | Median | Sigma |
| A | 8 | 15 | 1258658 | 7381.61 | 845 | 830 | 170.4 |
| A | 0 | 253 | 299759 | 1754.27 | 845 | 830 | 170.4 |
| A | 1 | 162 | 40794 | 234.53 | 845 | 830 | 170.4 |
| B | 0 | 219 | 39431 | 241.74 | 833 | 813 | 159.7 |
| B | 0 | 205 | 26462 | 160.56 | 833 | 813 | 159.7 |
| B | 0 | 197 | 24374 | 147.49 | 833 | 813 | 159.7 |
| C | 3 | 233 | 636870 | 3377.52 | 813 | 819 | 188.3 |
| C | 0 | 207 | 12852 | 63.9 | 813 | 819 | 188.3 |
| C | 13 | 61 | 5872 | 26.83 | 813 | 819 | 188.3 |
| D | 2 | 120 | 28914 | 129.18 | 817 | 803 | 217.6 |
| D | 2 | 152 | 28349 | 126.58 | 817 | 803 | 217.6 |
| D | 2 | 234 | 24236 | 107.68 | 817 | 803 | 217.6 |
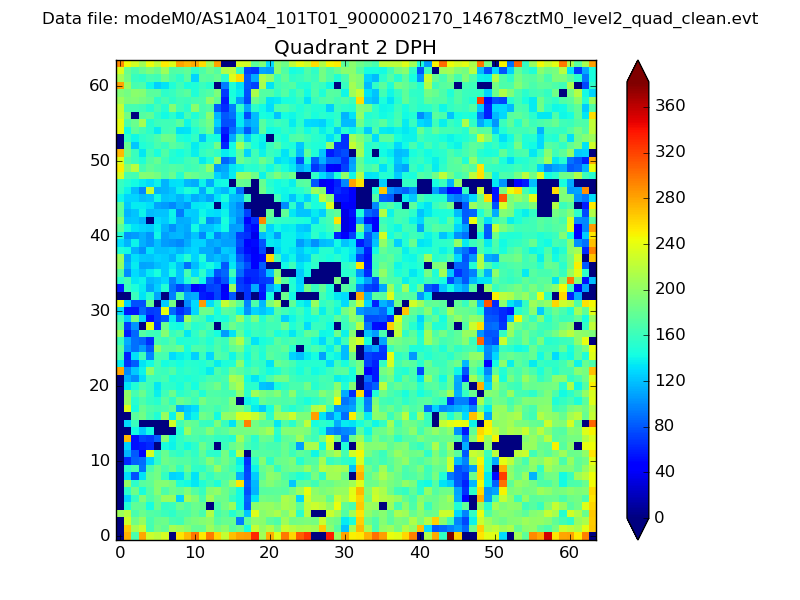
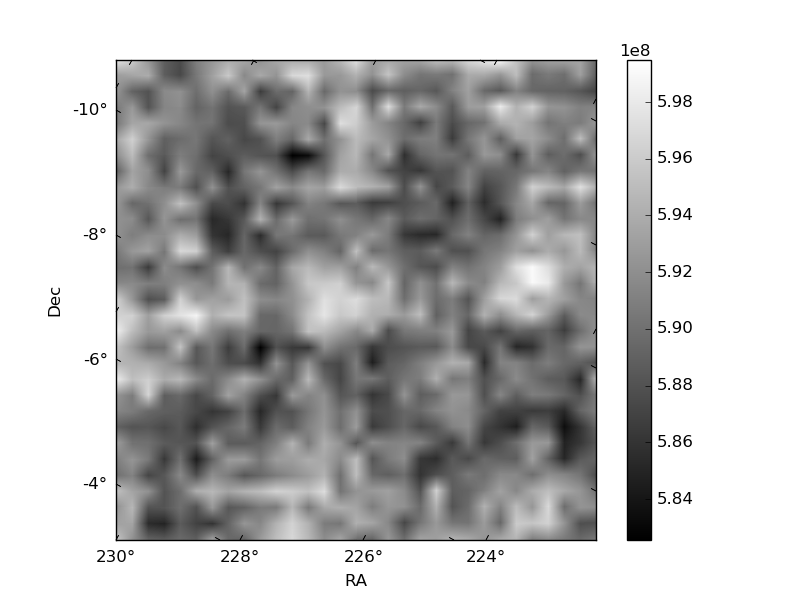
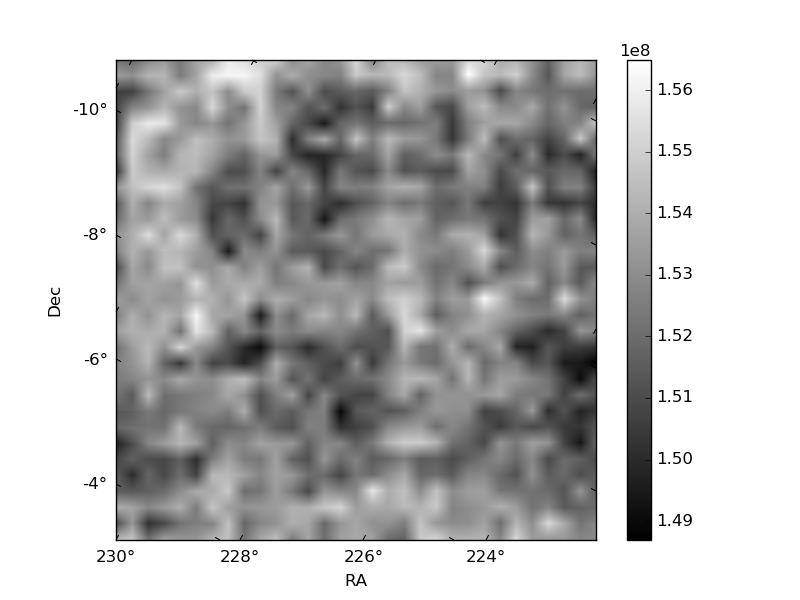
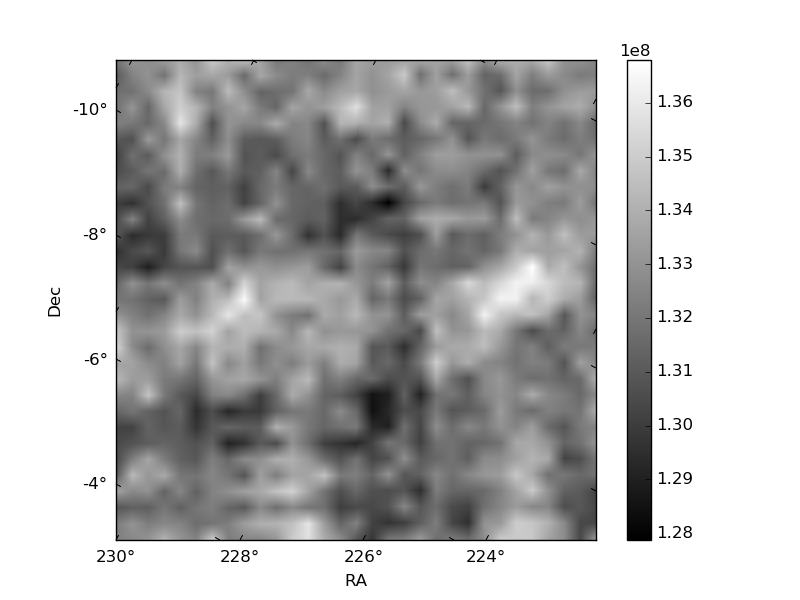
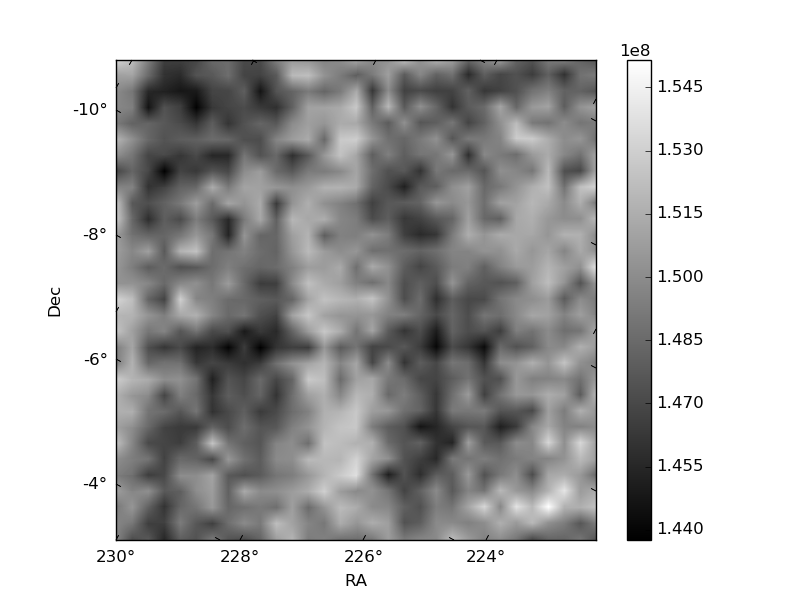
Histogram calculated using DETX and DETY for each event in the final _common_clean file
| Quadrant A | 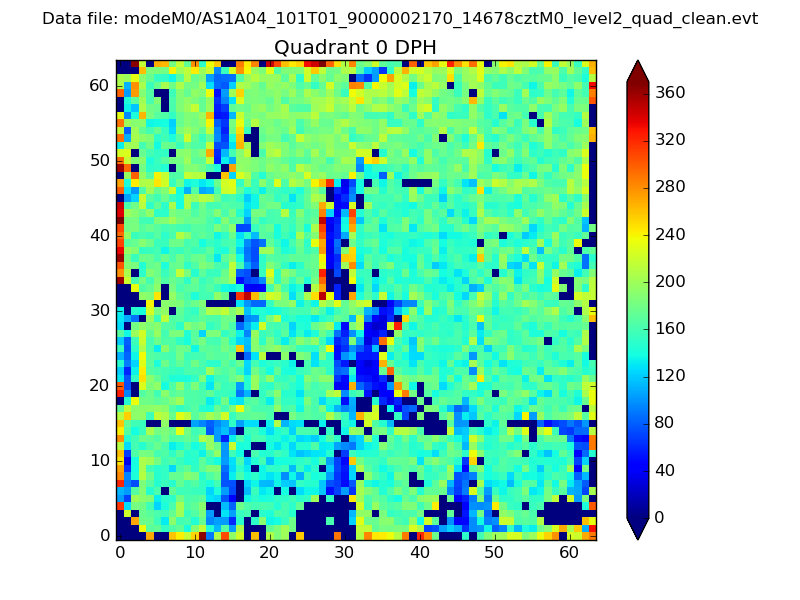 |
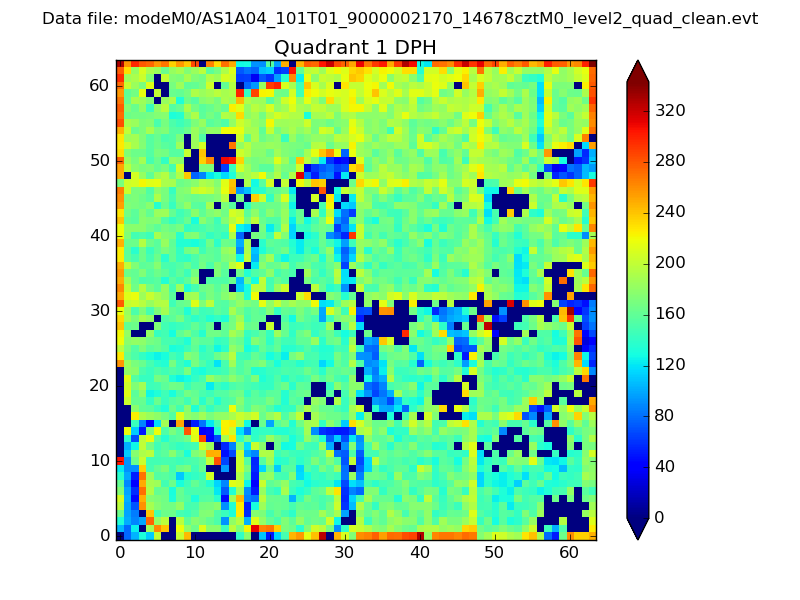 |
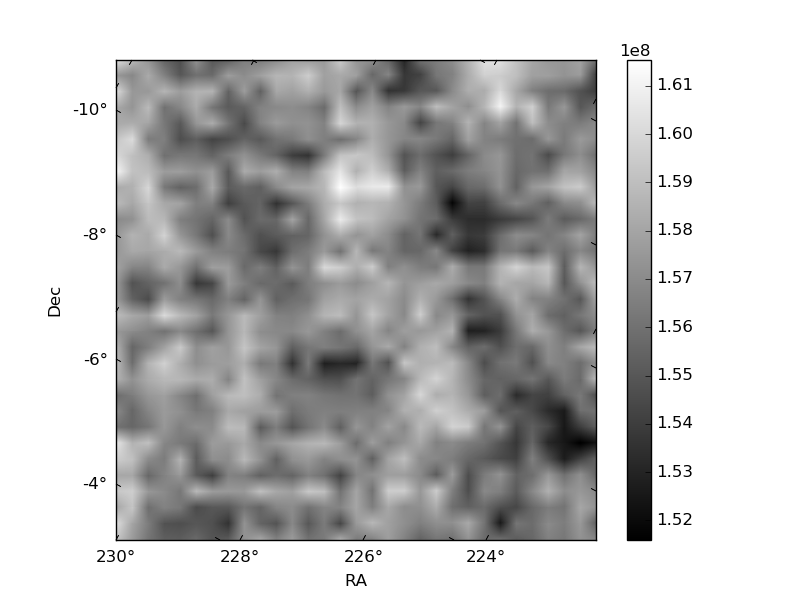
Quadrant B |
|---|---|---|---|
| Quadrant D | 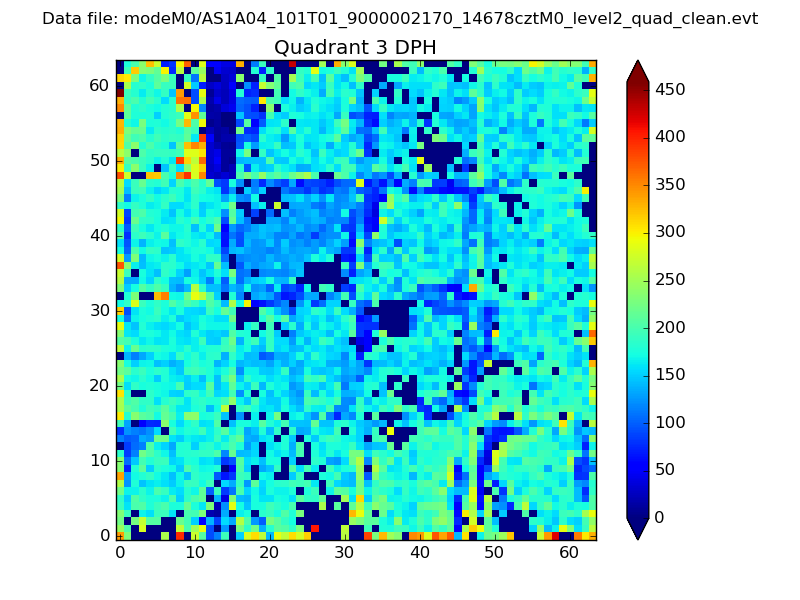 |
 |
Quadrant C |
| Plot type | Count rate plots | Images |
|---|---|---|
| Comparison with Poisson distribution Blue bars denote a histogram of data divided into 1 sec bins. Red curve is a Poisson curve with rate = median count rate of data. |
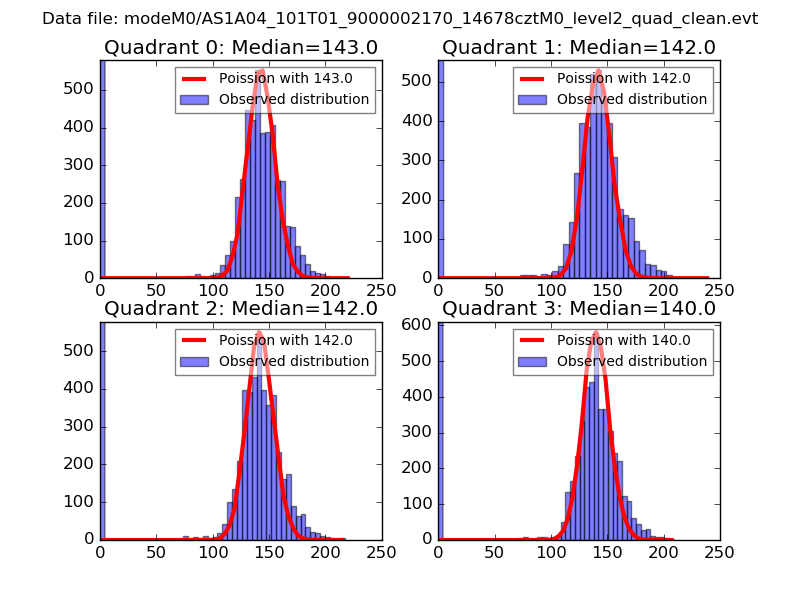 |
 |
| Quadrant-wise count rates Data is divided into 100 sec bins |
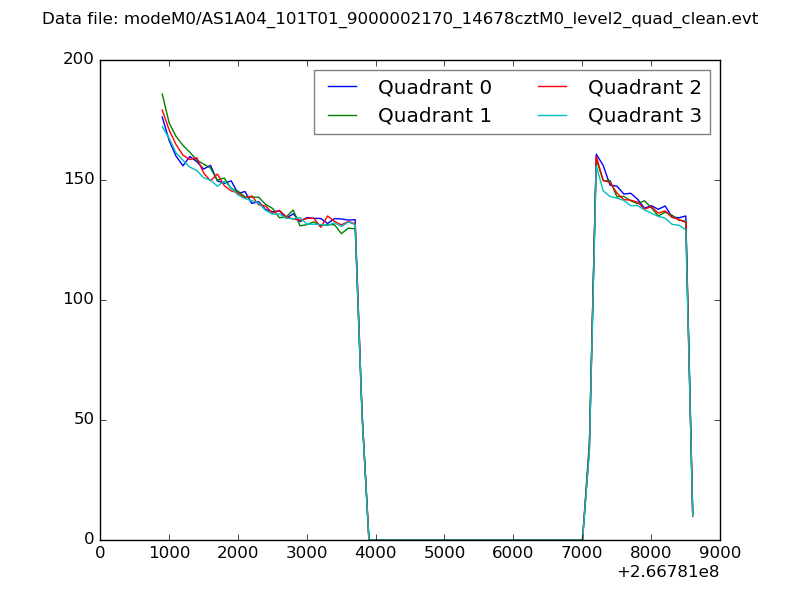 |
|
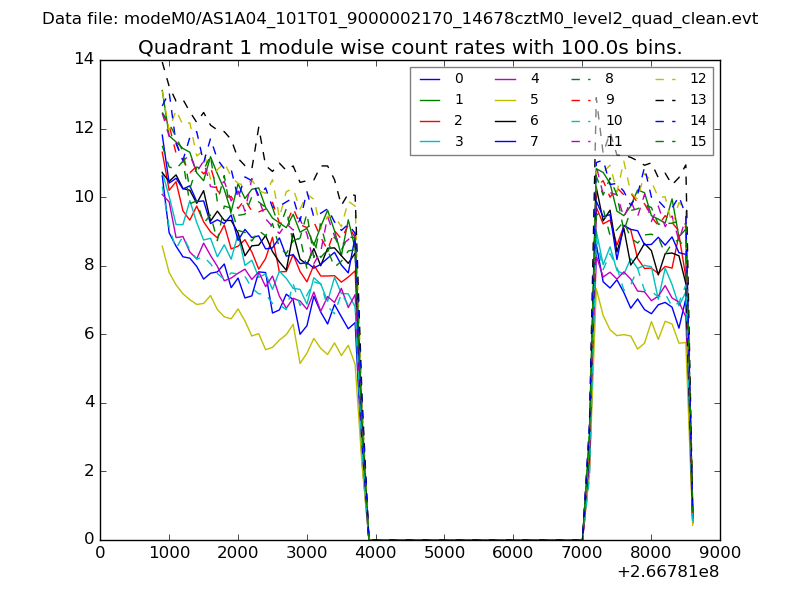
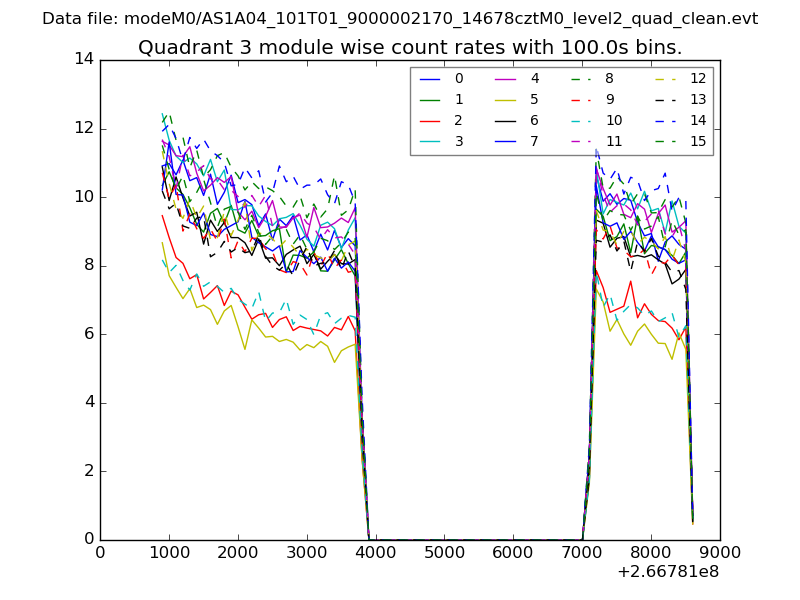
| Module-wise count rates for Quadrant A Data is divided into 100 sec bins |
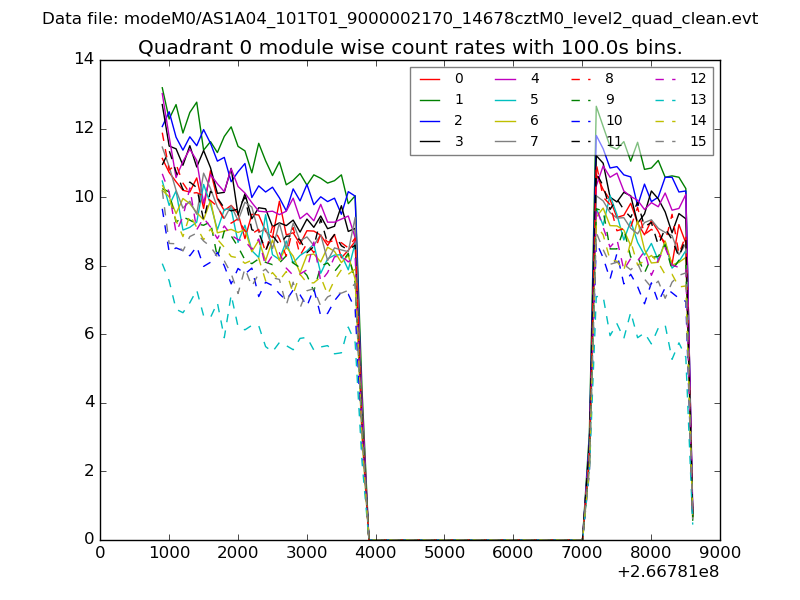 |
 |
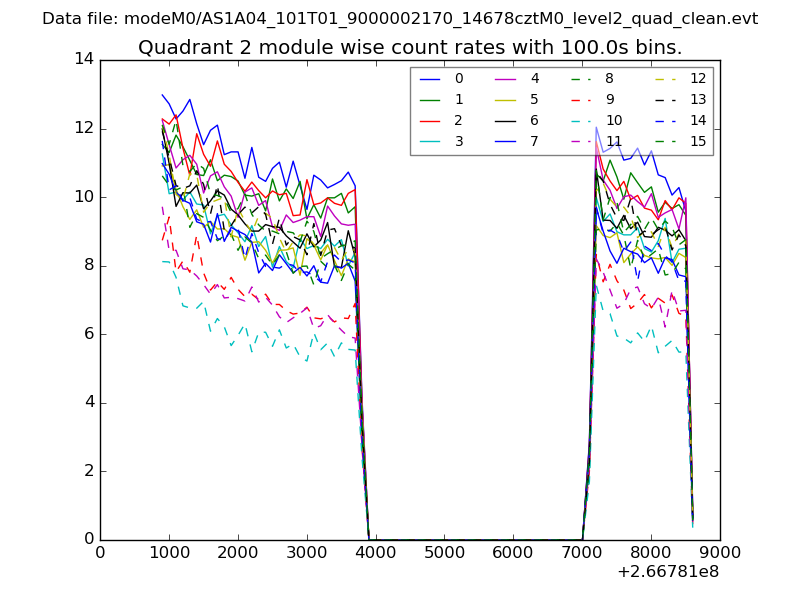
| Module-wise count rates for Quadrant B Data is divided into 100 sec bins |
 |
 |
| Module-wise count rates for Quadrant C Data is divided into 100 sec bins |
 |
 |
| Module-wise count rates for Quadrant D Data is divided into 100 sec bins |
 |
 |
| Parameter | Plot |
|---|---|
| CZT HV Monitor | 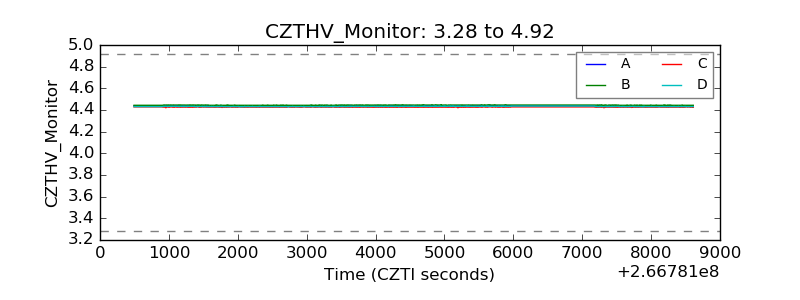 |
| D_VDD | 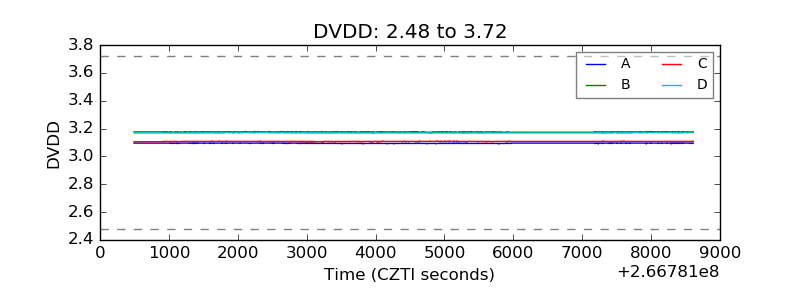 |
| Temperature 1 |  |
| Veto HV Monitor | 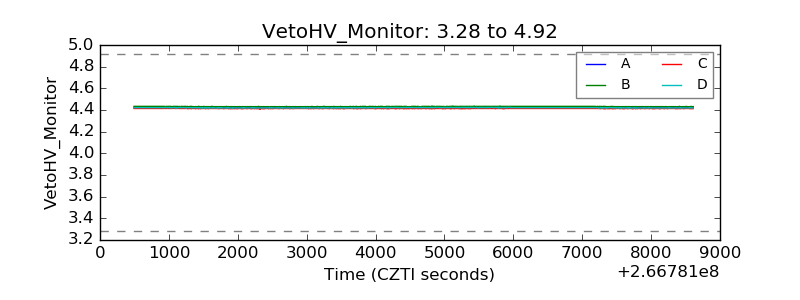 |
| Veto LLD | 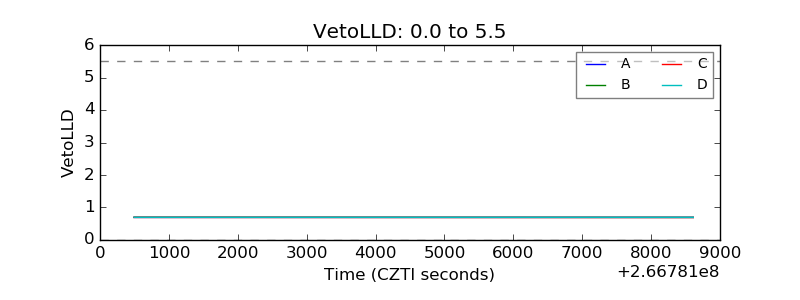 |
| Alpha Counter | 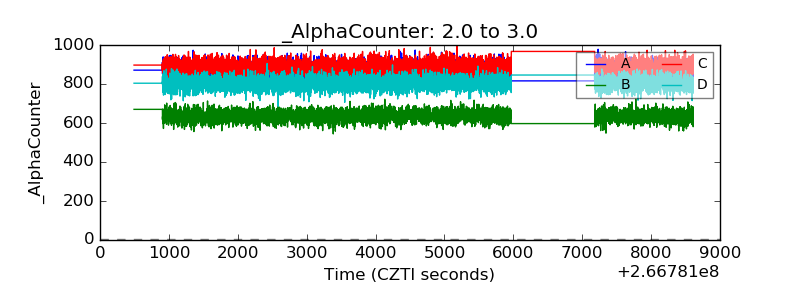 |
| _CPM_Rate | 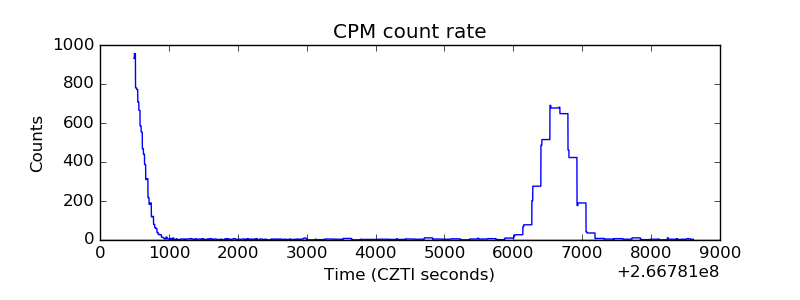 |
| CZT Counter | 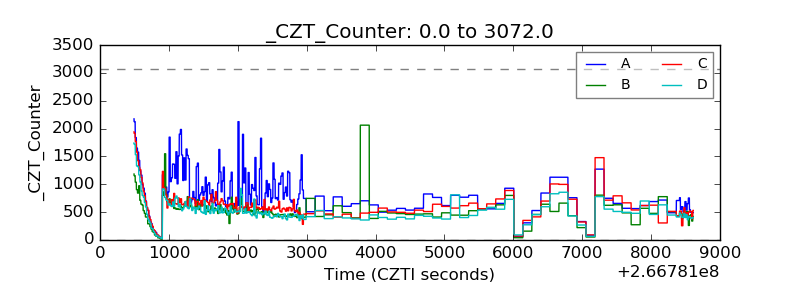 |
| +2.5 Volts monitor | 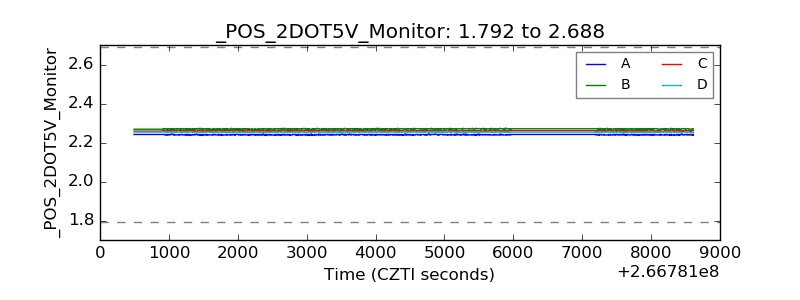 |
| +5 Volts monitor | 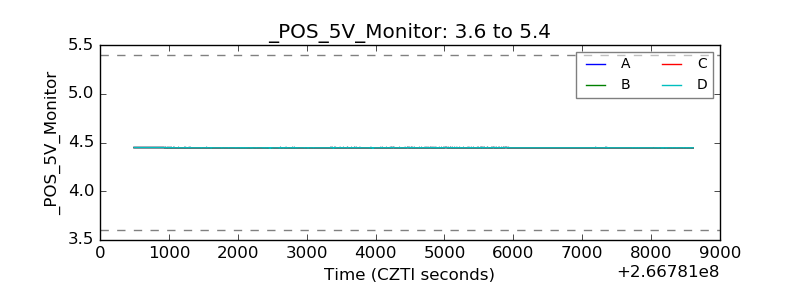 |
| _ROLL_ROT | 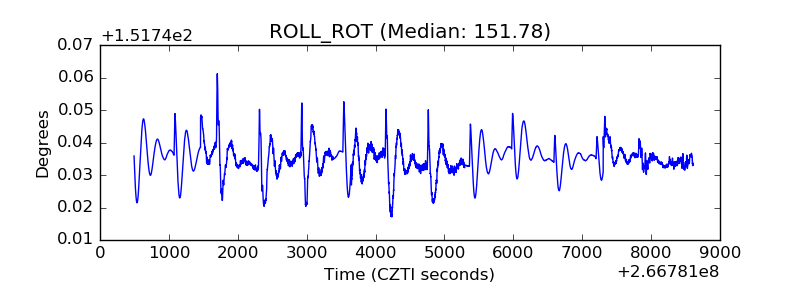 |
| _Roll_DEC | 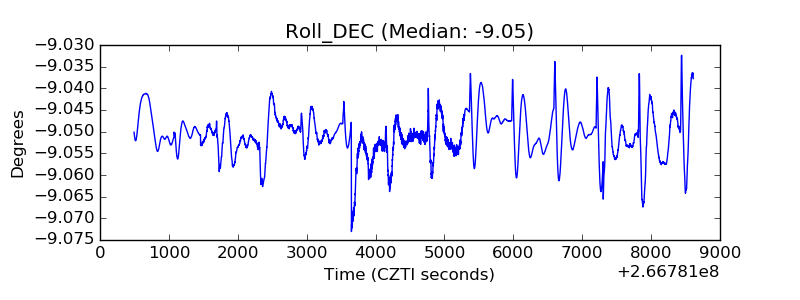 |
| _Roll_RA | 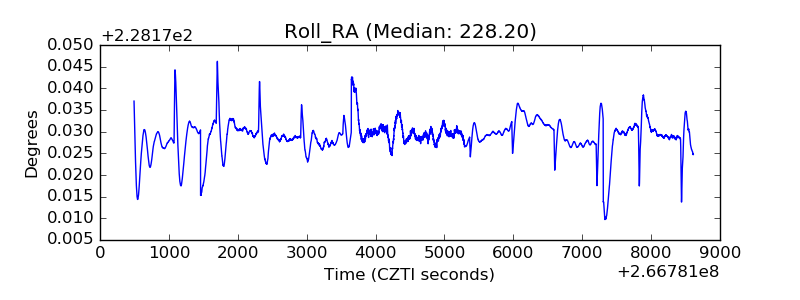 |
| Veto Counter | 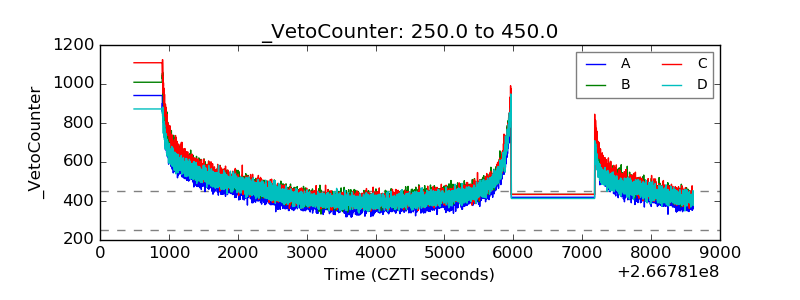 |