| Param | Original file | Final file |
|---|---|---|
| Filename | modeM0/AS1A04_101T01_9000002170_14679cztM0_level2.evt | modeM0/AS1A04_101T01_9000002170_14679cztM0_level2_quad_clean.evt |
| Size (bytes) | 496,938,240 | 92,733,120 |
| Size | 473.9 MB | 88.4 MB |
| Events in quadrant A | 4,220,739 | 593,937 |
| Events in quadrant B | 3,334,545 | 588,206 |
| Events in quadrant C | 3,663,867 | 588,037 |
| Events in quadrant D | 3,382,718 | 577,817 |
| Mode M9 | |||
|---|---|---|---|
| Quadrant | BADHDUFLAG | Total packets | Discarded packets |
| A | 0 | 21 | 0 |
| B | 0 | 21 | 0 |
| C | 0 | 21 | 0 |
| D | 0 | 21 | 0 |
| Mode SS | |||
|---|---|---|---|
| Quadrant | BADHDUFLAG | Total packets | Discarded packets |
| A | 0 | 138 | 0 |
| B | 0 | 138 | 0 |
| C | 0 | 138 | 0 |
| D | 0 | 138 | 0 |
| Mode M0 | |||
|---|---|---|---|
| Quadrant | BADHDUFLAG | Total packets | Discarded packets |
| A | 0 | 17122 | 3 |
| B | 0 | 14202 | 2 |
| C | 0 | 14863 | 2 |
| D | 0 | 14484 | 2 |
| Quadrant | Total seconds | Saturated seconds | Saturation percentage |
|---|---|---|---|
| A | 6596 | 56 | 0.848999% |
| B | 6596 | 52 | 0.788357% |
| C | 6596 | 33 | 0.500303% |
| D | 6596 | 96 | 1.455428% |
Noise dominated data is calculated using 1-second bins in cleaned event files. If a bin has >2000 counts, and if more than 50% of those come from <1% of pixels, then it is considered to be noise-dominated and hence unusable.
| Quadrant | # 1 sec bins | Bins with >0 counts | Bins with >2000 counts | High rate bins dominated by noise | Noise dominated (total time) | Noise dominated (detector-on time) | Marked lightcurve |
|---|---|---|---|---|---|---|---|
| A | 8762 | 6598 | 2 | 2 | 0.02% | 0.03% | 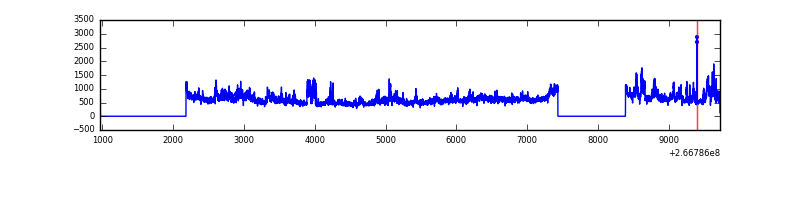 |
| B | 8762 | 6597 | 2 | 2 | 0.02% | 0.03% | 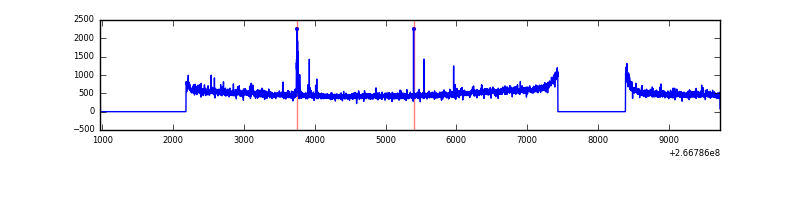 |
| C | 8762 | 6598 | 1 | 1 | 0.01% | 0.02% | 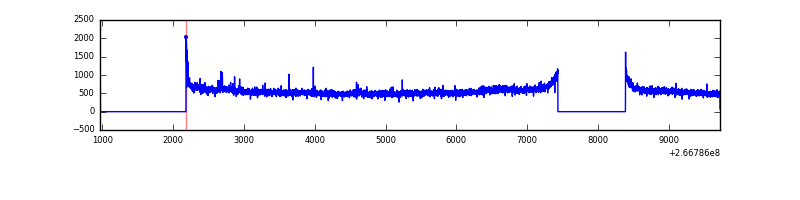 |
| D | 8762 | 6598 | 79 | 79 | 0.90% | 1.20% | 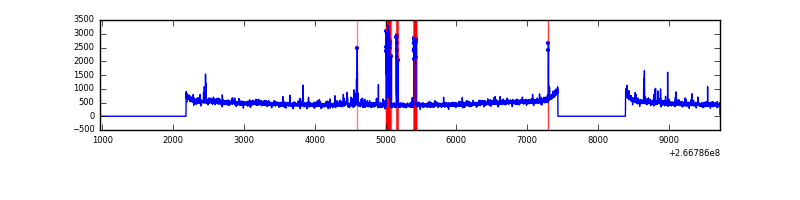 |
Top three noisy pixels from each quadrant. If the there are fewer than three noisy pixels in the level2.evt file, extra rows are filled as -1
| Pixel properties | Quadrant properties | ||||||
|---|---|---|---|---|---|---|---|
| Quadrant | DetID | PixID | Counts | Sigma | Mean | Median | Sigma |
| A | 8 | 15 | 854554 | 5127.53 | 824 | 806 | 166.5 |
| A | 0 | 253 | 152306 | 909.89 | 824 | 806 | 166.5 |
| A | 12 | 189 | 17368 | 99.47 | 824 | 806 | 166.5 |
| B | 10 | 16 | 70131 | 445.76 | 814 | 793 | 155.6 |
| B | 0 | 219 | 44136 | 278.64 | 814 | 793 | 155.6 |
| B | 0 | 197 | 18645 | 114.77 | 814 | 793 | 155.6 |
| C | 3 | 233 | 551916 | 2992.13 | 794 | 799 | 184.2 |
| C | 0 | 207 | 12801 | 65.16 | 794 | 799 | 184.2 |
| C | 13 | 61 | 5708 | 26.65 | 794 | 799 | 184.2 |
| D | 10 | 199 | 138129 | 651.33 | 787 | 774 | 210.9 |
| D | 2 | 14 | 78440 | 368.29 | 787 | 774 | 210.9 |
| D | 12 | 110 | 48375 | 225.72 | 787 | 774 | 210.9 |
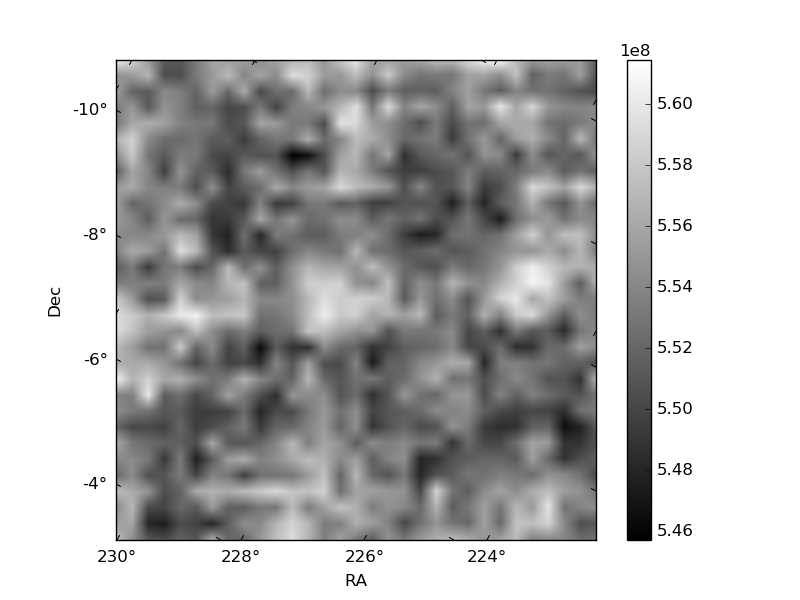
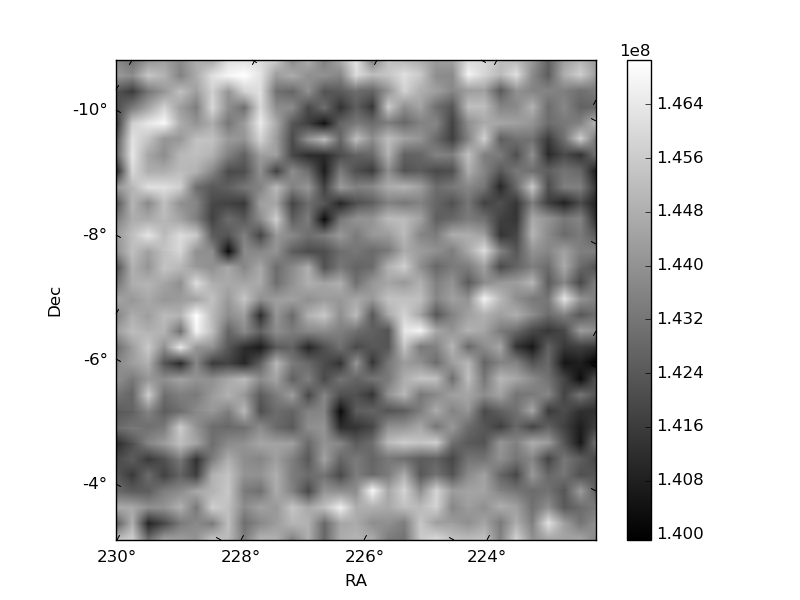
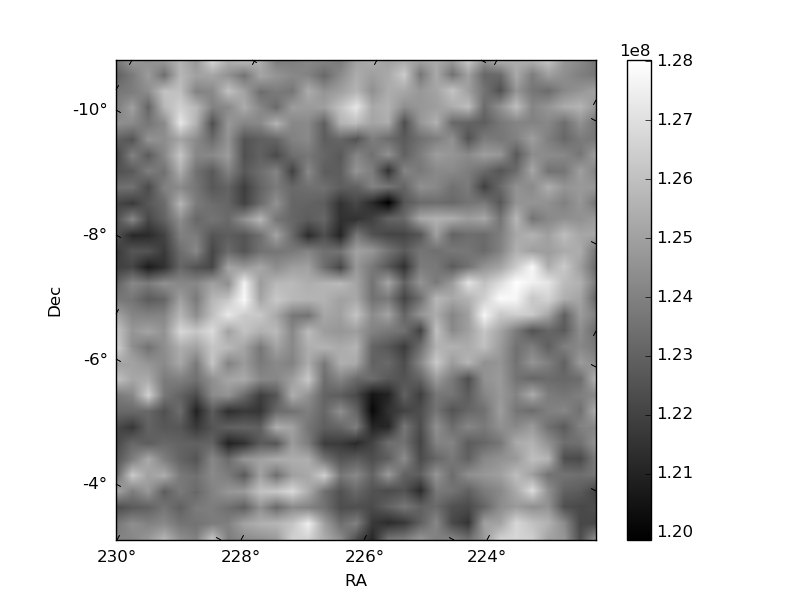
Histogram calculated using DETX and DETY for each event in the final _common_clean file
| Quadrant A | 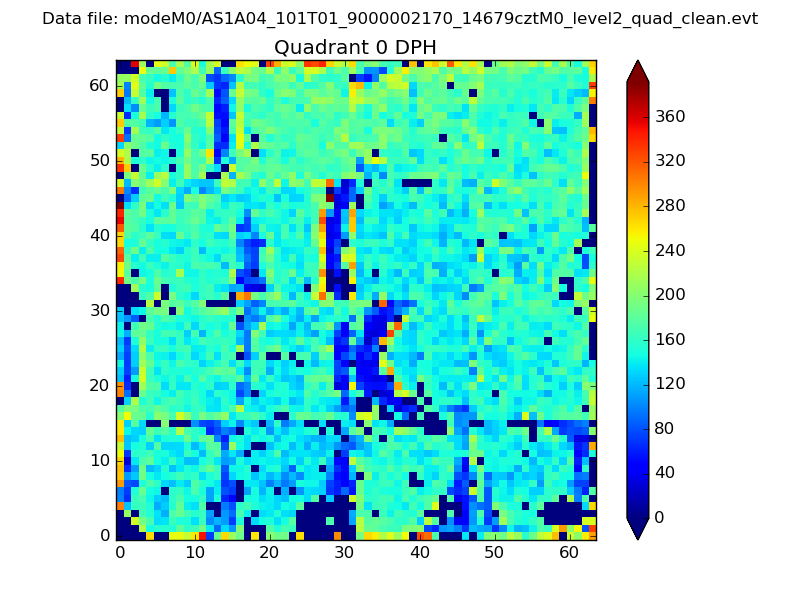 |
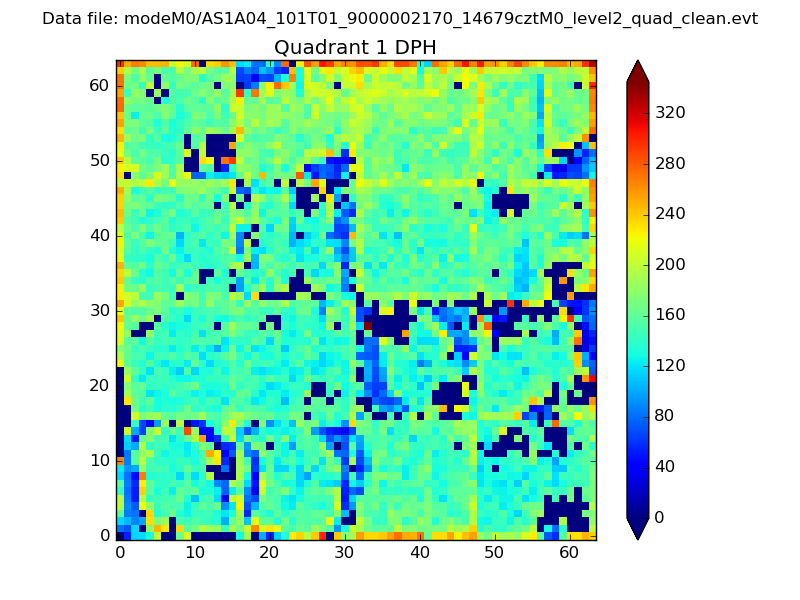 |
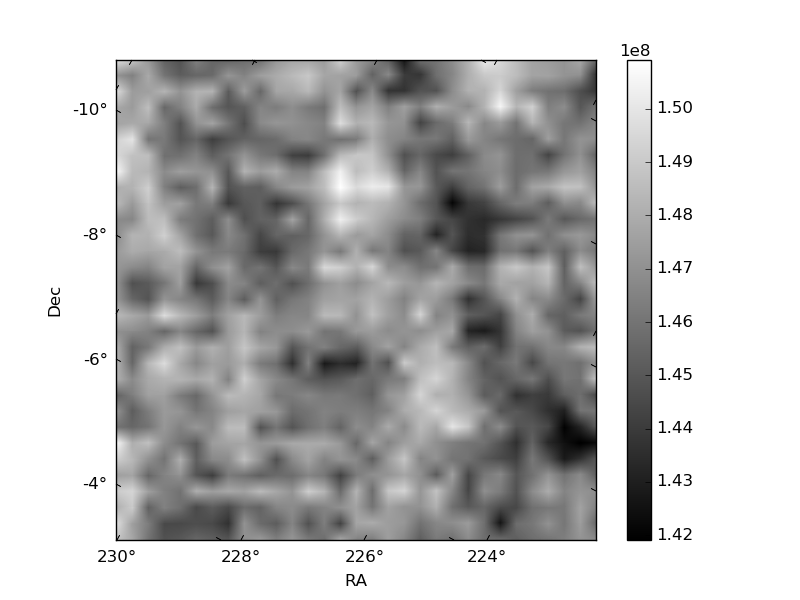
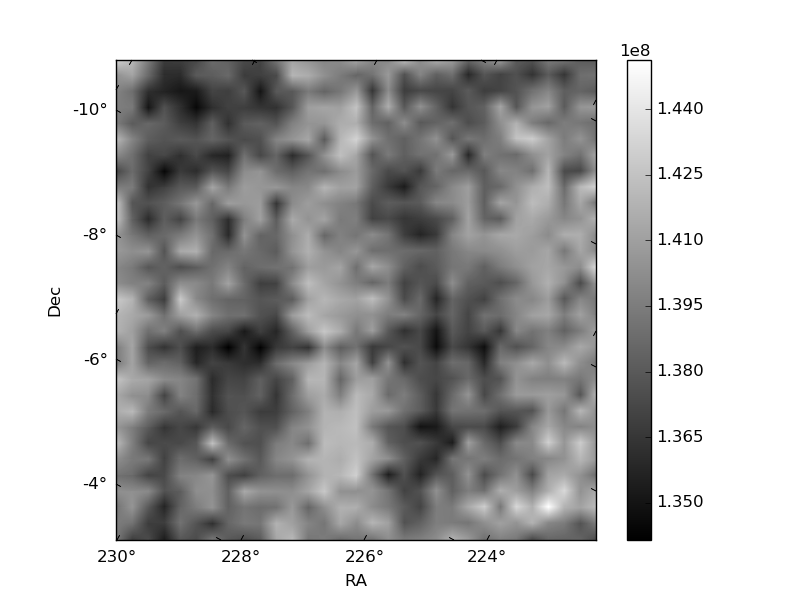
Quadrant B |
|---|---|---|---|
| Quadrant D | 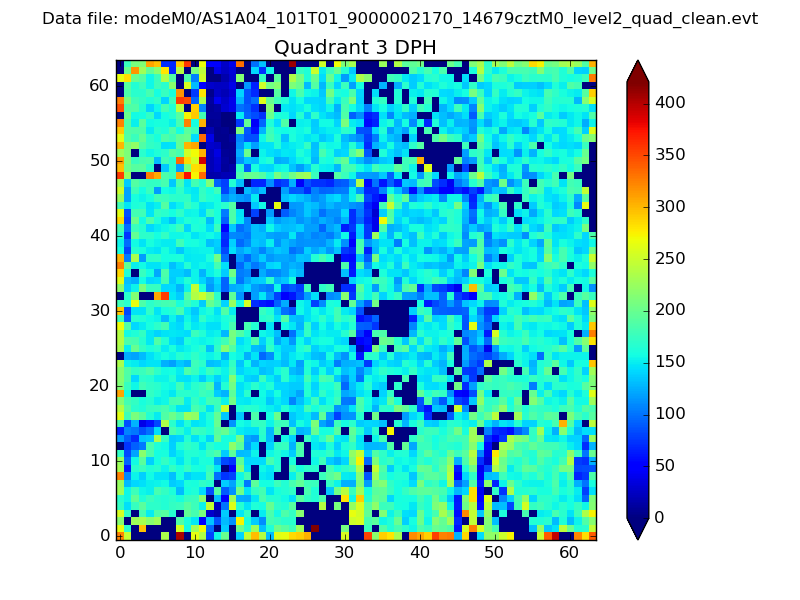 |
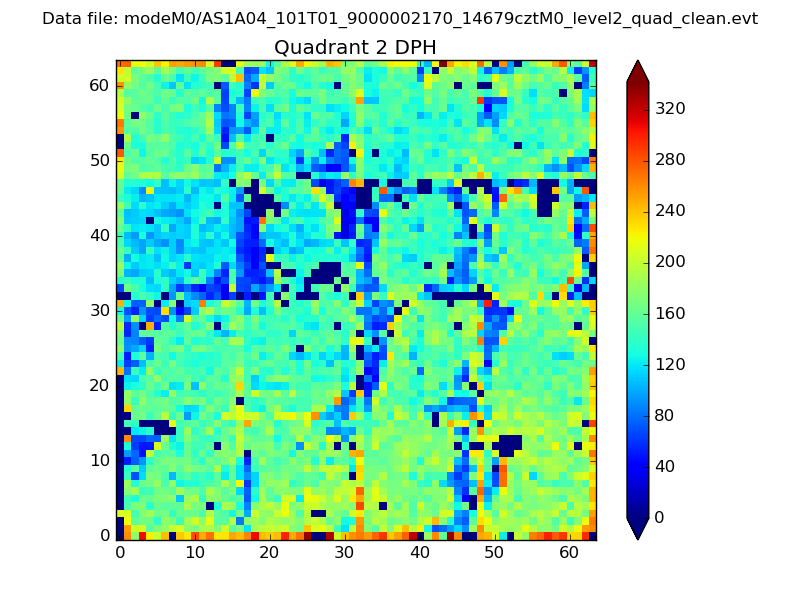 |
Quadrant C |
| Plot type | Count rate plots | Images |
|---|---|---|
| Comparison with Poisson distribution Blue bars denote a histogram of data divided into 1 sec bins. Red curve is a Poisson curve with rate = median count rate of data. |
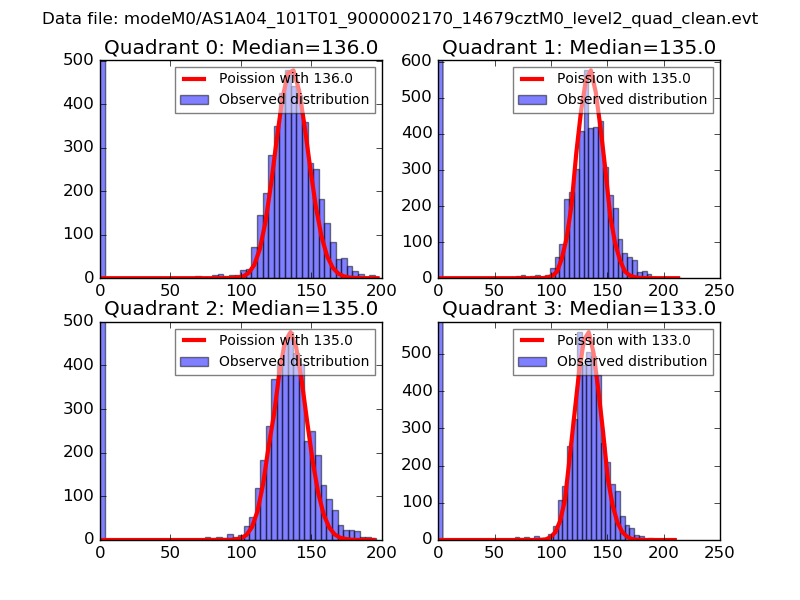 |
 |
| Quadrant-wise count rates Data is divided into 100 sec bins |
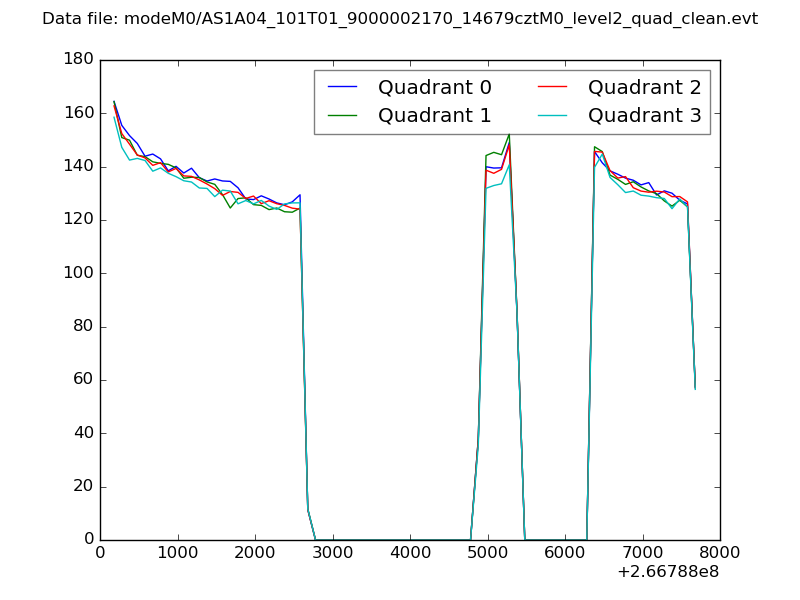 |
|
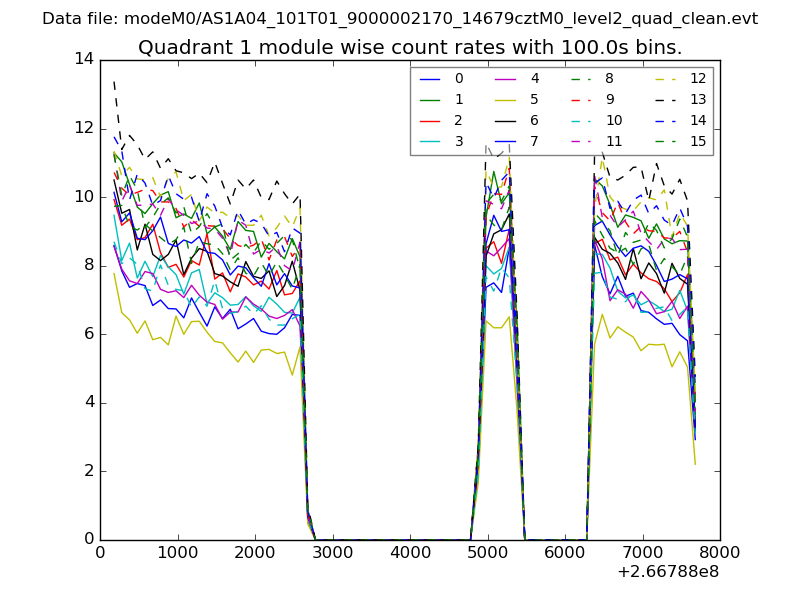
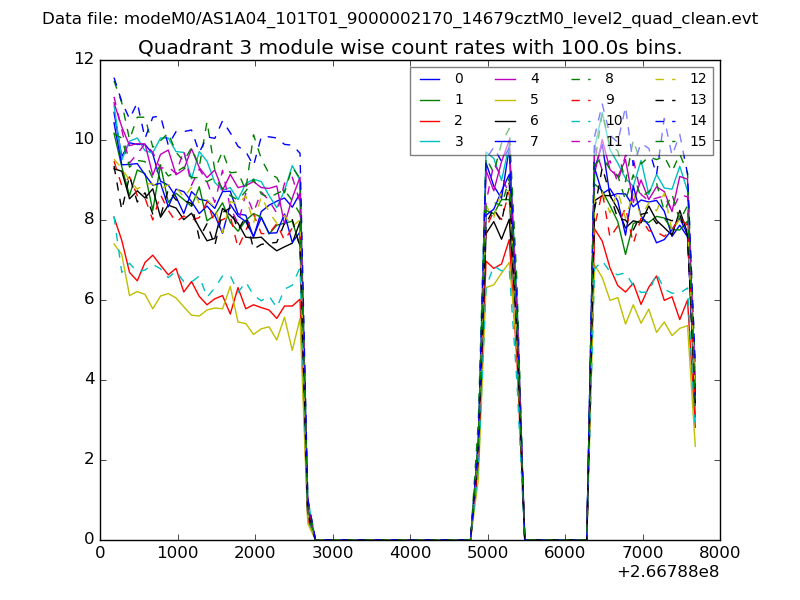
| Module-wise count rates for Quadrant A Data is divided into 100 sec bins |
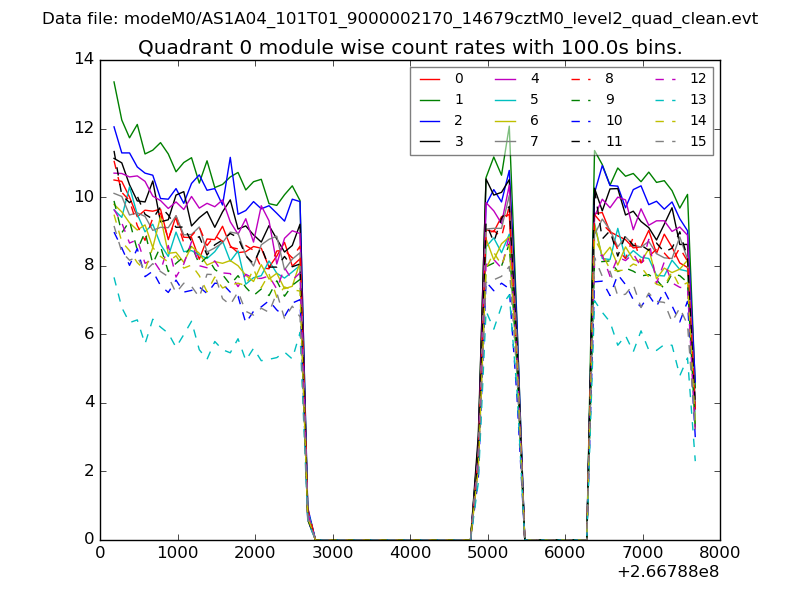 |
 |
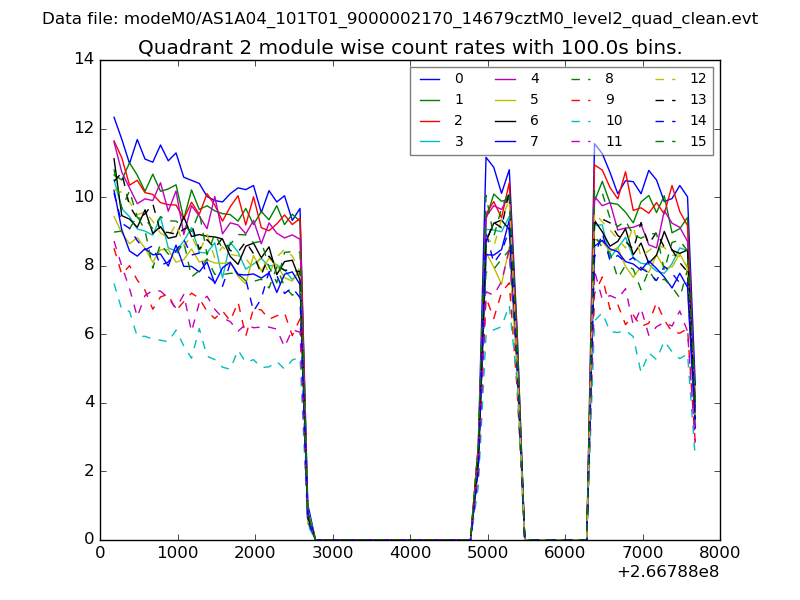
| Module-wise count rates for Quadrant B Data is divided into 100 sec bins |
 |
 |
| Module-wise count rates for Quadrant C Data is divided into 100 sec bins |
 |
 |
| Module-wise count rates for Quadrant D Data is divided into 100 sec bins |
 |
 |
| Parameter | Plot |
|---|---|
| CZT HV Monitor | 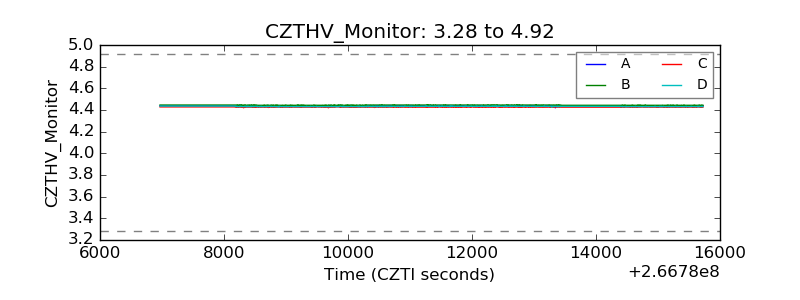 |
| D_VDD | 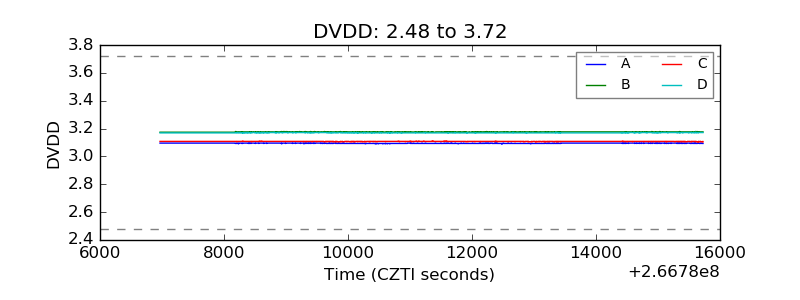 |
| Temperature 1 | 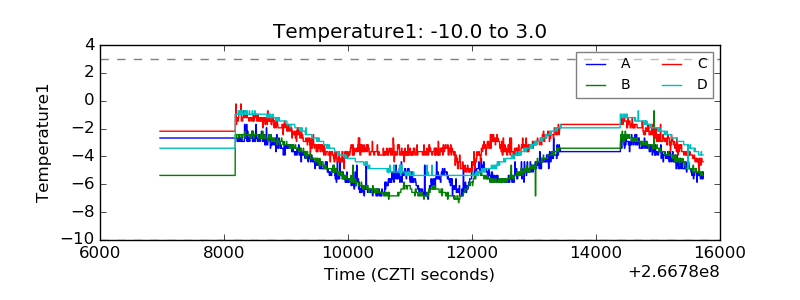 |
| Veto HV Monitor | 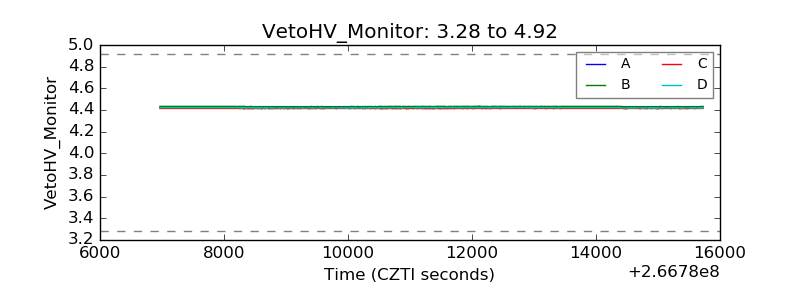 |
| Veto LLD | 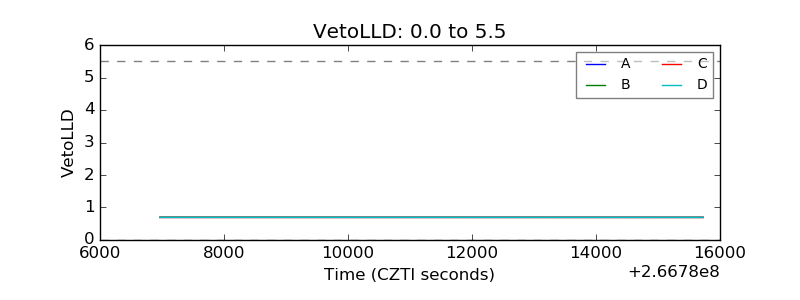 |
| Alpha Counter | 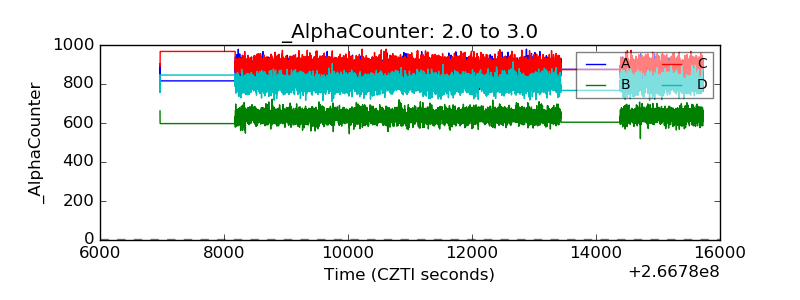 |
| _CPM_Rate |  |
| CZT Counter | 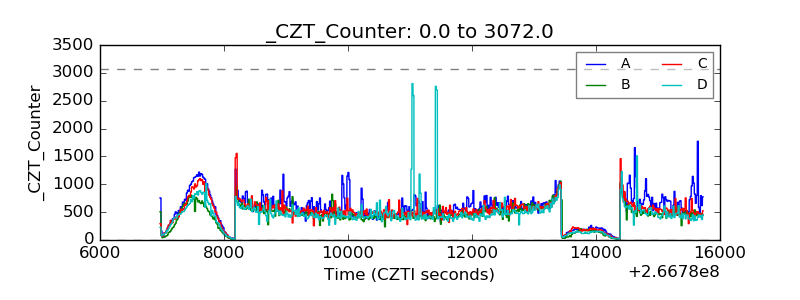 |
| +2.5 Volts monitor |  |
| +5 Volts monitor | 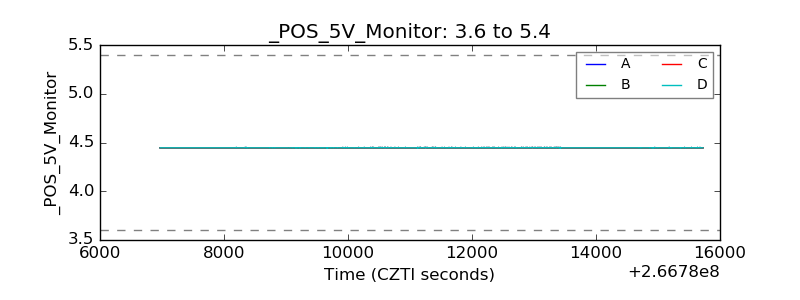 |
| _ROLL_ROT | 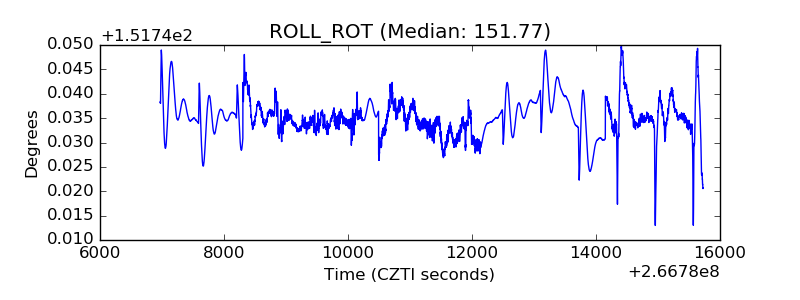 |
| _Roll_DEC | 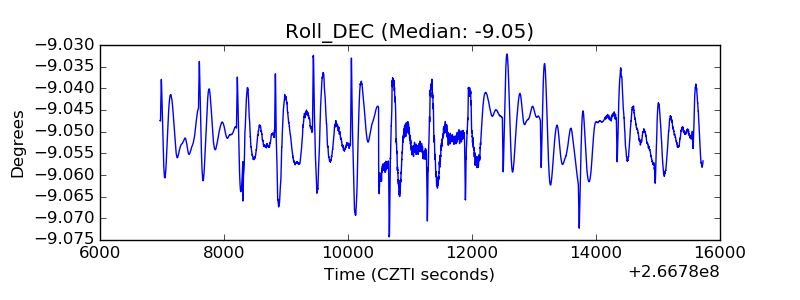 |
| _Roll_RA | 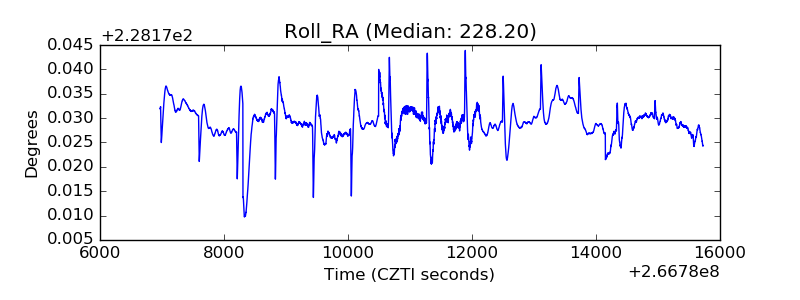 |
| Veto Counter | 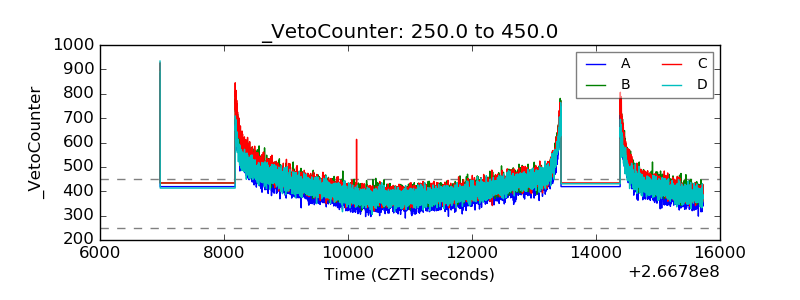 |