| Param | Original file | Final file |
|---|---|---|
| Filename | modeM0/AS1A04_101T01_9000002170_14682cztM0_level2.evt | modeM0/AS1A04_101T01_9000002170_14682cztM0_level2_quad_clean.evt |
| Size (bytes) | 542,733,120 | 94,412,160 |
| Size | 517.6 MB | 90.0 MB |
| Events in quadrant A | 4,175,753 | 589,800 |
| Events in quadrant B | 3,757,059 | 583,467 |
| Events in quadrant C | 4,281,925 | 585,776 |
| Events in quadrant D | 3,713,041 | 577,989 |
| Mode M9 | |||
|---|---|---|---|
| Quadrant | BADHDUFLAG | Total packets | Discarded packets |
| A | 0 | 8 | 0 |
| B | 0 | 8 | 0 |
| C | 0 | 8 | 0 |
| D | 0 | 8 | 0 |
| Mode SS | |||
|---|---|---|---|
| Quadrant | BADHDUFLAG | Total packets | Discarded packets |
| A | 0 | 152 | 0 |
| B | 0 | 152 | 0 |
| C | 0 | 152 | 0 |
| D | 0 | 152 | 0 |
| Mode M0 | |||
|---|---|---|---|
| Quadrant | BADHDUFLAG | Total packets | Discarded packets |
| A | 0 | 16997 | 3 |
| B | 0 | 16114 | 2 |
| C | 0 | 17456 | 2 |
| D | 0 | 16411 | 2 |
| Quadrant | Total seconds | Saturated seconds | Saturation percentage |
|---|---|---|---|
| A | 7510 | 73 | 0.972037% |
| B | 7510 | 109 | 1.451398% |
| C | 7510 | 42 | 0.559254% |
| D | 7510 | 53 | 0.705726% |
Noise dominated data is calculated using 1-second bins in cleaned event files. If a bin has >2000 counts, and if more than 50% of those come from <1% of pixels, then it is considered to be noise-dominated and hence unusable.
| Quadrant | # 1 sec bins | Bins with >0 counts | Bins with >2000 counts | High rate bins dominated by noise | Noise dominated (total time) | Noise dominated (detector-on time) | Marked lightcurve |
|---|---|---|---|---|---|---|---|
| A | 8236 | 7512 | 6 | 6 | 0.07% | 0.08% | 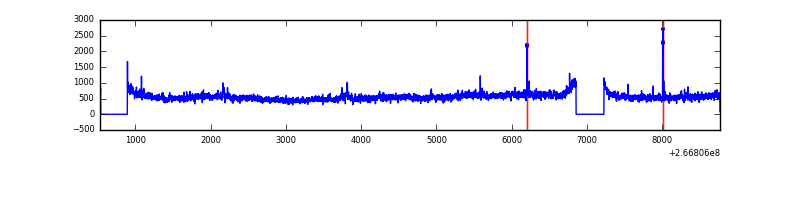 |
| B | 8236 | 7512 | 16 | 16 | 0.19% | 0.21% | 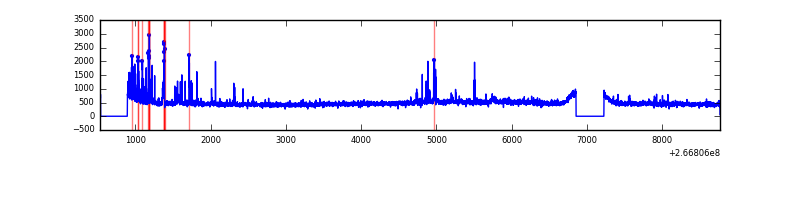 |
| C | 8236 | 7512 | 0 | 0 | 0.00% | 0.00% | 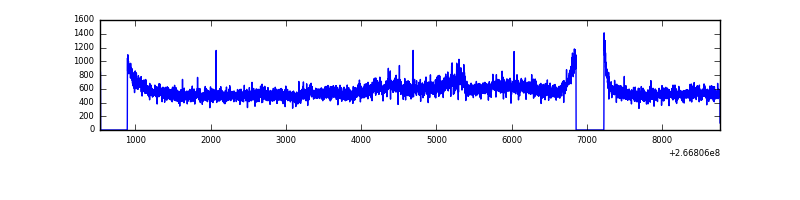 |
| D | 8236 | 7513 | 33 | 33 | 0.40% | 0.44% | 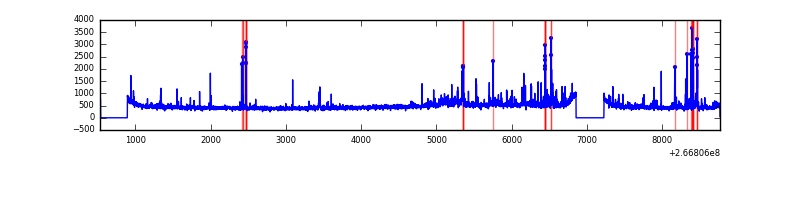 |
Top three noisy pixels from each quadrant. If the there are fewer than three noisy pixels in the level2.evt file, extra rows are filled as -1
| Pixel properties | Quadrant properties | ||||||
|---|---|---|---|---|---|---|---|
| Quadrant | DetID | PixID | Counts | Sigma | Mean | Median | Sigma |
| A | 8 | 15 | 669088 | 3646.06 | 899 | 881 | 183.3 |
| A | 12 | 189 | 26629 | 140.49 | 899 | 881 | 183.3 |
| A | 9 | 143 | 14171 | 72.52 | 899 | 881 | 183.3 |
| B | 10 | 16 | 151392 | 867.01 | 892 | 867 | 173.6 |
| B | 15 | 201 | 39219 | 220.9 | 892 | 867 | 173.6 |
| B | 0 | 214 | 33334 | 187.01 | 892 | 867 | 173.6 |
| C | 3 | 233 | 884802 | 4376.52 | 869 | 874 | 202.0 |
| C | 13 | 61 | 6278 | 26.76 | 869 | 874 | 202.0 |
| C | 3 | 234 | 4039 | 15.67 | 869 | 874 | 202.0 |
| D | 5 | 222 | 216079 | 953.64 | 867 | 844 | 225.7 |
| D | 10 | 199 | 89210 | 391.52 | 867 | 844 | 225.7 |
| D | 2 | 234 | 35592 | 153.96 | 867 | 844 | 225.7 |
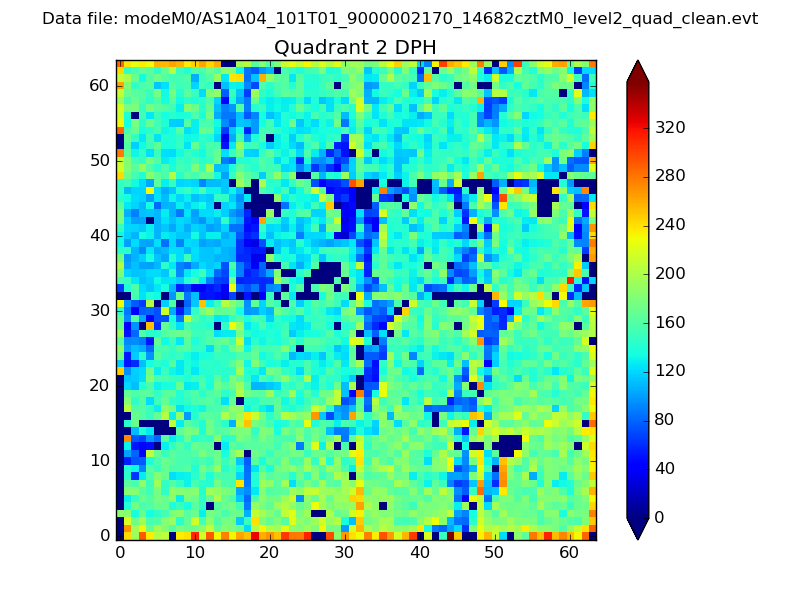
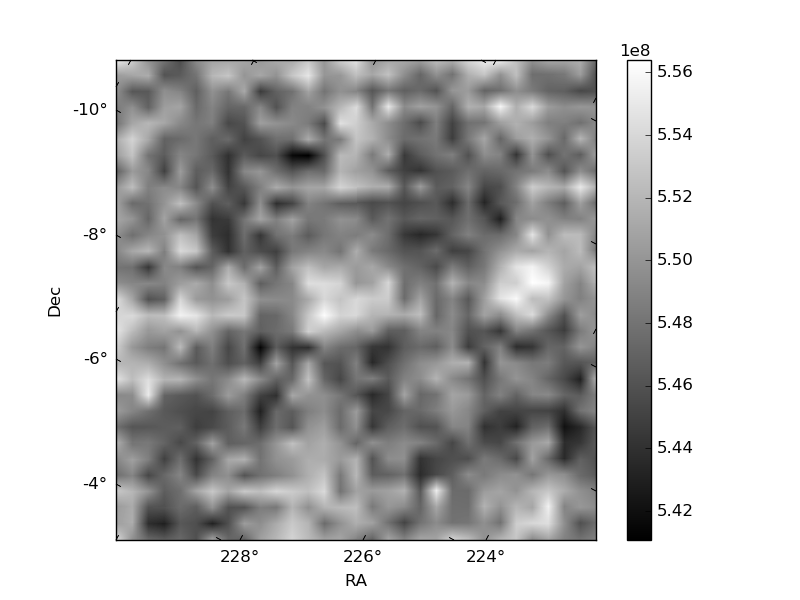
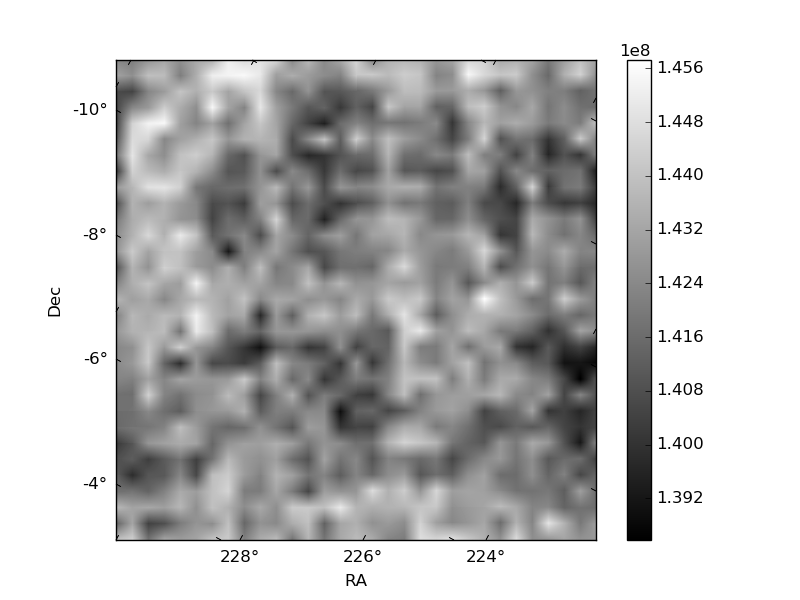
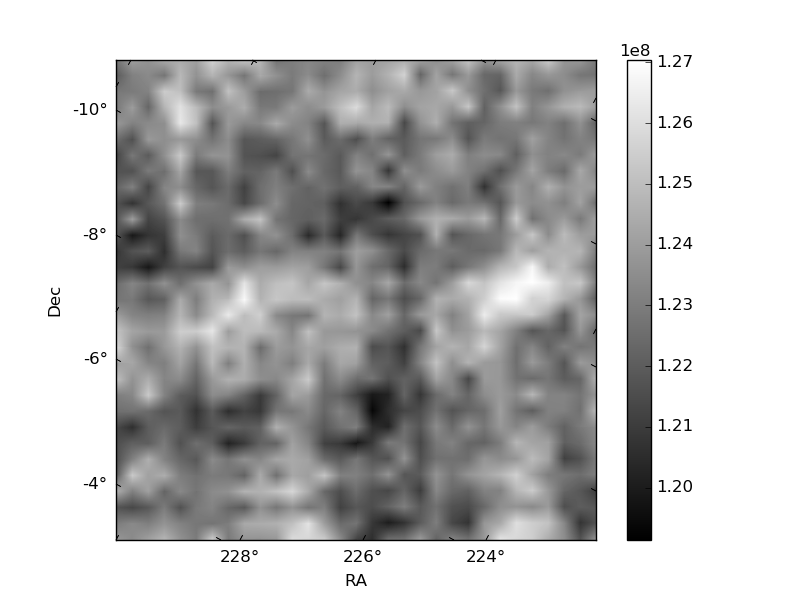
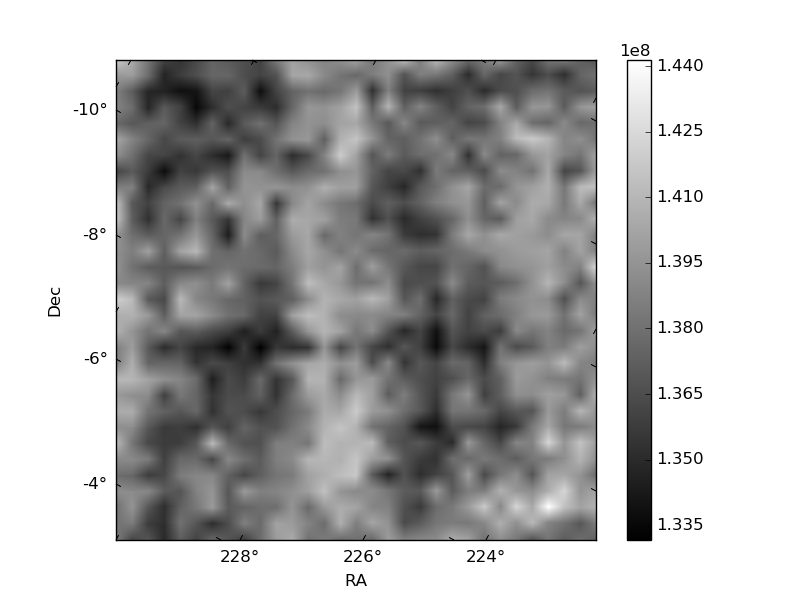
Histogram calculated using DETX and DETY for each event in the final _common_clean file
| Quadrant A | 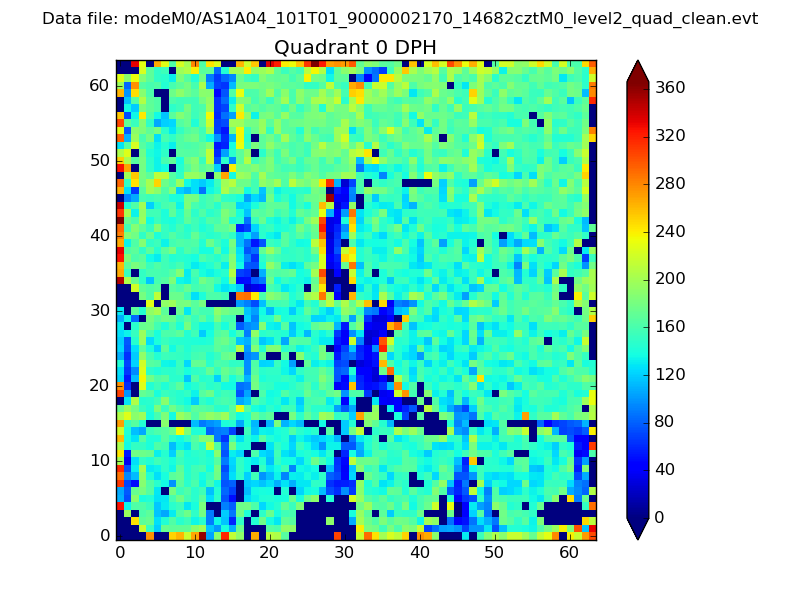 |
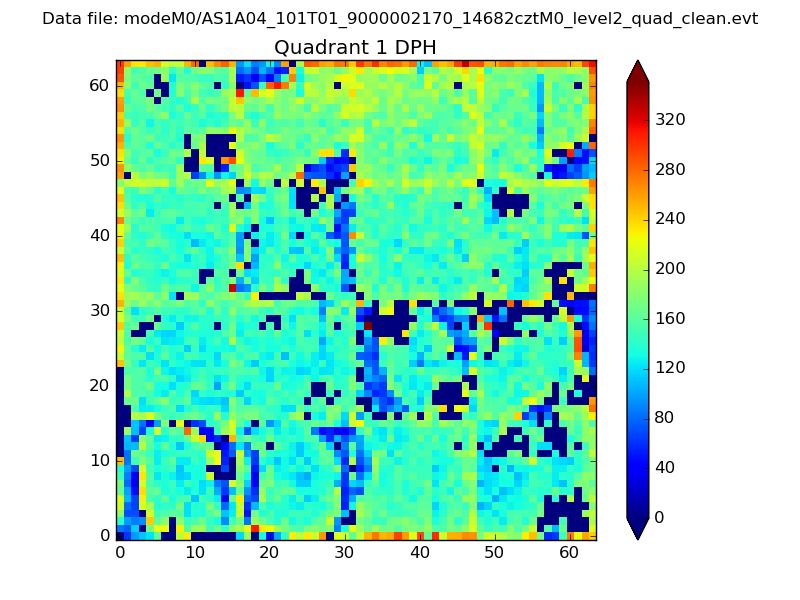 |
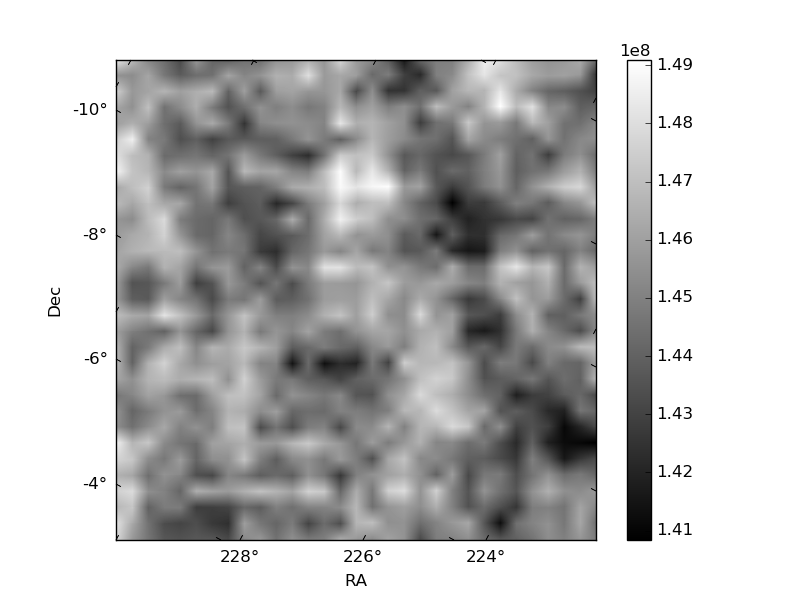
Quadrant B |
|---|---|---|---|
| Quadrant D | 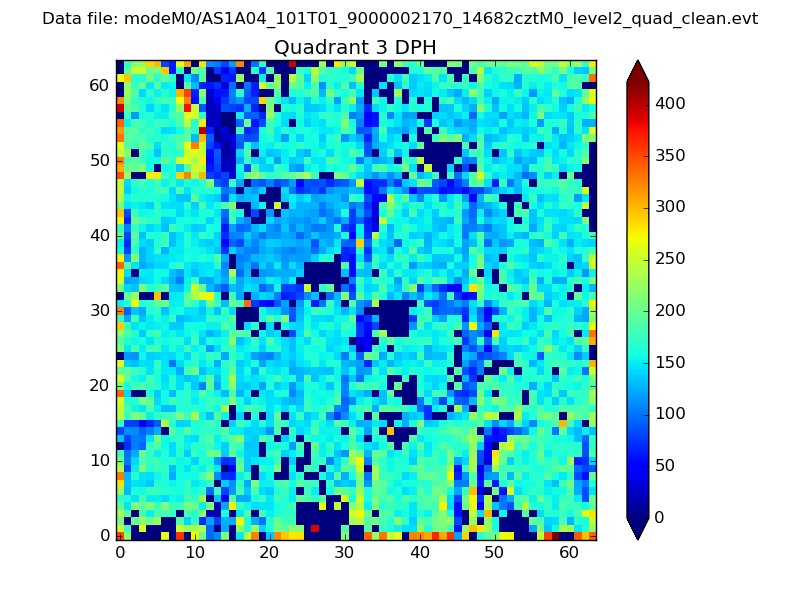 |
 |
Quadrant C |
| Plot type | Count rate plots | Images |
|---|---|---|
| Comparison with Poisson distribution Blue bars denote a histogram of data divided into 1 sec bins. Red curve is a Poisson curve with rate = median count rate of data. |
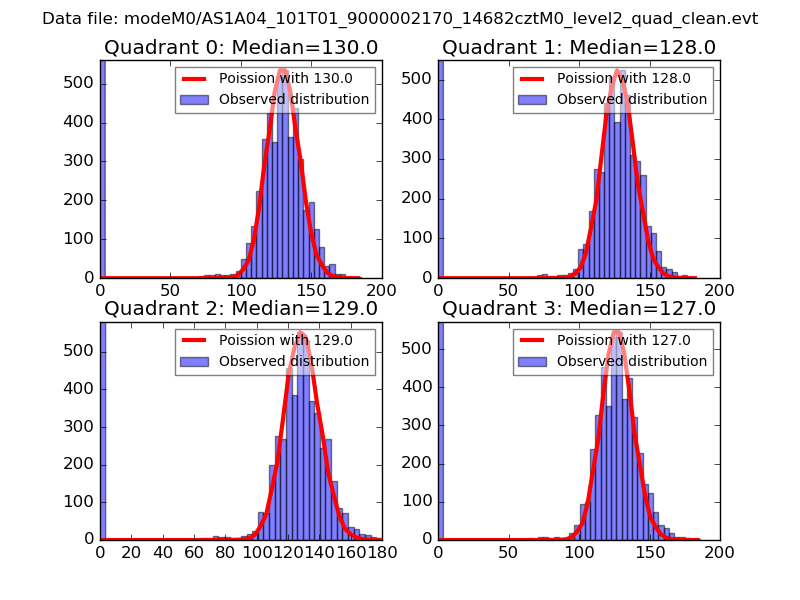 |
 |
| Quadrant-wise count rates Data is divided into 100 sec bins |
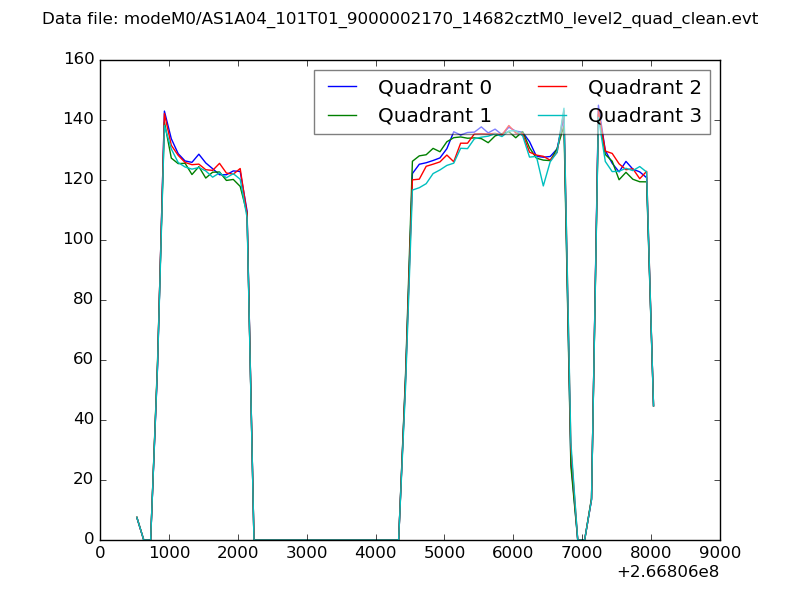 |
|
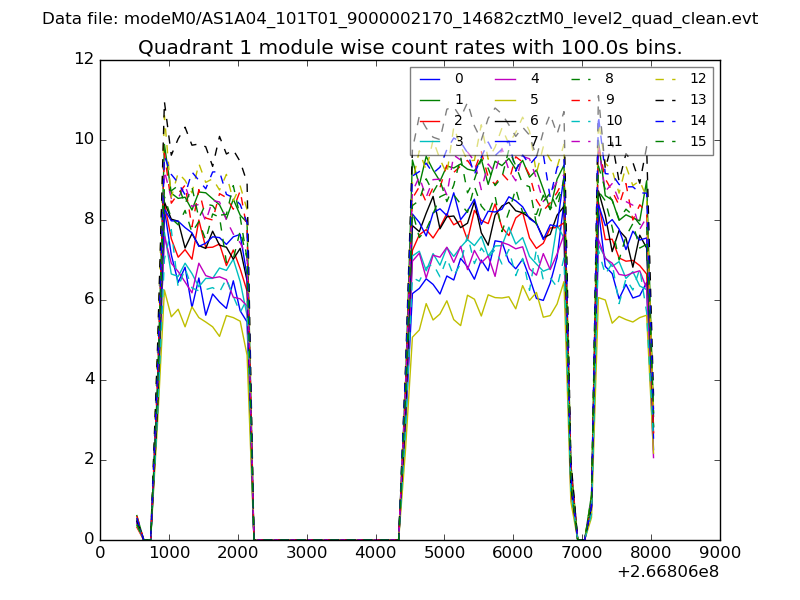
| Module-wise count rates for Quadrant A Data is divided into 100 sec bins |
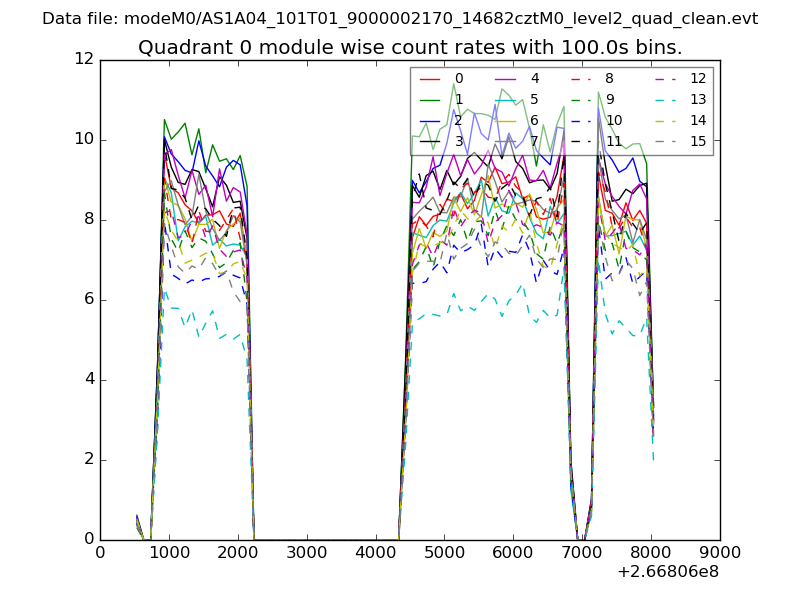 |
 |
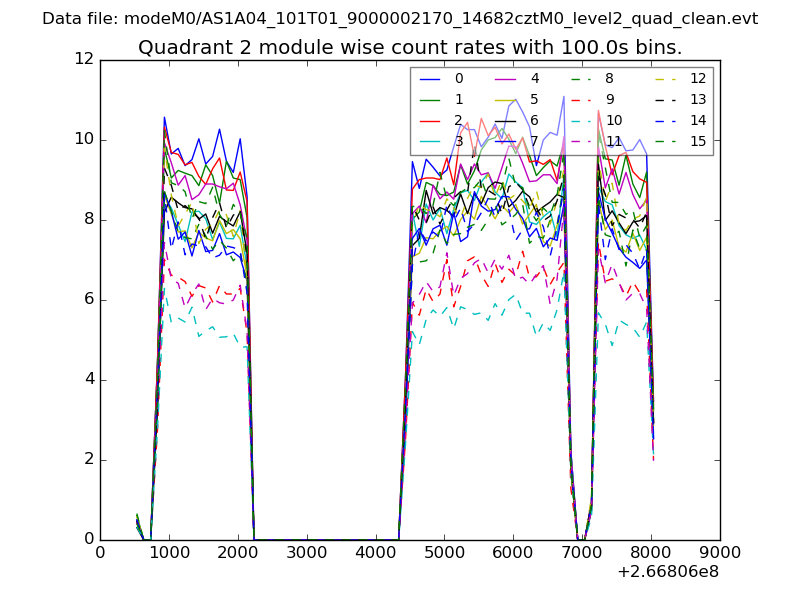
| Module-wise count rates for Quadrant B Data is divided into 100 sec bins |
 |
 |
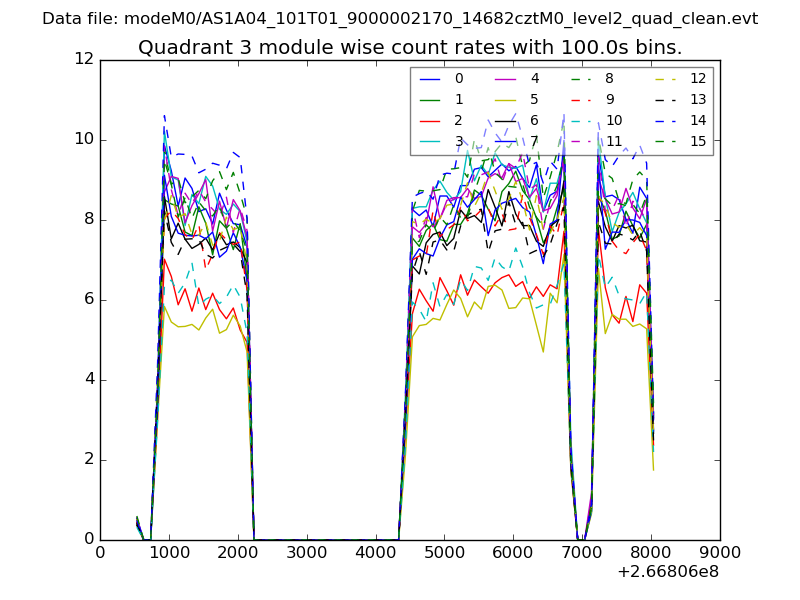
| Module-wise count rates for Quadrant C Data is divided into 100 sec bins |
 |
 |
| Module-wise count rates for Quadrant D Data is divided into 100 sec bins |
 |
 |
| Parameter | Plot |
|---|---|
| CZT HV Monitor | 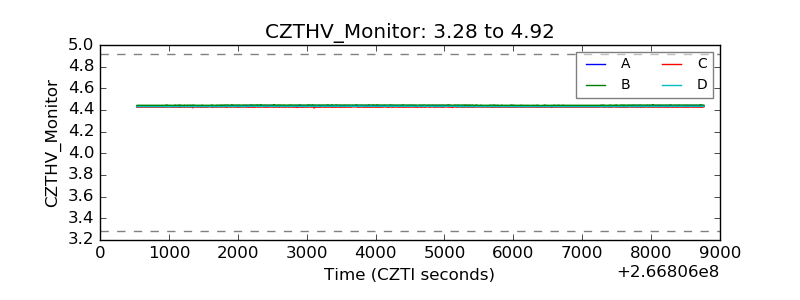 |
| D_VDD | 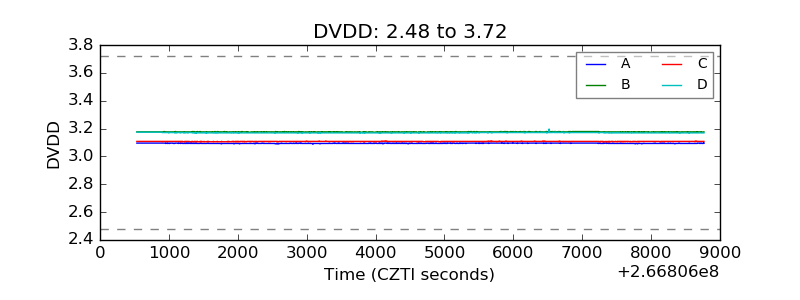 |
| Temperature 1 | 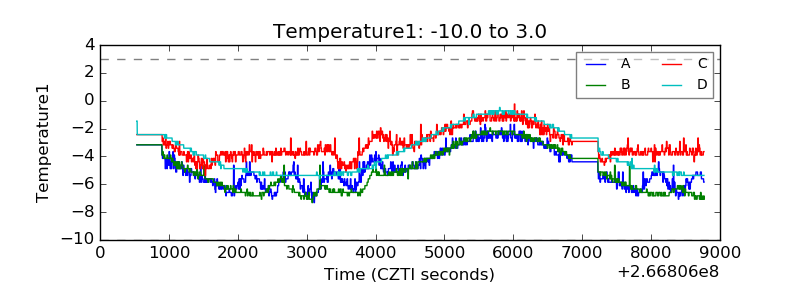 |
| Veto HV Monitor | 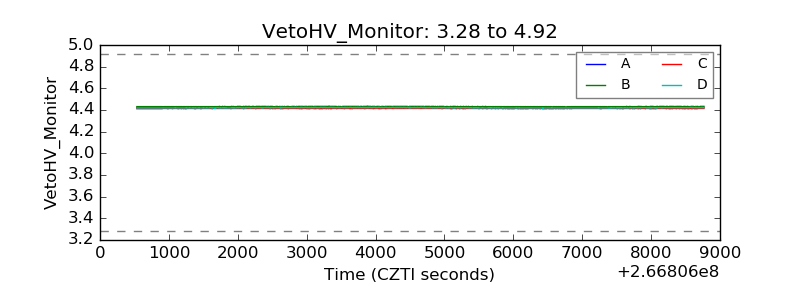 |
| Veto LLD | 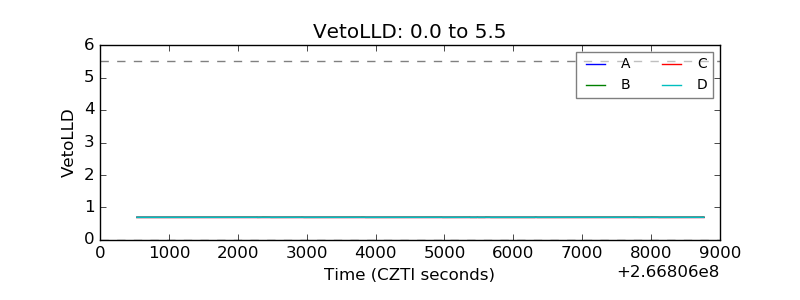 |
| Alpha Counter | 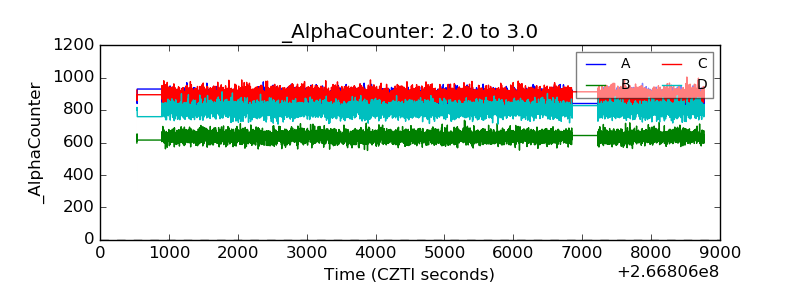 |
| _CPM_Rate | 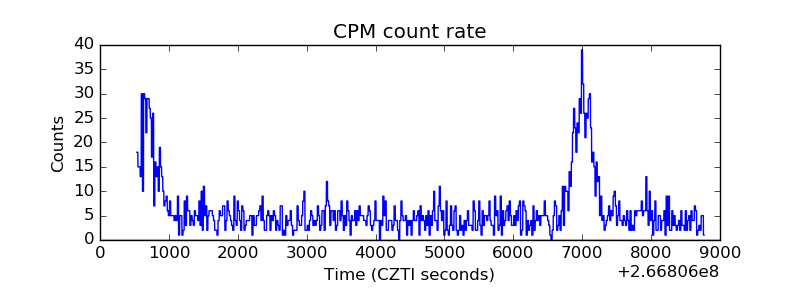 |
| CZT Counter | 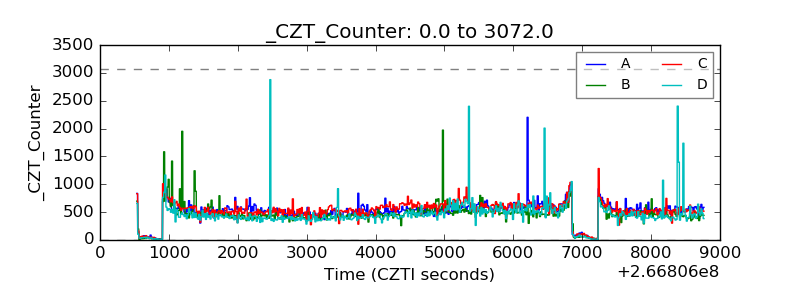 |
| +2.5 Volts monitor | 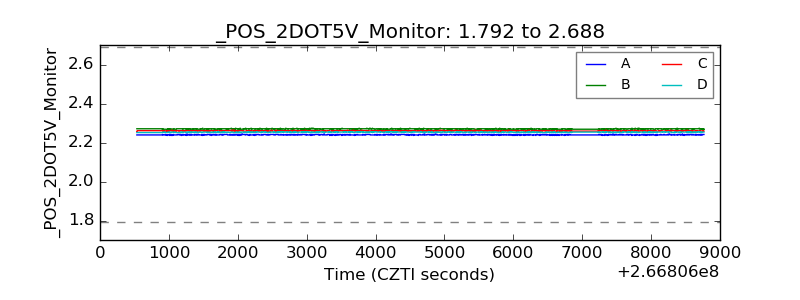 |
| +5 Volts monitor | 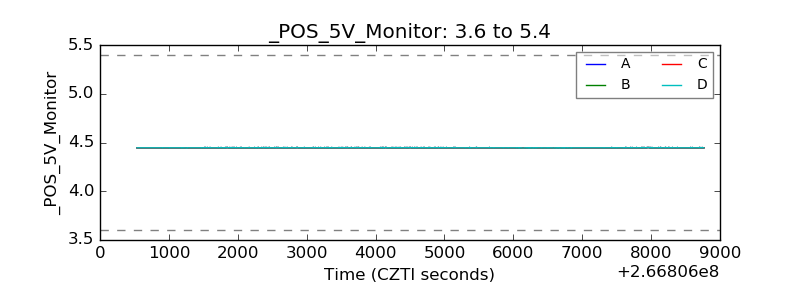 |
| _ROLL_ROT |  |
| _Roll_DEC | 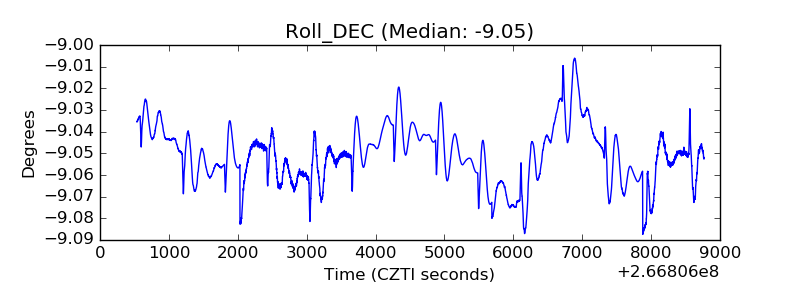 |
| _Roll_RA | 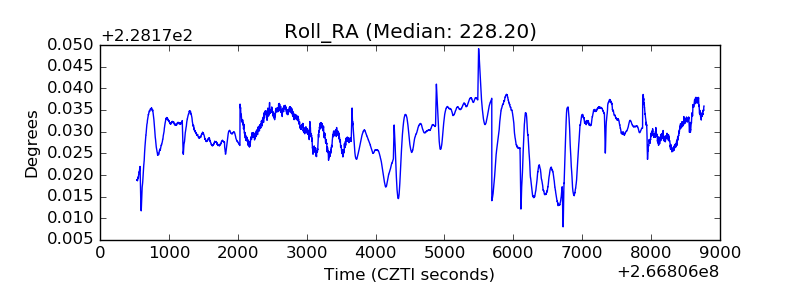 |
| Veto Counter | 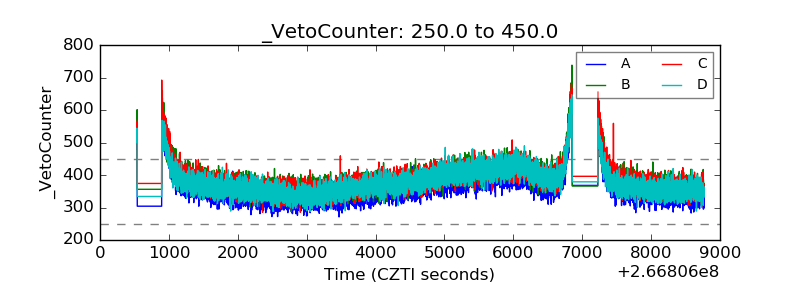 |