| Param | Original file | Final file |
|---|---|---|
| Filename | modeM0/AS1A04_101T01_9000002170_14685cztM0_level2.evt | modeM0/AS1A04_101T01_9000002170_14685cztM0_level2_quad_clean.evt |
| Size (bytes) | 1,426,354,560 | 226,676,160 |
| Size | 1.3 GB | 216.2 MB |
| Events in quadrant A | 10,215,075 | 1,408,719 |
| Events in quadrant B | 10,293,141 | 1,381,460 |
| Events in quadrant C | 11,064,575 | 1,391,896 |
| Events in quadrant D | 10,336,460 | 1,368,667 |
| Mode M9 | |||
|---|---|---|---|
| Quadrant | BADHDUFLAG | Total packets | Discarded packets |
| A | 0 | 24 | 0 |
| B | 0 | 24 | 0 |
| C | 0 | 24 | 0 |
| D | 0 | 24 | 0 |
| Mode SS | |||
|---|---|---|---|
| Quadrant | BADHDUFLAG | Total packets | Discarded packets |
| A | 0 | 390 | 0 |
| B | 0 | 390 | 0 |
| C | 0 | 390 | 0 |
| D | 0 | 390 | 0 |
| Mode M0 | |||
|---|---|---|---|
| Quadrant | BADHDUFLAG | Total packets | Discarded packets |
| A | 0 | 41883 | 5 |
| B | 0 | 42709 | 4 |
| C | 0 | 44790 | 4 |
| D | 0 | 44099 | 4 |
| Quadrant | Total seconds | Saturated seconds | Saturation percentage |
|---|---|---|---|
| A | 19077 | 182 | 0.954028% |
| B | 19077 | 588 | 3.082246% |
| C | 19077 | 143 | 0.749594% |
| D | 19077 | 275 | 1.441526% |
Noise dominated data is calculated using 1-second bins in cleaned event files. If a bin has >2000 counts, and if more than 50% of those come from <1% of pixels, then it is considered to be noise-dominated and hence unusable.
| Quadrant | # 1 sec bins | Bins with >0 counts | Bins with >2000 counts | High rate bins dominated by noise | Noise dominated (total time) | Noise dominated (detector-on time) | Marked lightcurve |
|---|---|---|---|---|---|---|---|
| A | 21438 | 19079 | 6 | 6 | 0.03% | 0.03% | 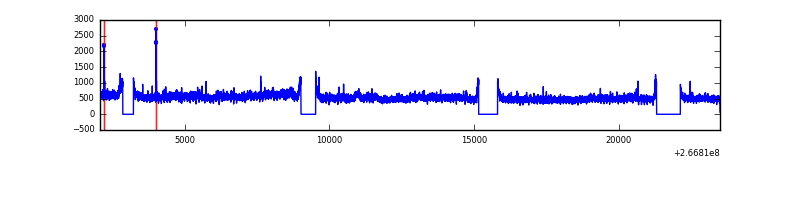 |
| B | 21438 | 19078 | 318 | 318 | 1.48% | 1.67% | 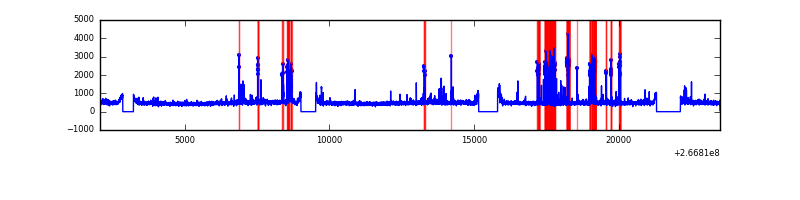 |
| C | 21438 | 19078 | 0 | 0 | 0.00% | 0.00% | 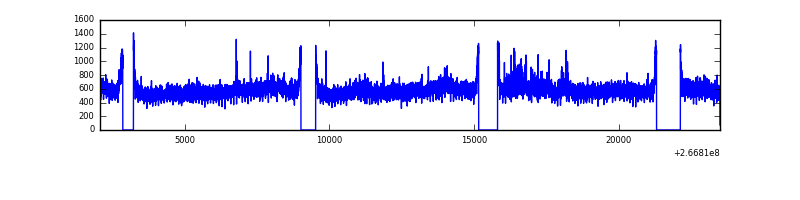 |
| D | 21438 | 19080 | 186 | 186 | 0.87% | 0.97% | 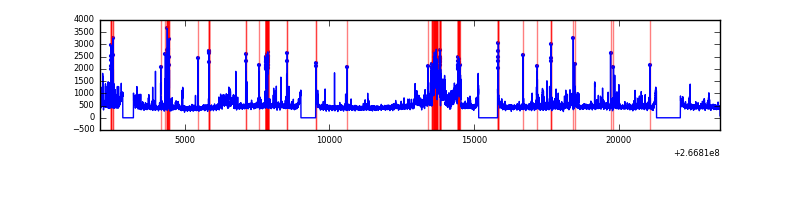 |
Top three noisy pixels from each quadrant. If the there are fewer than three noisy pixels in the level2.evt file, extra rows are filled as -1
| Pixel properties | Quadrant properties | ||||||
|---|---|---|---|---|---|---|---|
| Quadrant | DetID | PixID | Counts | Sigma | Mean | Median | Sigma |
| A | 8 | 15 | 1200105 | 2554.02 | 2311 | 2260 | 469.0 |
| A | 12 | 189 | 61905 | 127.17 | 2311 | 2260 | 469.0 |
| A | 9 | 143 | 24397 | 47.2 | 2311 | 2260 | 469.0 |
| B | 10 | 16 | 1219634 | 2791.96 | 2273 | 2213 | 436.0 |
| B | 12 | 111 | 52675 | 115.73 | 2273 | 2213 | 436.0 |
| B | 11 | 111 | 44864 | 97.81 | 2273 | 2213 | 436.0 |
| C | 3 | 233 | 2349018 | 4548.63 | 2229 | 2240 | 515.9 |
| C | 13 | 61 | 16376 | 27.4 | 2229 | 2240 | 515.9 |
| C | 3 | 234 | 13083 | 21.02 | 2229 | 2240 | 515.9 |
| D | 12 | 110 | 1302141 | 2249.05 | 2222 | 2169 | 578.0 |
| D | 5 | 222 | 318250 | 546.84 | 2222 | 2169 | 578.0 |
| D | 10 | 199 | 95344 | 161.2 | 2222 | 2169 | 578.0 |
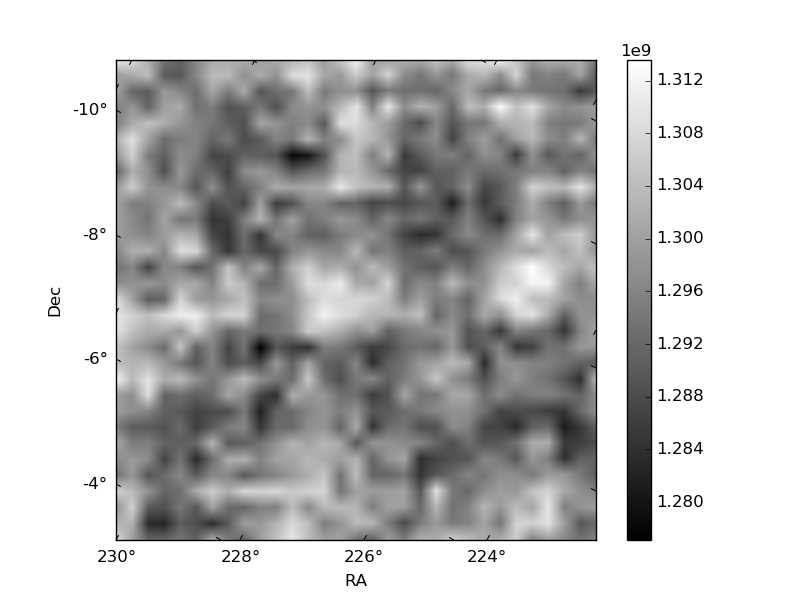
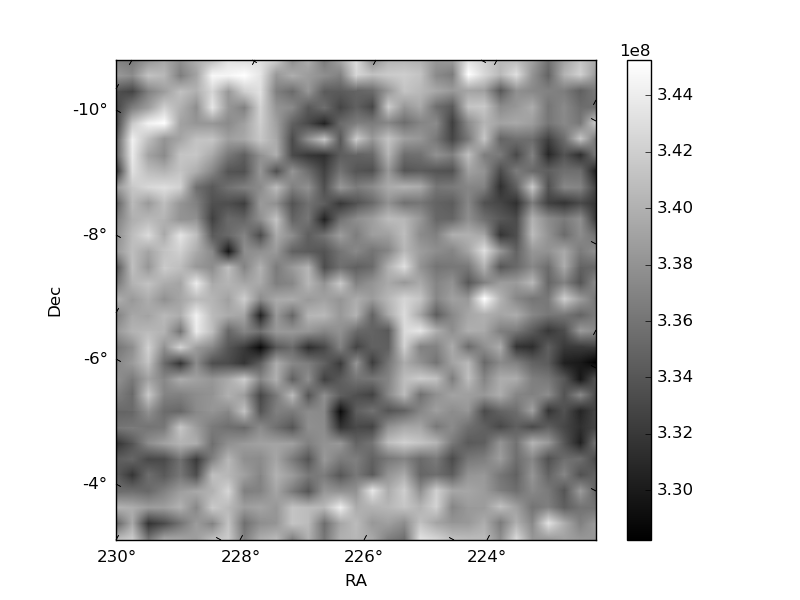
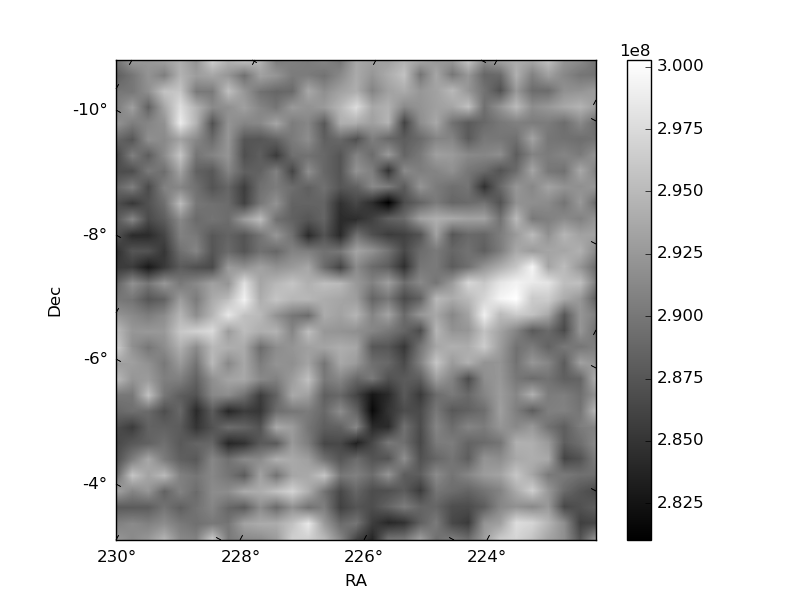
Histogram calculated using DETX and DETY for each event in the final _common_clean file
| Quadrant A | 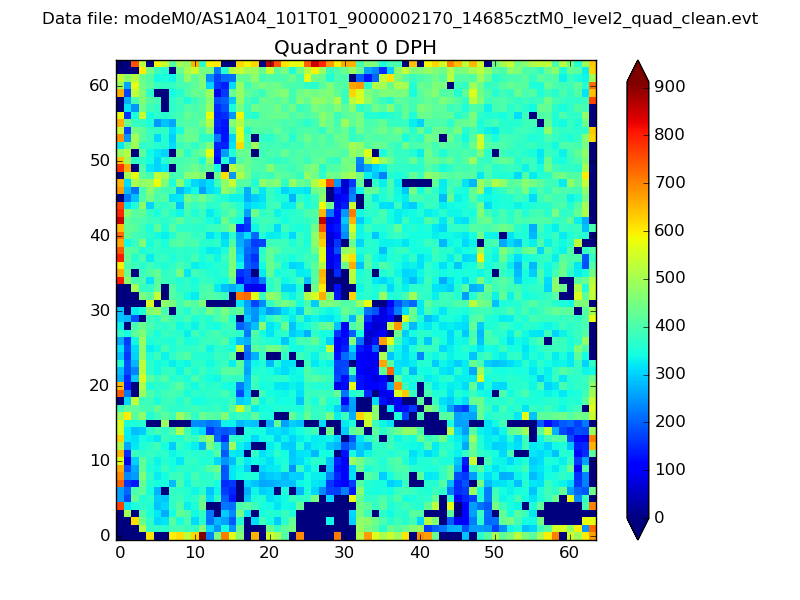 |
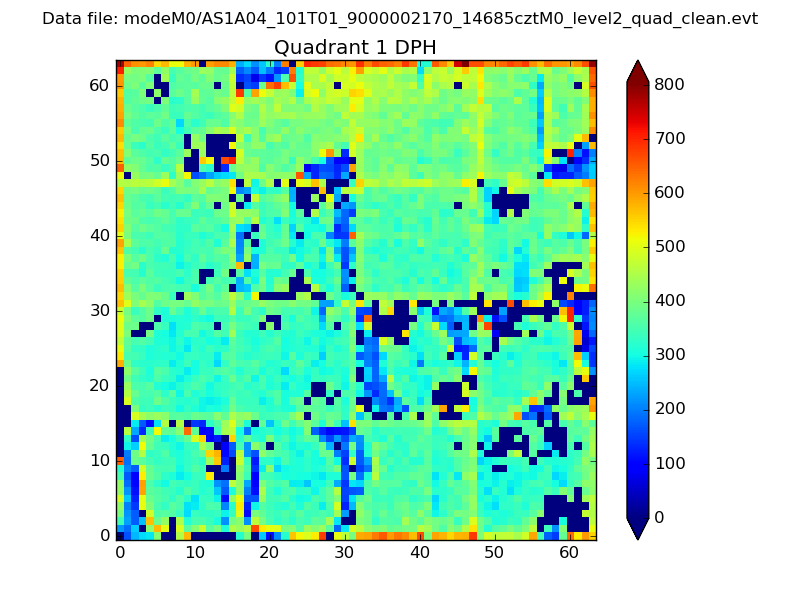 |
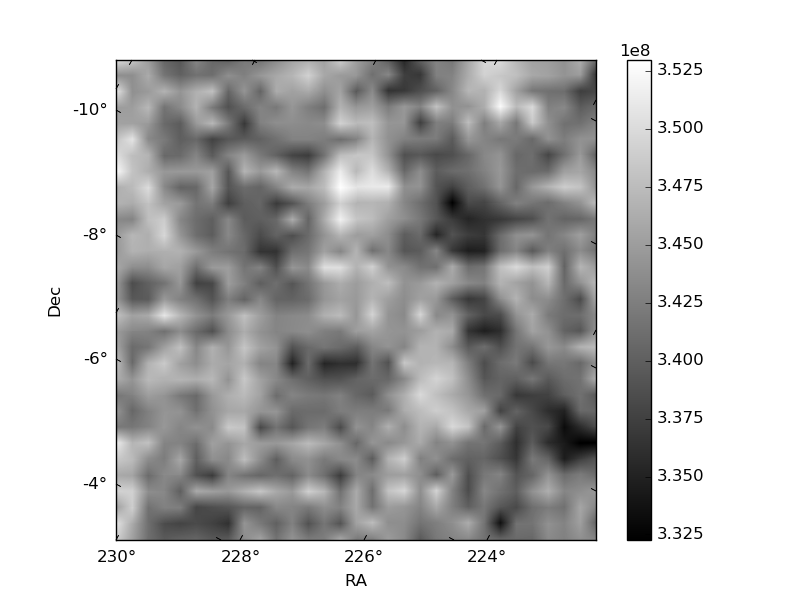
Quadrant B |
|---|---|---|---|
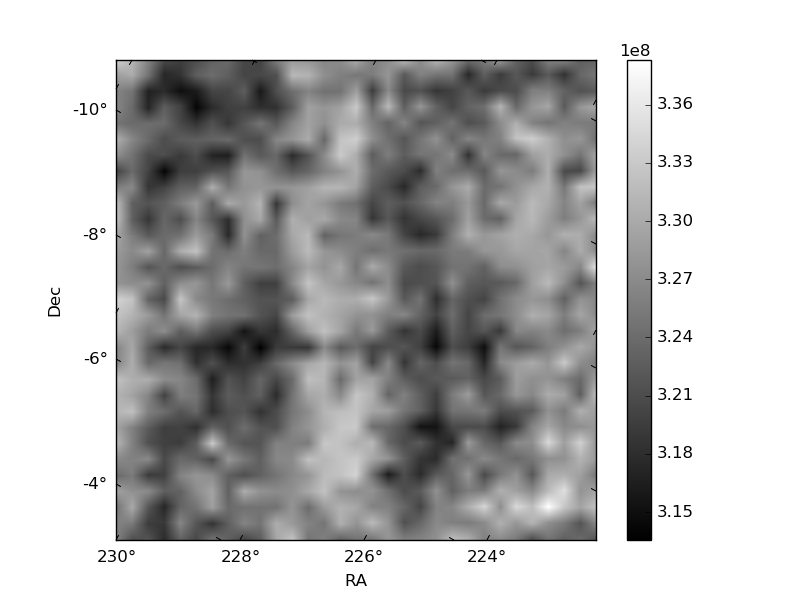
| Quadrant D | 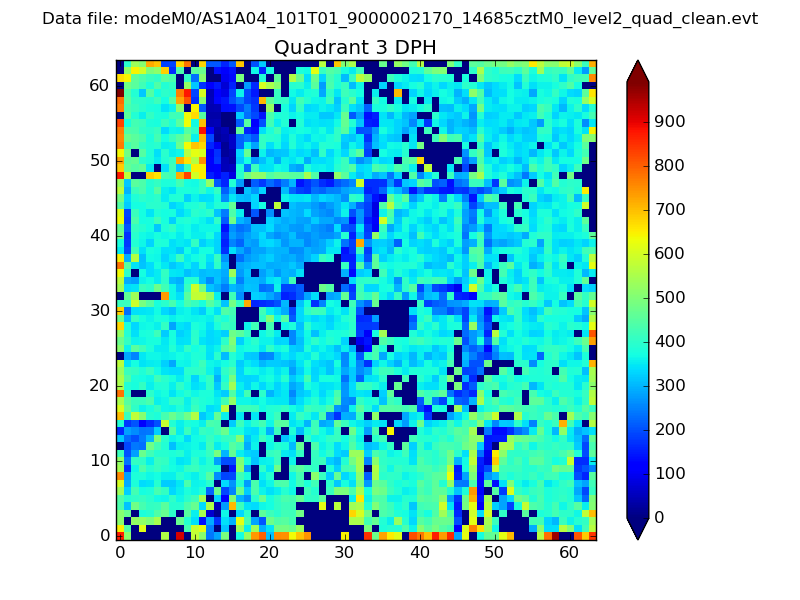 |
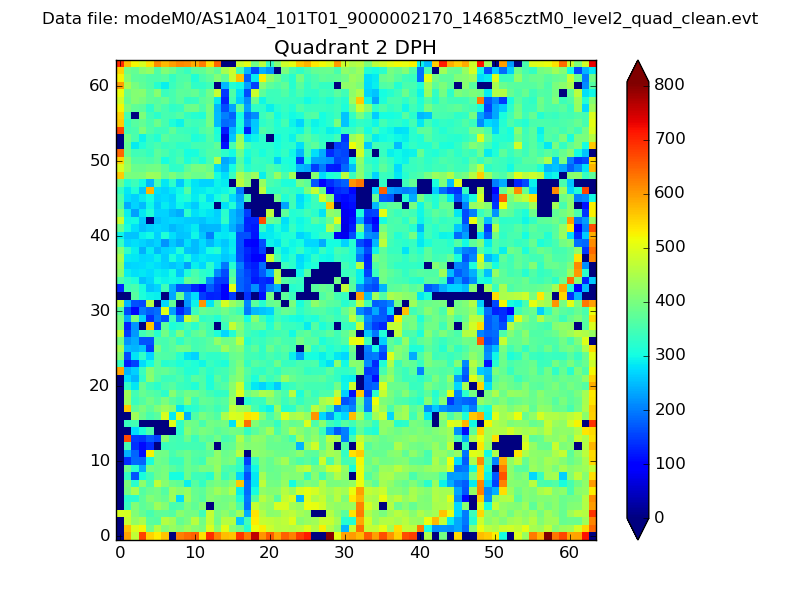 |
Quadrant C |
| Plot type | Count rate plots | Images |
|---|---|---|
| Comparison with Poisson distribution Blue bars denote a histogram of data divided into 1 sec bins. Red curve is a Poisson curve with rate = median count rate of data. |
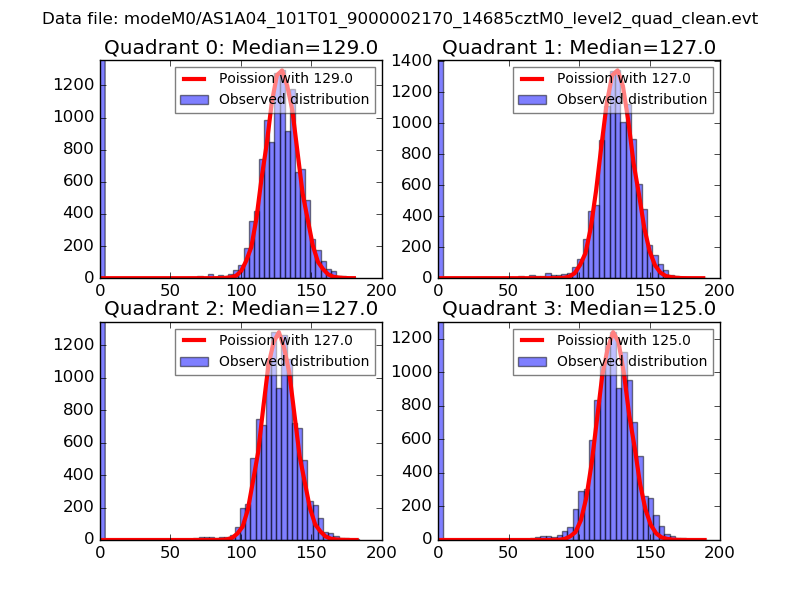 |
 |
| Quadrant-wise count rates Data is divided into 100 sec bins |
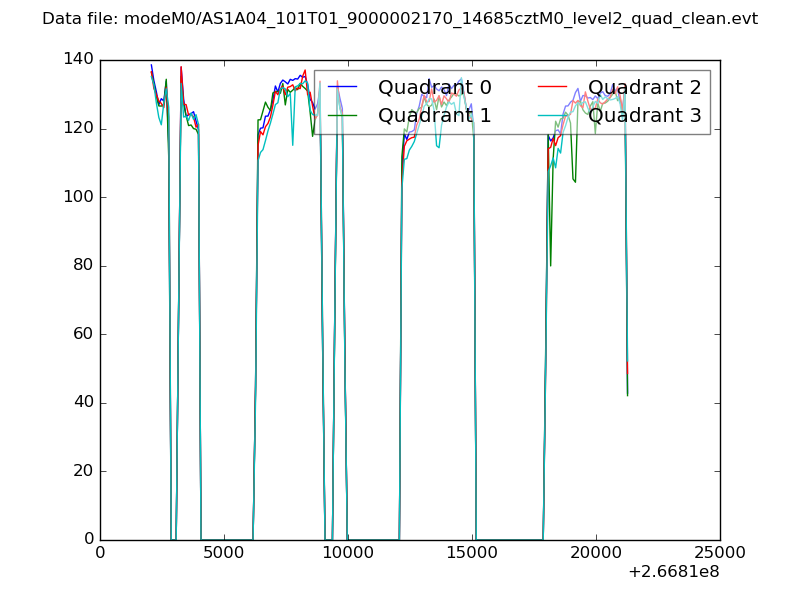 |
|
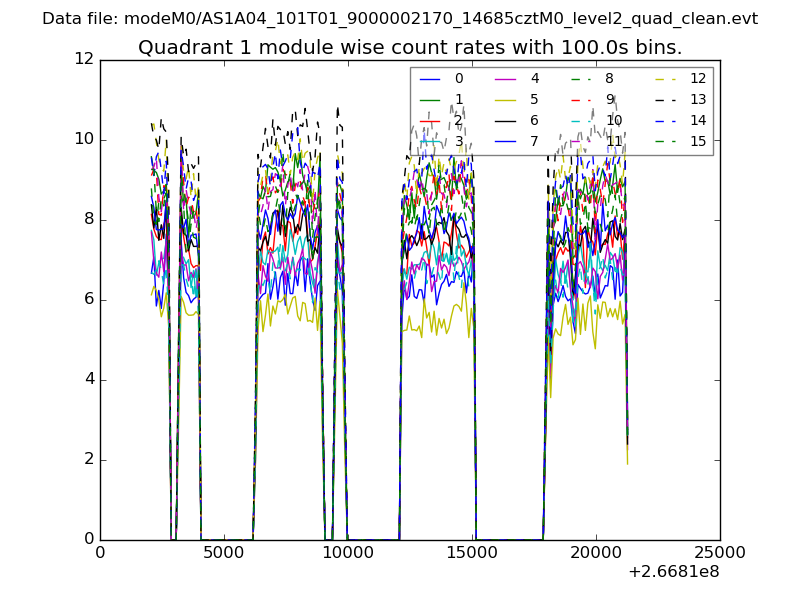
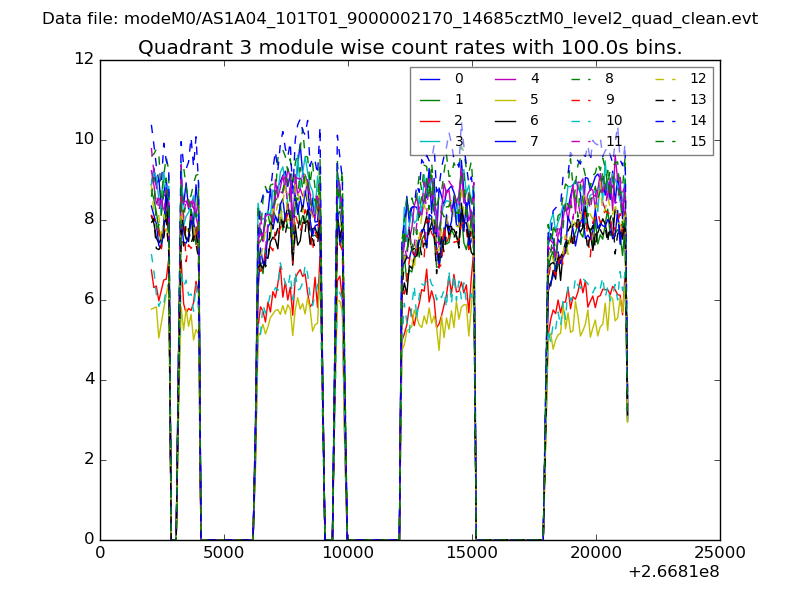
| Module-wise count rates for Quadrant A Data is divided into 100 sec bins |
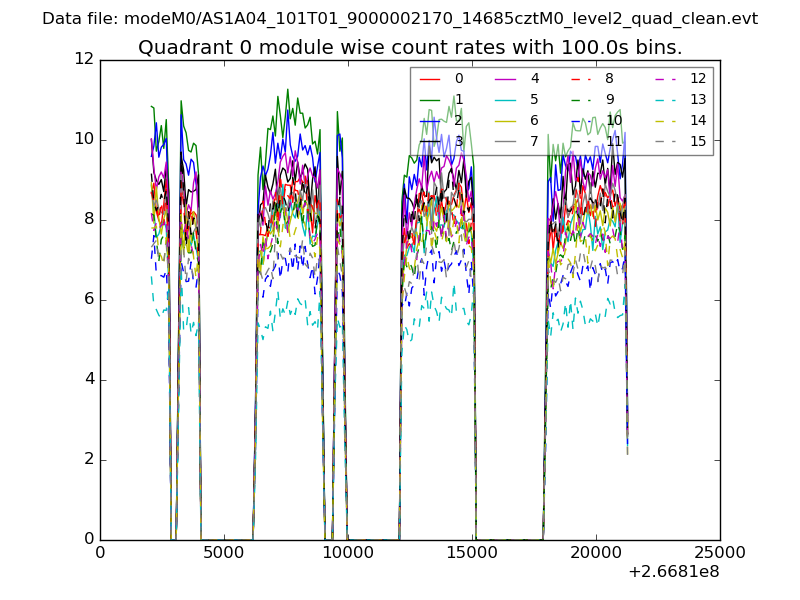 |
 |
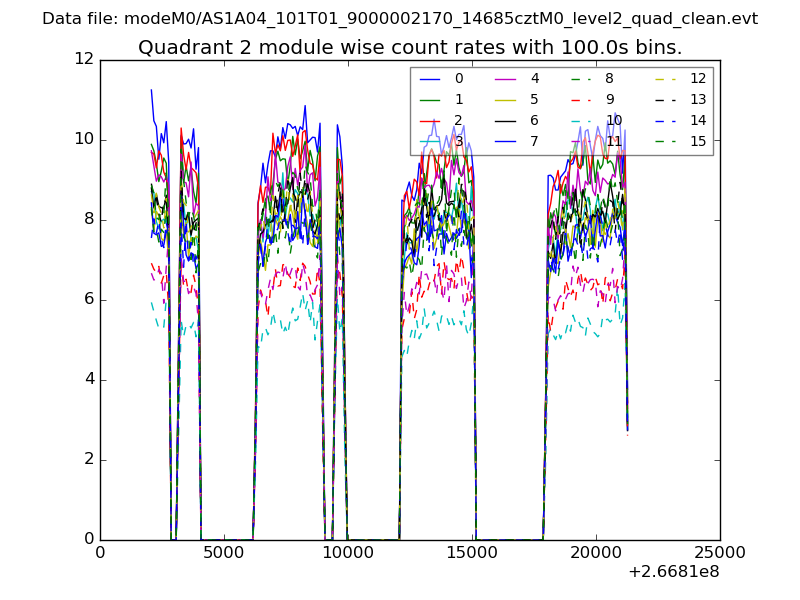
| Module-wise count rates for Quadrant B Data is divided into 100 sec bins |
 |
 |
| Module-wise count rates for Quadrant C Data is divided into 100 sec bins |
 |
 |
| Module-wise count rates for Quadrant D Data is divided into 100 sec bins |
 |
 |
| Parameter | Plot |
|---|---|
| CZT HV Monitor | 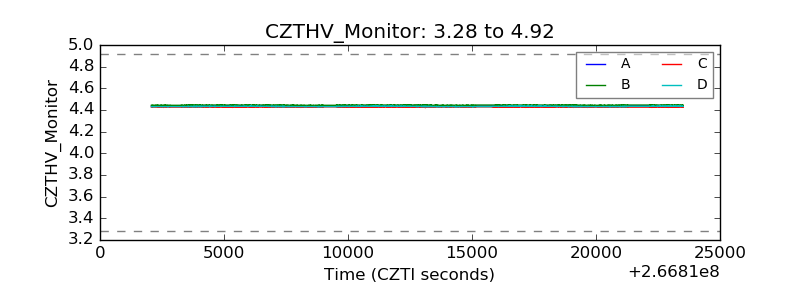 |
| D_VDD | 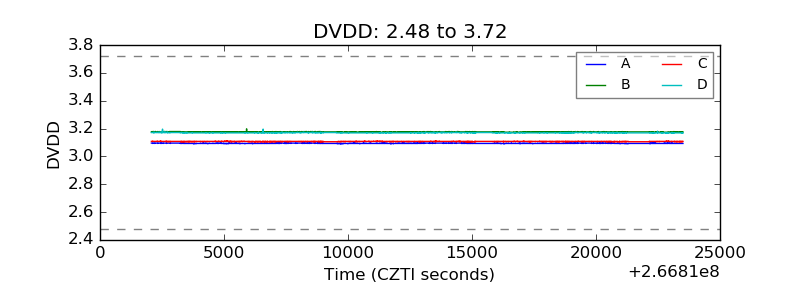 |
| Temperature 1 | 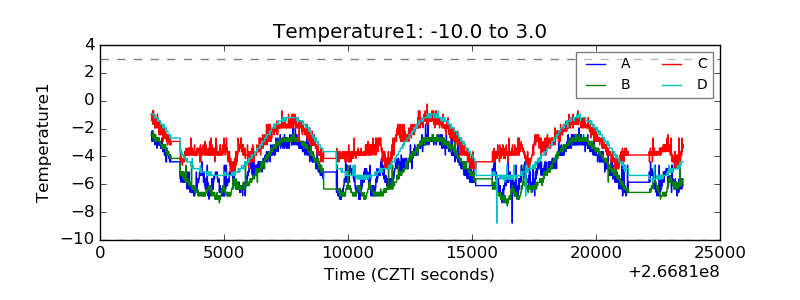 |
| Veto HV Monitor | 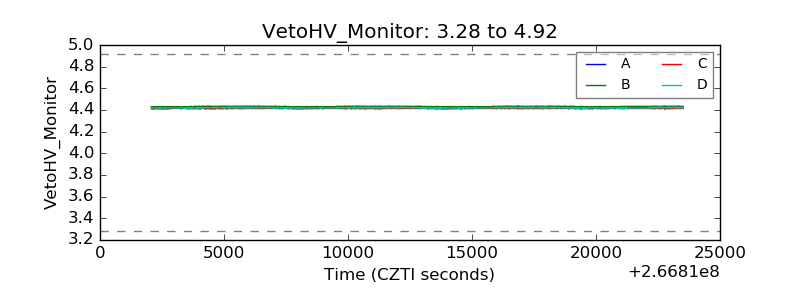 |
| Veto LLD | 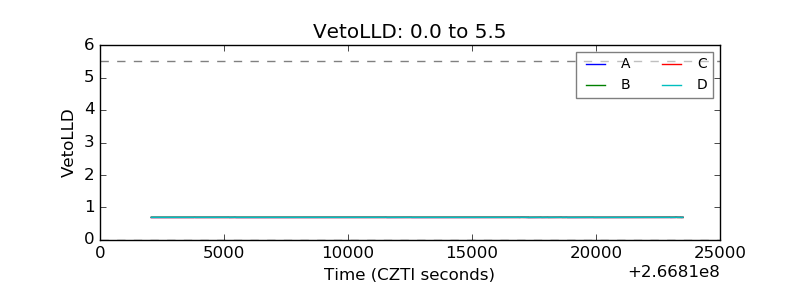 |
| Alpha Counter | 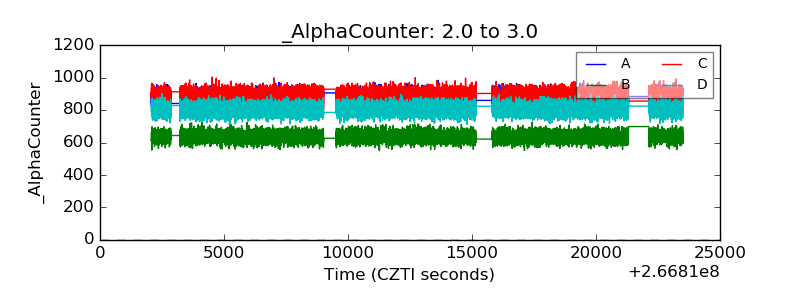 |
| _CPM_Rate | 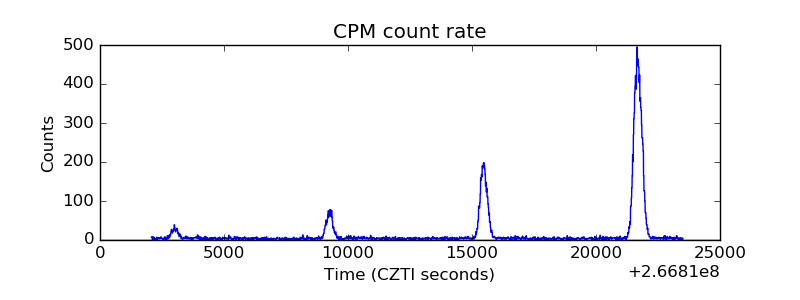 |
| CZT Counter | 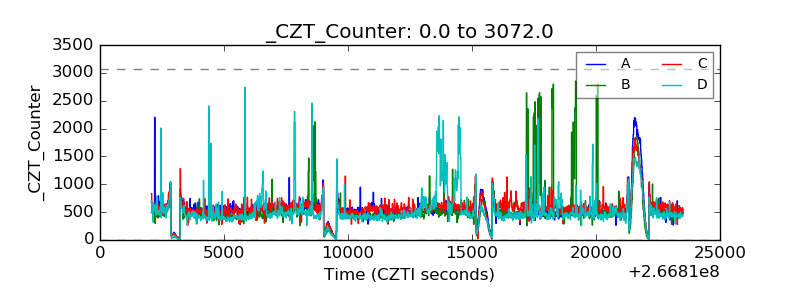 |
| +2.5 Volts monitor | 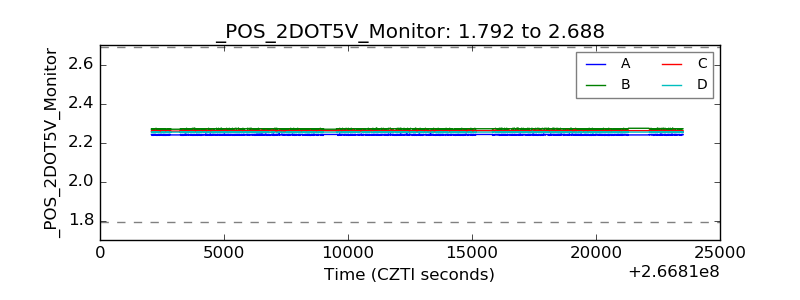 |
| +5 Volts monitor | 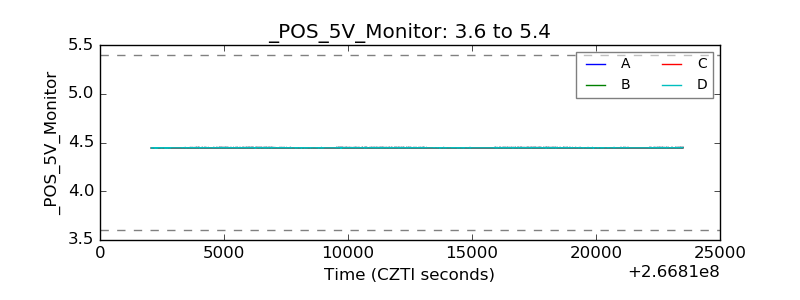 |
| _ROLL_ROT |  |
| _Roll_DEC | 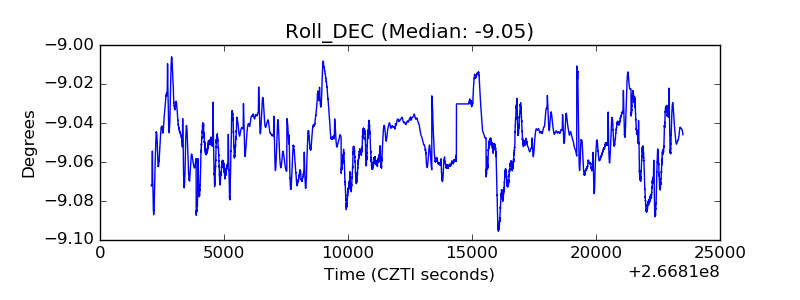 |
| _Roll_RA | 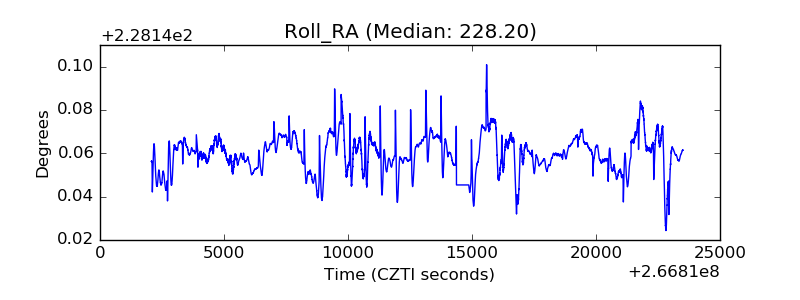 |
| Veto Counter |  |