| Param | Original file | Final file |
|---|---|---|
| Filename | modeM0/AS1A04_101T01_9000002170_14686cztM0_level2.evt | modeM0/AS1A04_101T01_9000002170_14686cztM0_level2_quad_clean.evt |
| Size (bytes) | 270,086,400 | 45,938,880 |
| Size | 257.6 MB | 43.8 MB |
| Events in quadrant A | 1,927,879 | 281,757 |
| Events in quadrant B | 1,985,914 | 279,388 |
| Events in quadrant C | 2,195,062 | 276,294 |
| Events in quadrant D | 1,799,189 | 272,841 |
| Mode M9 | |||
|---|---|---|---|
| Quadrant | BADHDUFLAG | Total packets | Discarded packets |
| A | 0 | 2 | 0 |
| B | 0 | 2 | 0 |
| C | 0 | 2 | 0 |
| D | 0 | 3 | 0 |
| Mode SS | |||
|---|---|---|---|
| Quadrant | BADHDUFLAG | Total packets | Discarded packets |
| A | 0 | 80 | 0 |
| B | 0 | 80 | 0 |
| C | 0 | 80 | 0 |
| D | 0 | 80 | 0 |
| Mode M0 | |||
|---|---|---|---|
| Quadrant | BADHDUFLAG | Total packets | Discarded packets |
| A | 0 | 8065 | 1 |
| B | 0 | 8321 | 1 |
| C | 0 | 8797 | 1 |
| D | 0 | 8105 | 1 |
| Quadrant | Total seconds | Saturated seconds | Saturation percentage |
|---|---|---|---|
| A | 3971 | 9 | 0.226643% |
| B | 3971 | 10 | 0.251826% |
| C | 3971 | 5 | 0.125913% |
| D | 3971 | 4 | 0.100730% |
Noise dominated data is calculated using 1-second bins in cleaned event files. If a bin has >2000 counts, and if more than 50% of those come from <1% of pixels, then it is considered to be noise-dominated and hence unusable.
| Quadrant | # 1 sec bins | Bins with >0 counts | Bins with >2000 counts | High rate bins dominated by noise | Noise dominated (total time) | Noise dominated (detector-on time) | Marked lightcurve |
|---|---|---|---|---|---|---|---|
| A | 3972 | 3972 | 0 | 0 | 0.00% | 0.00% | 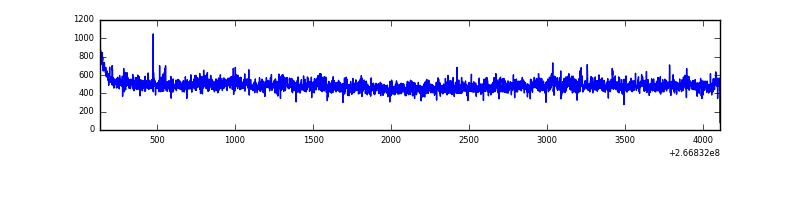 |
| B | 3972 | 3972 | 0 | 0 | 0.00% | 0.00% | 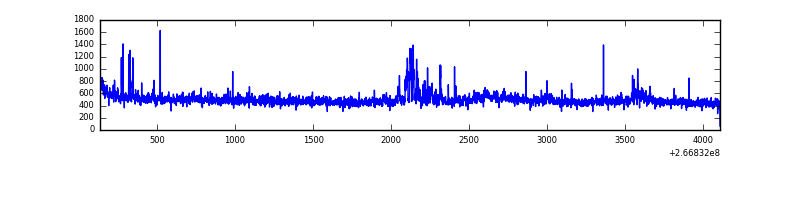 |
| C | 3972 | 3972 | 0 | 0 | 0.00% | 0.00% | 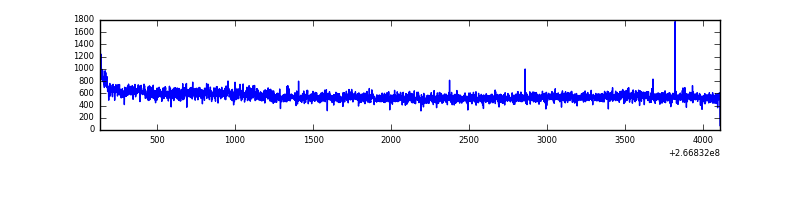 |
| D | 3972 | 3972 | 1 | 1 | 0.03% | 0.03% | 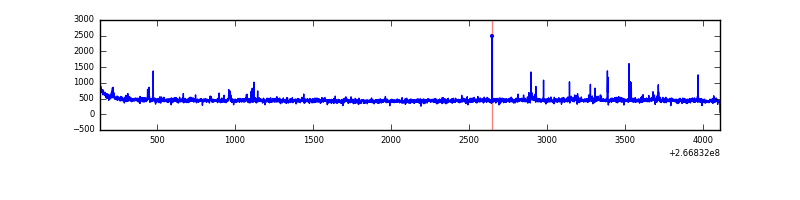 |
Top three noisy pixels from each quadrant. If the there are fewer than three noisy pixels in the level2.evt file, extra rows are filled as -1
| Pixel properties | Quadrant properties | ||||||
|---|---|---|---|---|---|---|---|
| Quadrant | DetID | PixID | Counts | Sigma | Mean | Median | Sigma |
| A | 8 | 15 | 49990 | 500.44 | 477 | 467 | 99.0 |
| A | 12 | 189 | 31112 | 309.67 | 477 | 467 | 99.0 |
| A | 1 | 162 | 6378 | 59.73 | 477 | 467 | 99.0 |
| B | 10 | 16 | 95199 | 1041.82 | 472 | 460 | 90.9 |
| B | 0 | 205 | 23601 | 254.48 | 472 | 460 | 90.9 |
| B | 4 | 173 | 13957 | 148.42 | 472 | 460 | 90.9 |
| C | 3 | 233 | 392963 | 3646.12 | 461 | 464 | 107.6 |
| C | 13 | 61 | 3340 | 26.72 | 461 | 464 | 107.6 |
| C | 14 | 234 | 3192 | 25.34 | 461 | 464 | 107.6 |
| D | 2 | 234 | 17021 | 144.54 | 460 | 448 | 114.7 |
| D | 13 | 172 | 11231 | 94.04 | 460 | 448 | 114.7 |
| D | 2 | 120 | 9547 | 79.36 | 460 | 448 | 114.7 |
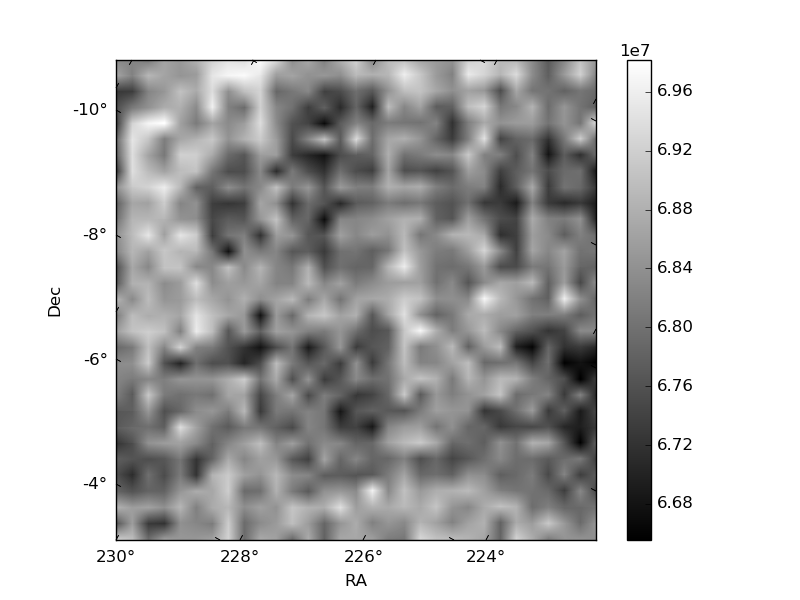
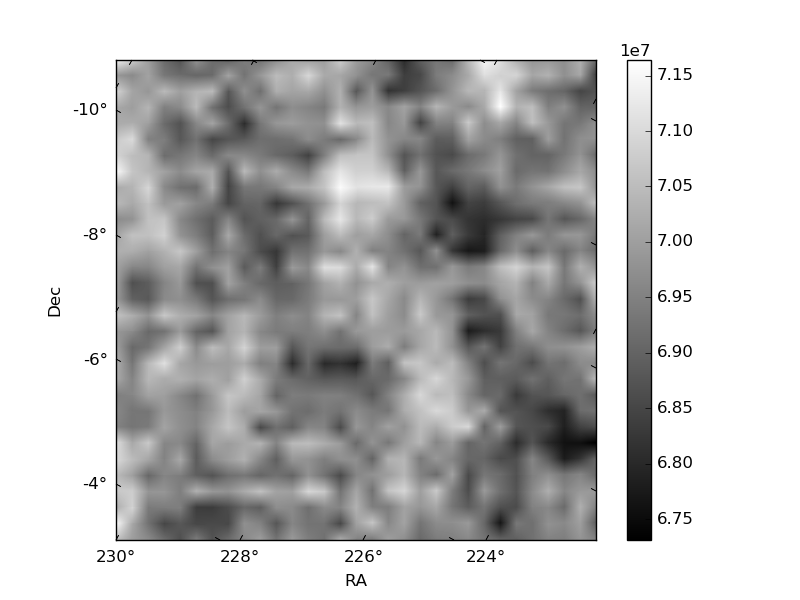
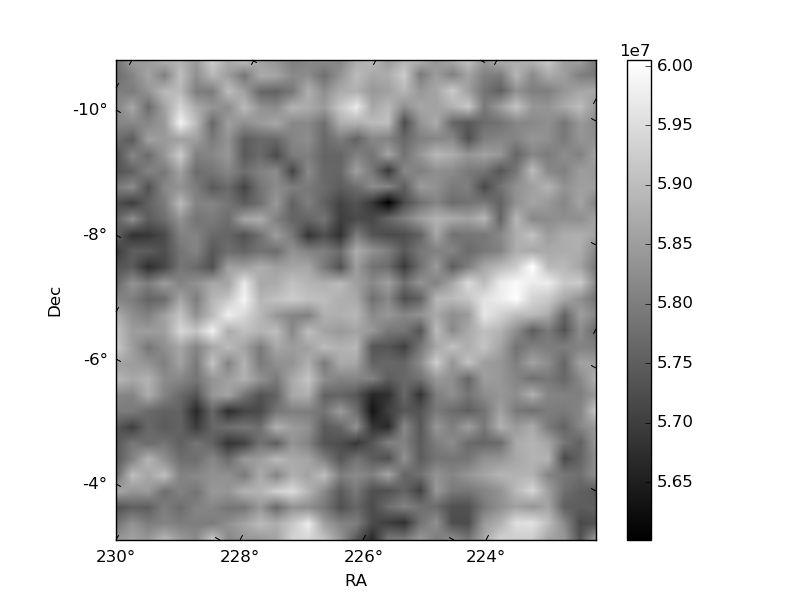
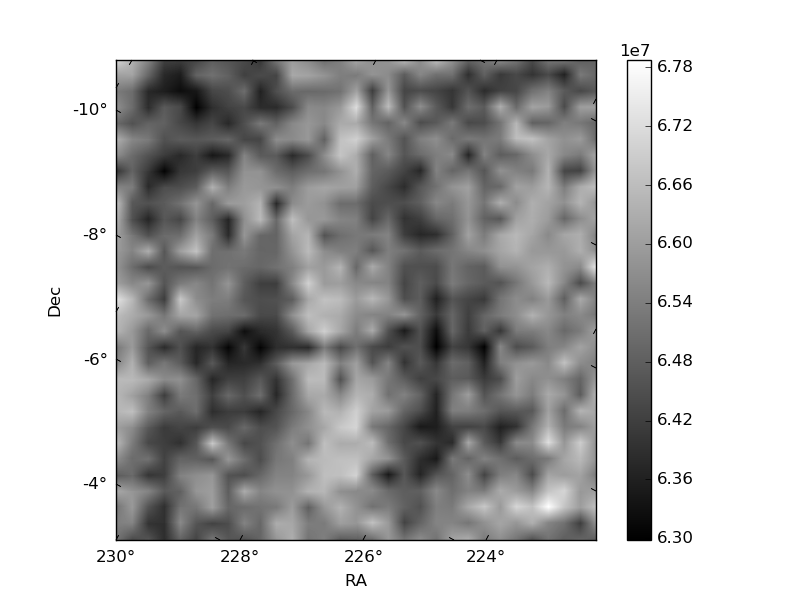
Histogram calculated using DETX and DETY for each event in the final _common_clean file
| Quadrant A | 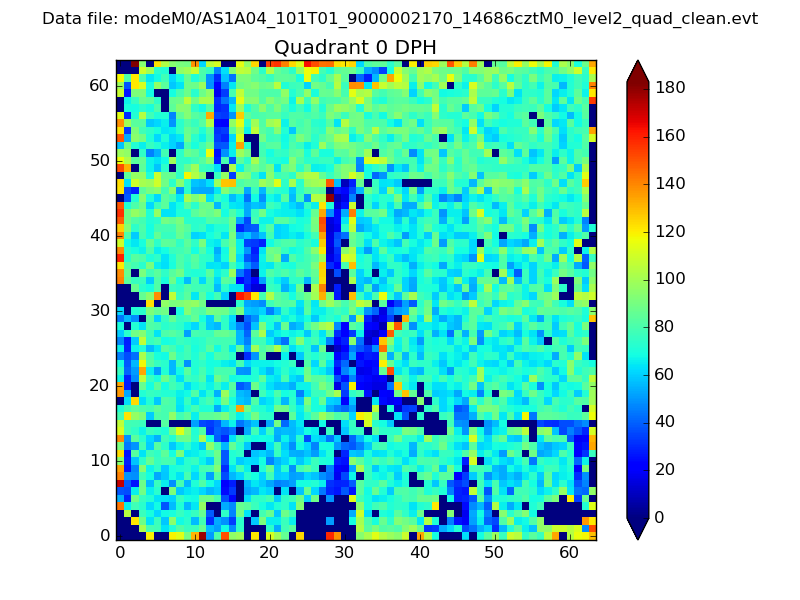 |
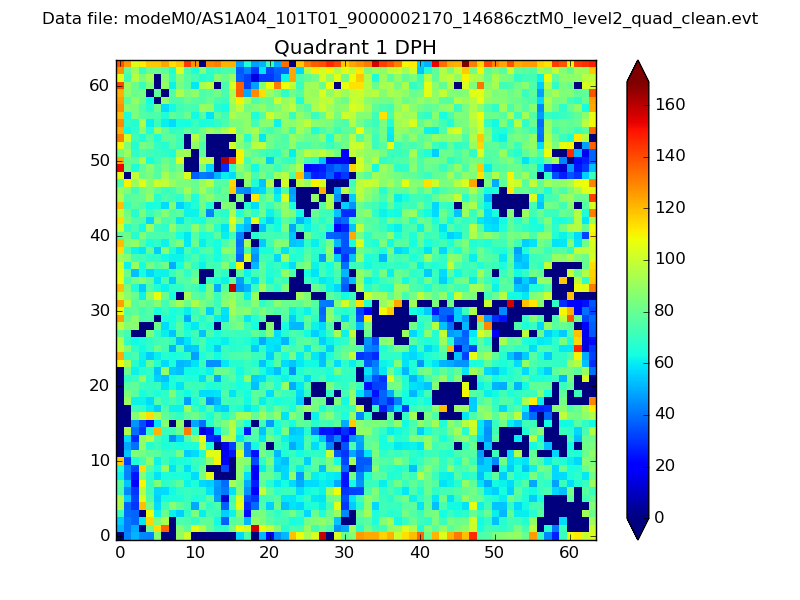 |
Quadrant B |
|---|---|---|---|
| Quadrant D | 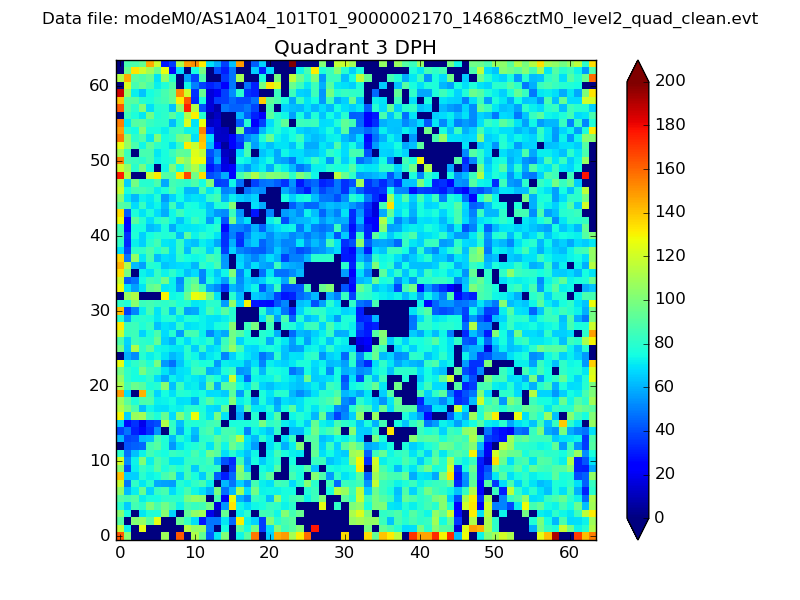 |
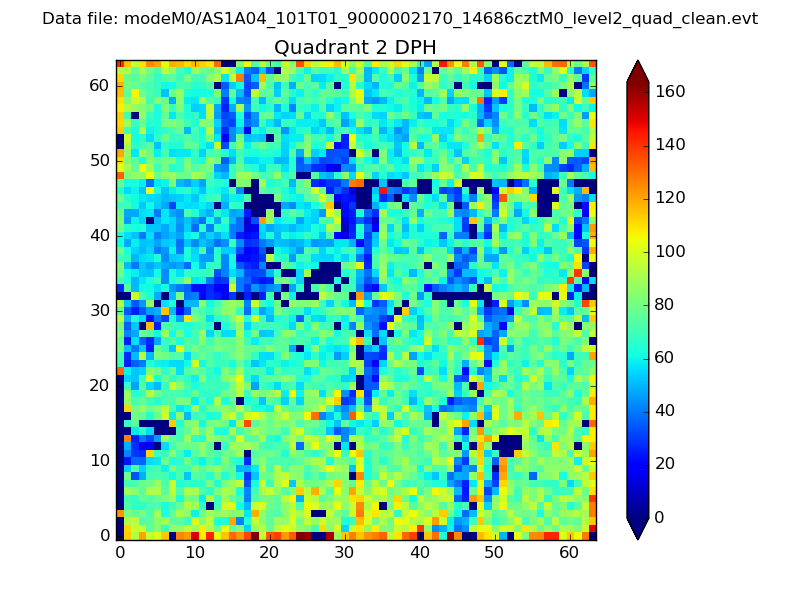 |
Quadrant C |
| Plot type | Count rate plots | Images |
|---|---|---|
| Comparison with Poisson distribution Blue bars denote a histogram of data divided into 1 sec bins. Red curve is a Poisson curve with rate = median count rate of data. |
 |
 |
| Quadrant-wise count rates Data is divided into 100 sec bins |
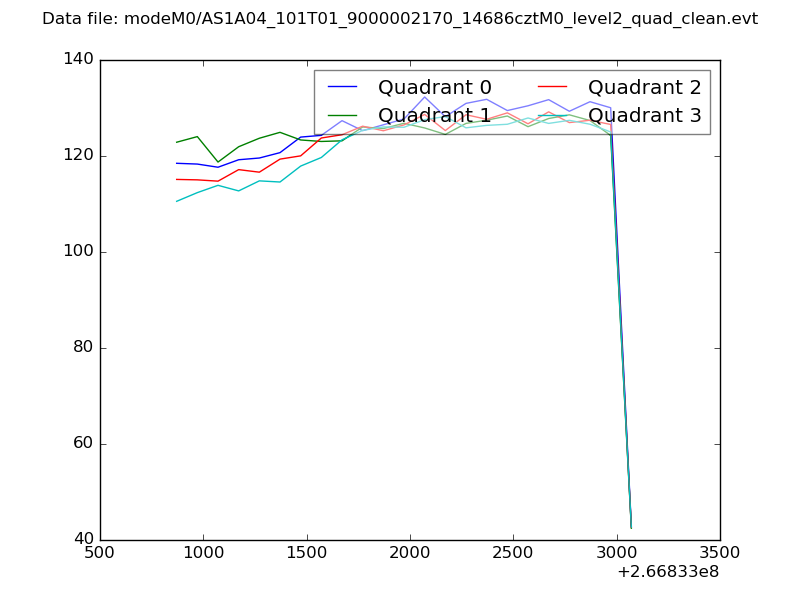 |
|
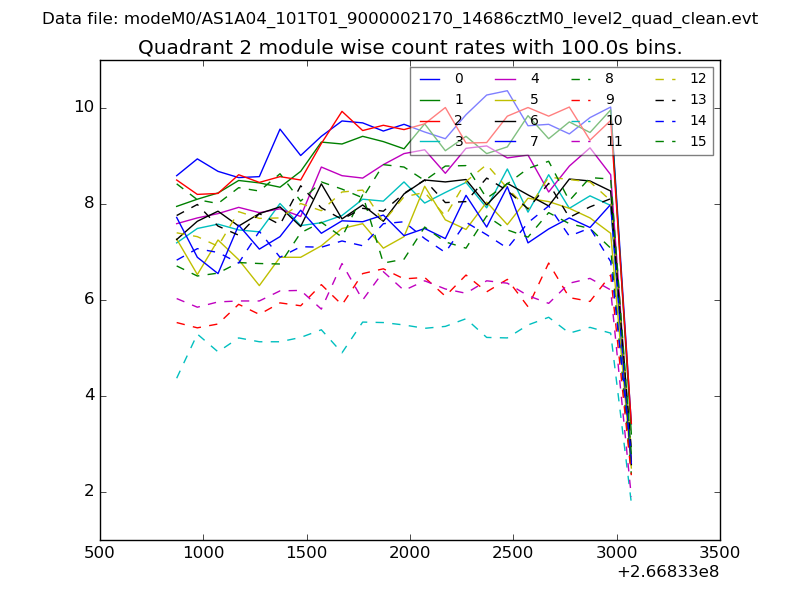
| Module-wise count rates for Quadrant A Data is divided into 100 sec bins |
 |
 |
| Module-wise count rates for Quadrant B Data is divided into 100 sec bins |
 |
 |
| Module-wise count rates for Quadrant C Data is divided into 100 sec bins |
 |
 |
| Module-wise count rates for Quadrant D Data is divided into 100 sec bins |
 |
 |
| Parameter | Plot |
|---|---|
| CZT HV Monitor | 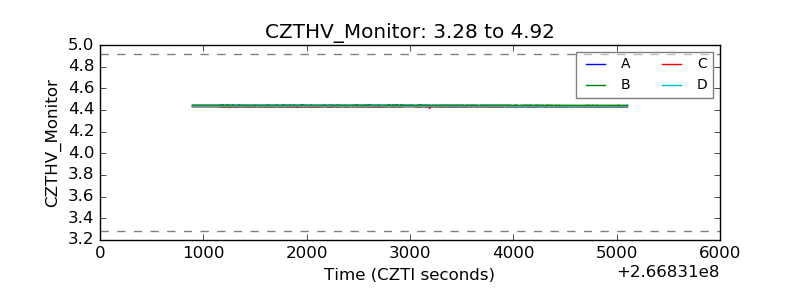 |
| D_VDD | 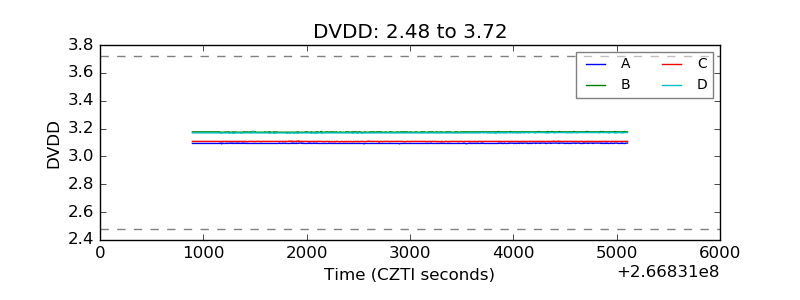 |
| Temperature 1 | 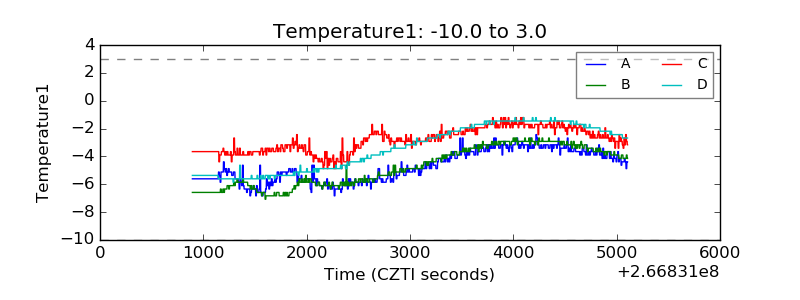 |
| Veto HV Monitor |  |
| Veto LLD | 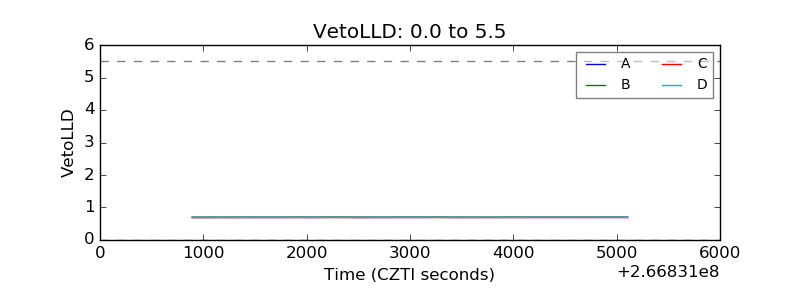 |
| Alpha Counter | 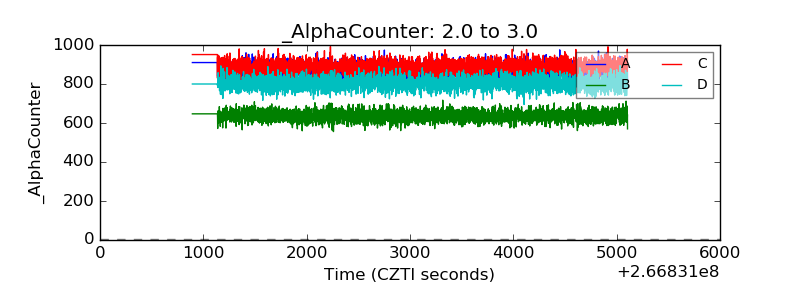 |
| _CPM_Rate | 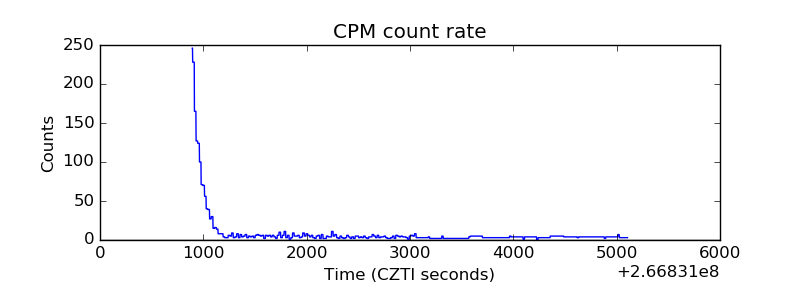 |
| CZT Counter |  |
| +2.5 Volts monitor |  |
| +5 Volts monitor |  |
| _ROLL_ROT | 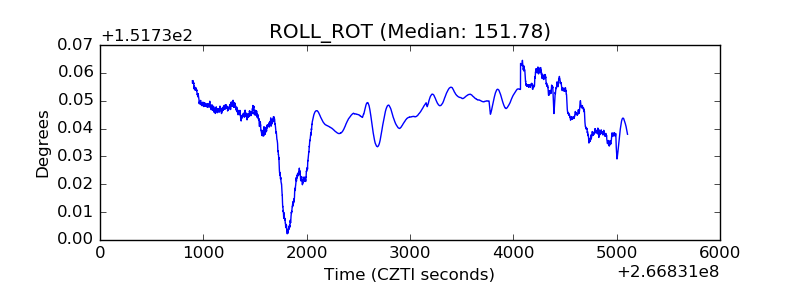 |
| _Roll_DEC |  |
| _Roll_RA |  |
| Veto Counter |  |