| Param | Original file | Final file |
|---|---|---|
| Filename | modeM0/AS1A04_011T07_9000002172cztM0_level2.fits | modeM0/AS1A04_011T07_9000002172cztM0_level2_quad_clean.evt |
| Size (bytes) | 494,956,800 | 441,699,840 |
| Size | 472.0 MB | 421.2 MB |
| Events in quadrant A | 3,091,712 | 2,651,148 |
| Events in quadrant B | 2,917,580 | 2,558,872 |
| Events in quadrant C | 2,953,446 | 2,453,589 |
| Events in quadrant D | 2,640,394 | 2,325,713 |
| Mode M0 | |||
|---|---|---|---|
| Quadrant | BADHDUFLAG | Total packets | Discarded packets |
| A | 0 | 108830 | 0 |
| B | 0 | 108688 | 0 |
| C | 0 | 125112 | 0 |
| D | 0 | 110546 | 0 |
| Mode M9 | |||
|---|---|---|---|
| Quadrant | BADHDUFLAG | Total packets | Discarded packets |
| A | 0 | 97 | 0 |
| B | 0 | 97 | 0 |
| C | 0 | 97 | 0 |
| D | 0 | 97 | 0 |
| Mode SS | |||
|---|---|---|---|
| Quadrant | BADHDUFLAG | Total packets | Discarded packets |
| A | 0 | 1008 | 0 |
| B | 0 | 1008 | 0 |
| C | 0 | 1008 | 0 |
| D | 0 | 1008 | 0 |
| Quadrant | Total seconds | Saturated seconds | Saturation percentage |
|---|---|---|---|
| A | 49352 | 606 | 1.227914% |
| B | 49352 | 878 | 1.779057% |
| C | 49352 | 613 | 1.242098% |
| D | 49352 | 786 | 1.592641% |
Noise dominated data is calculated using 1-second bins in cleaned event files. If a bin has >2000 counts, and if more than 50% of those come from <1% of pixels, then it is considered to be noise-dominated and hence unusable.
| Quadrant | # 1 sec bins | Bins with >0 counts | Bins with >2000 counts | High rate bins dominated by noise | Noise dominated (total time) | Noise dominated (detector-on time) | Marked lightcurve |
|---|---|---|---|---|---|---|---|
| A | 59088 | 49346 | 0 | 0 | 0.00% | 0.00% |  |
| B | 59088 | 49328 | 0 | 0 | 0.00% | 0.00% |  |
| C | 59088 | 49332 | 0 | 0 | 0.00% | 0.00% | 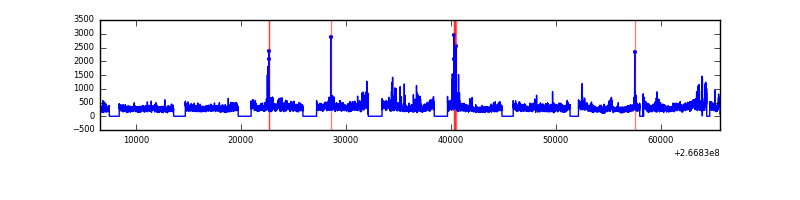 |
| D | 59088 | 49344 | 0 | 0 | 0.00% | 0.00% |  |
Top three noisy pixels from each quadrant. If the there are fewer than three noisy pixels in the level2.evt file, extra rows are filled as -1
| Pixel properties | Quadrant properties | ||||||
|---|---|---|---|---|---|---|---|
| Quadrant | DetID | PixID | Counts | Sigma | Mean | Median | Sigma |
| A | 0 | 29 | 2940 | 11.08 | 804 | 756 | 197.0 |
| A | 7 | 110 | 2496 | 8.83 | 804 | 756 | 197.0 |
| A | 9 | 19 | 2294 | 7.81 | 804 | 756 | 197.0 |
| B | 2 | 9 | 2469 | 11.23 | 770 | 735 | 154.3 |
| B | 5 | 128 | 1938 | 7.79 | 770 | 735 | 154.3 |
| B | 3 | 17 | 1924 | 7.7 | 770 | 735 | 154.3 |
| C | 3 | 126 | 1980 | 6.2 | 782 | 730 | 201.5 |
| C | 12 | 241 | 1979 | 6.19 | 782 | 730 | 201.5 |
| C | 2 | 191 | 1958 | 6.09 | 782 | 730 | 201.5 |
| D | 6 | 231 | 1936 | 6.21 | 753 | 689 | 200.8 |
| D | 6 | 67 | 1866 | 5.86 | 753 | 689 | 200.8 |
| D | 10 | 189 | 1857 | 5.82 | 753 | 689 | 200.8 |
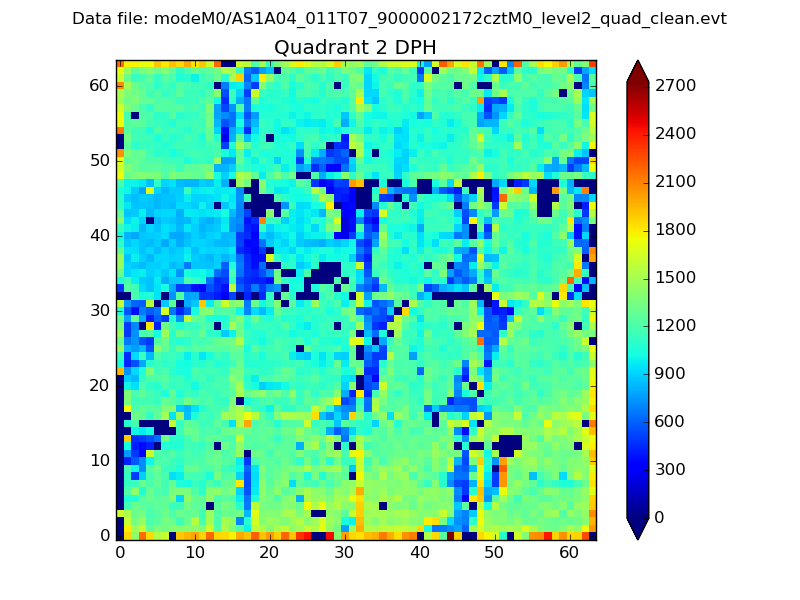
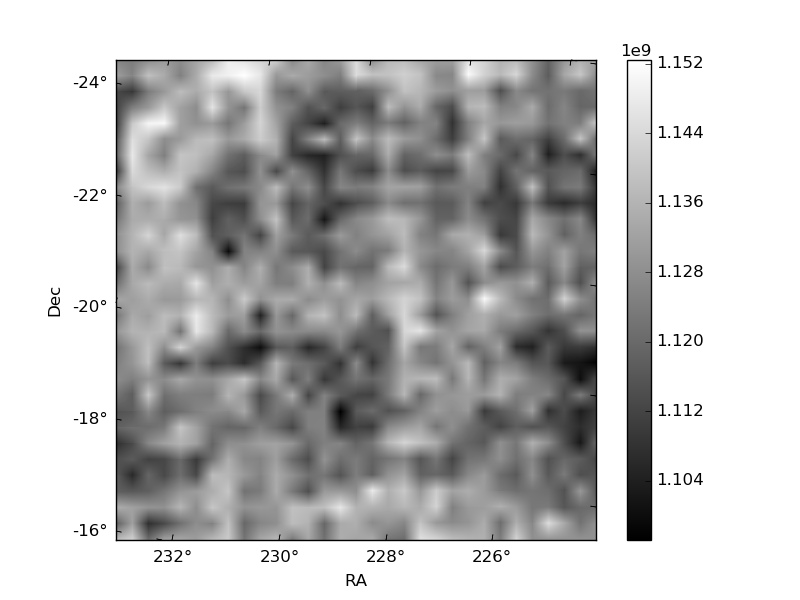
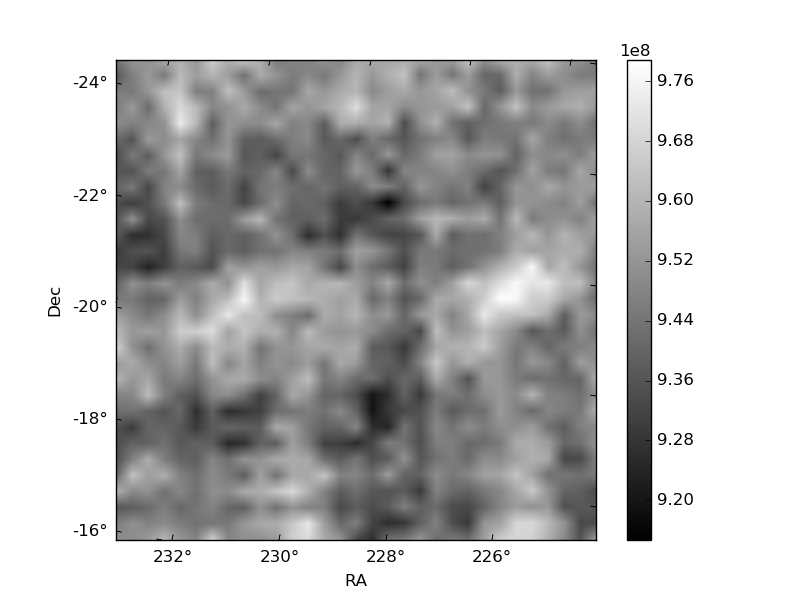
Histogram calculated using DETX and DETY for each event in the final _common_clean file
| Quadrant A |  |
 |
Quadrant B |
|---|---|---|---|
| Quadrant D | 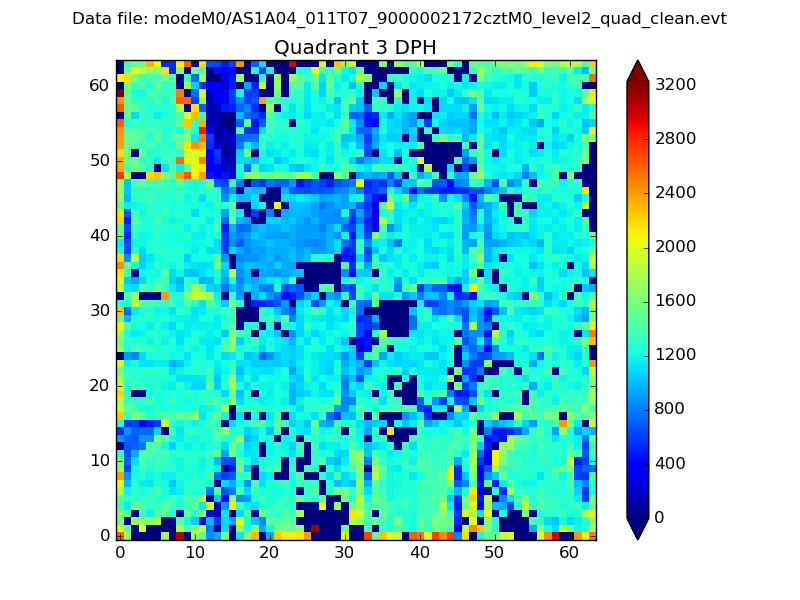 |
 |
Quadrant C |
| Plot type | Count rate plots | Images |
|---|---|---|
| Comparison with Poisson distribution Blue bars denote a histogram of data divided into 1 sec bins. Red curve is a Poisson curve with rate = median count rate of data. |
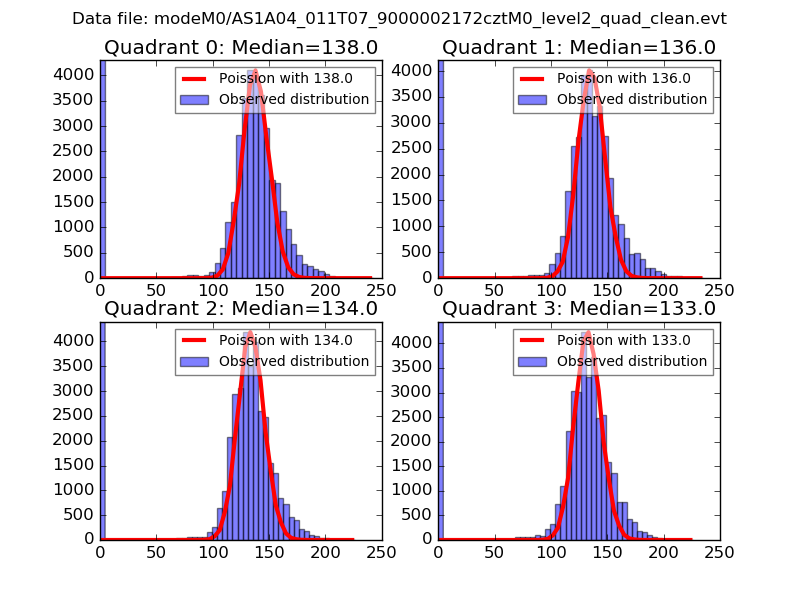 |
 |
| Quadrant-wise count rates Data is divided into 100 sec bins |
 |
|
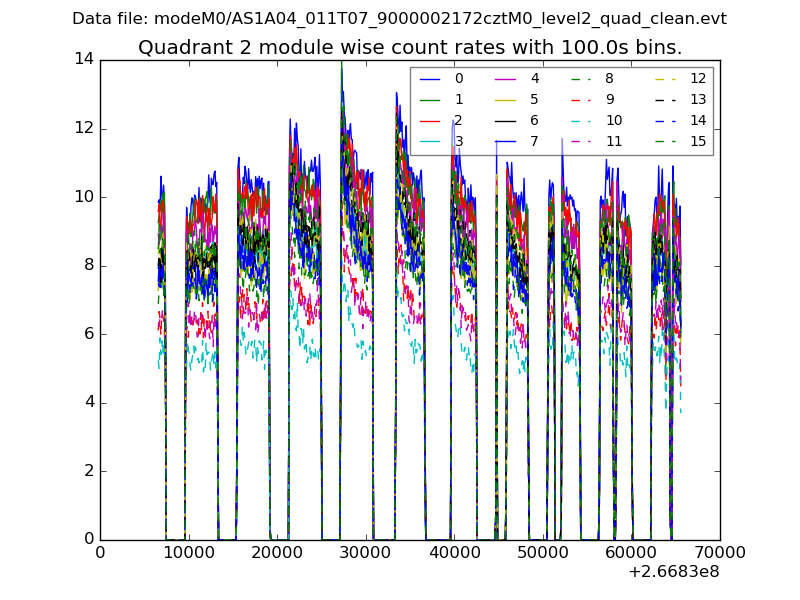
| Module-wise count rates for Quadrant A Data is divided into 100 sec bins |
 |
 |
| Module-wise count rates for Quadrant B Data is divided into 100 sec bins |
 |
 |
| Module-wise count rates for Quadrant C Data is divided into 100 sec bins |
 |
 |
| Module-wise count rates for Quadrant D Data is divided into 100 sec bins |
 |
 |
| Parameter | Plot |
|---|---|
| CZT HV Monitor |  |
| D_VDD | 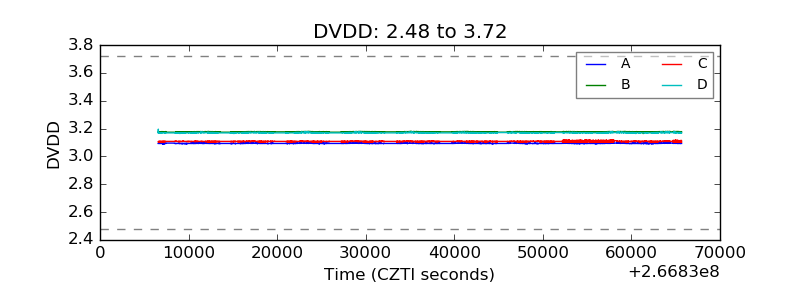 |
| Temperature 1 |  |
| Veto HV Monitor | 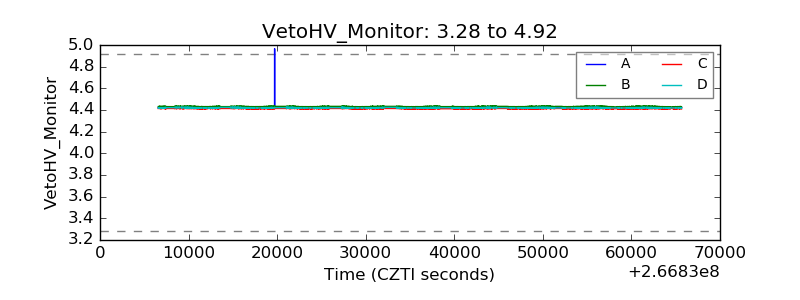 |
| Veto LLD | 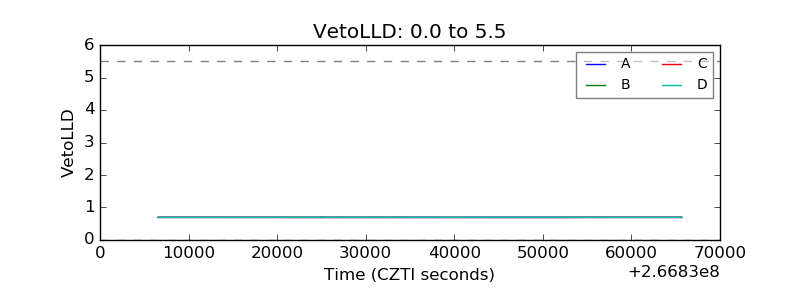 |
| Alpha Counter |  |
| _CPM_Rate | 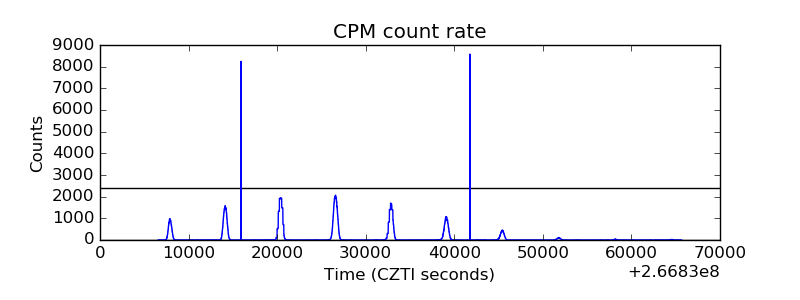 |
| CZT Counter | 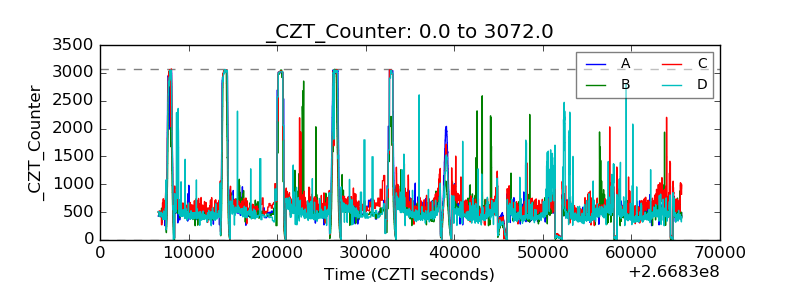 |
| +2.5 Volts monitor |  |
| +5 Volts monitor |  |
| _ROLL_ROT |  |
| _Roll_DEC |  |
| _Roll_RA | 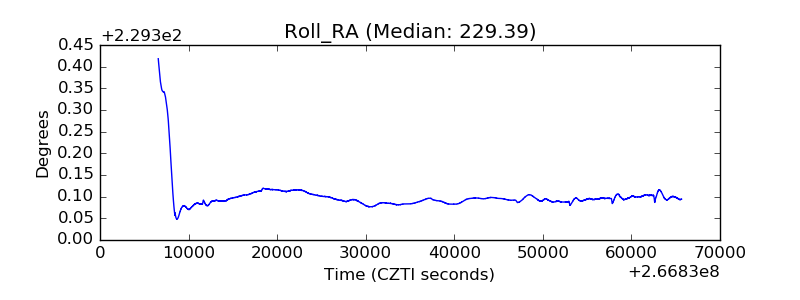 |
| Veto Counter |  |