| Param | Original file | Final file |
|---|---|---|
| Filename | modeM0/AS1A04_011T07_9000002172_14686cztM0_level2.evt | modeM0/AS1A04_011T07_9000002172_14686cztM0_level2_quad_clean.evt |
| Size (bytes) | 177,494,400 | 22,608,000 |
| Size | 169.3 MB | 21.6 MB |
| Events in quadrant A | 1,214,488 | 131,428 |
| Events in quadrant B | 1,207,099 | 129,824 |
| Events in quadrant C | 1,374,865 | 129,396 |
| Events in quadrant D | 1,420,410 | 127,433 |
| Mode M0 | |||
|---|---|---|---|
| Quadrant | BADHDUFLAG | Total packets | Discarded packets |
| A | 0 | 4927 | 2 |
| B | 0 | 4916 | 1 |
| C | 0 | 5620 | 1 |
| D | 0 | 5736 | 1 |
| Mode M9 | |||
|---|---|---|---|
| Quadrant | BADHDUFLAG | Total packets | Discarded packets |
| A | 0 | 10 | 0 |
| B | 0 | 10 | 0 |
| C | 0 | 10 | 0 |
| D | 0 | 10 | 0 |
| Mode SS | |||
|---|---|---|---|
| Quadrant | BADHDUFLAG | Total packets | Discarded packets |
| A | 0 | 48 | 0 |
| B | 0 | 48 | 0 |
| C | 0 | 48 | 0 |
| D | 0 | 48 | 0 |
| Quadrant | Total seconds | Saturated seconds | Saturation percentage |
|---|---|---|---|
| A | 2300 | 61 | 2.652174% |
| B | 2300 | 72 | 3.130435% |
| C | 2300 | 63 | 2.739130% |
| D | 2300 | 145 | 6.304348% |
Noise dominated data is calculated using 1-second bins in cleaned event files. If a bin has >2000 counts, and if more than 50% of those come from <1% of pixels, then it is considered to be noise-dominated and hence unusable.
| Quadrant | # 1 sec bins | Bins with >0 counts | Bins with >2000 counts | High rate bins dominated by noise | Noise dominated (total time) | Noise dominated (detector-on time) | Marked lightcurve |
|---|---|---|---|---|---|---|---|
| A | 3251 | 2301 | 0 | 0 | 0.00% | 0.00% | 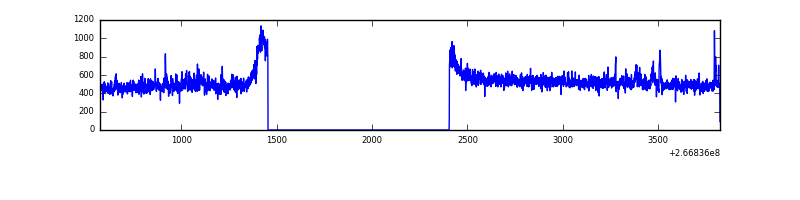 |
| B | 3251 | 2301 | 0 | 0 | 0.00% | 0.00% | 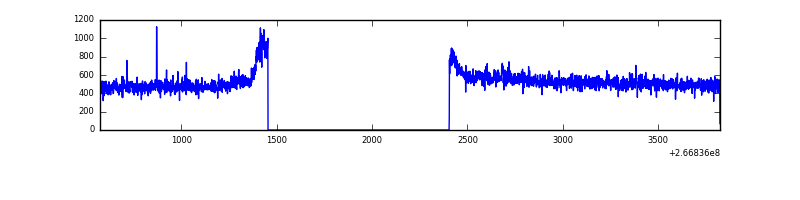 |
| C | 3251 | 2301 | 1 | 1 | 0.03% | 0.04% | 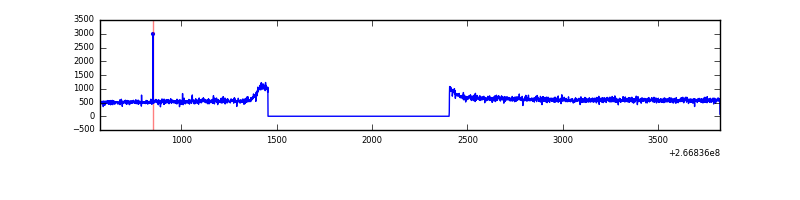 |
| D | 3251 | 2301 | 77 | 77 | 2.37% | 3.35% | 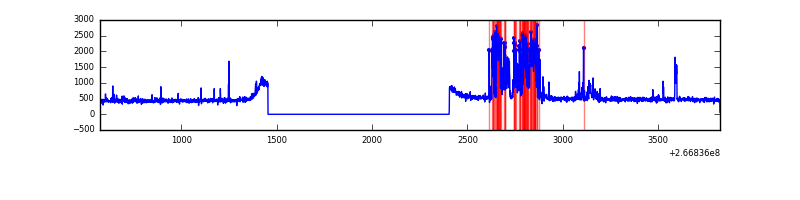 |
Top three noisy pixels from each quadrant. If the there are fewer than three noisy pixels in the level2.evt file, extra rows are filled as -1
| Pixel properties | Quadrant properties | ||||||
|---|---|---|---|---|---|---|---|
| Quadrant | DetID | PixID | Counts | Sigma | Mean | Median | Sigma |
| A | 12 | 189 | 23632 | 366.03 | 305 | 298 | 63.7 |
| A | 11 | 29 | 9125 | 138.46 | 305 | 298 | 63.7 |
| A | 8 | 15 | 5519 | 81.9 | 305 | 298 | 63.7 |
| B | 0 | 214 | 8885 | 140.34 | 306 | 298 | 61.2 |
| B | 12 | 111 | 7212 | 113.0 | 306 | 298 | 61.2 |
| B | 11 | 111 | 6003 | 93.24 | 306 | 298 | 61.2 |
| C | 3 | 233 | 206065 | 2906.09 | 299 | 301 | 70.8 |
| C | 14 | 234 | 3150 | 40.24 | 299 | 301 | 70.8 |
| C | 13 | 61 | 2148 | 26.09 | 299 | 301 | 70.8 |
| D | 2 | 14 | 289927 | 3986.15 | 291 | 284 | 72.7 |
| D | 12 | 110 | 14999 | 202.51 | 291 | 284 | 72.7 |
| D | 2 | 234 | 7551 | 100.01 | 291 | 284 | 72.7 |
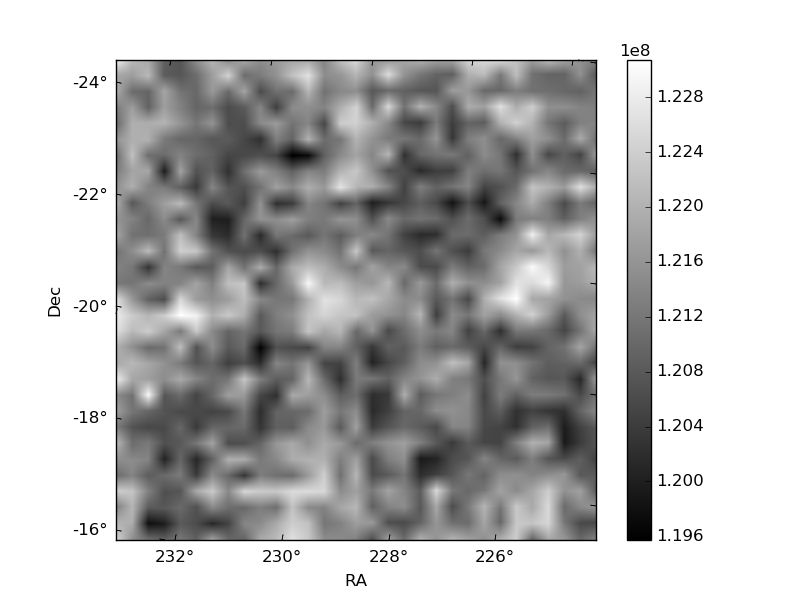
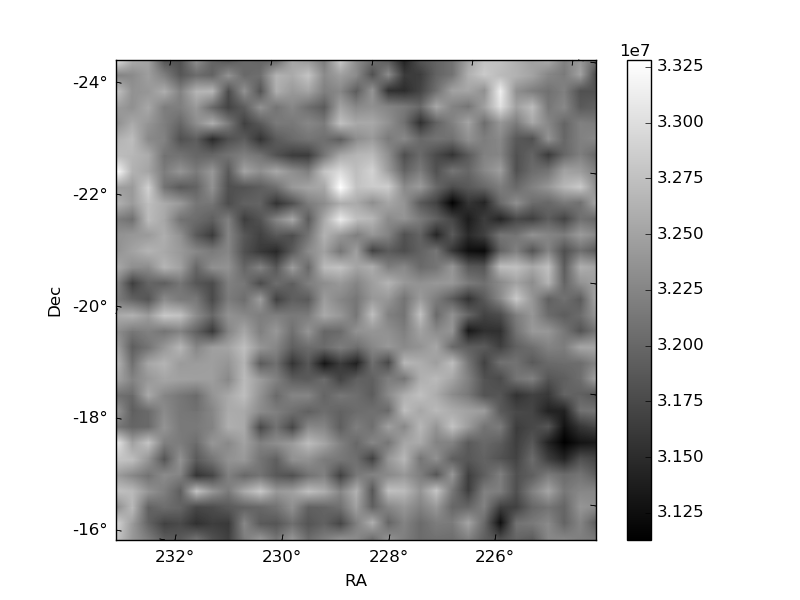
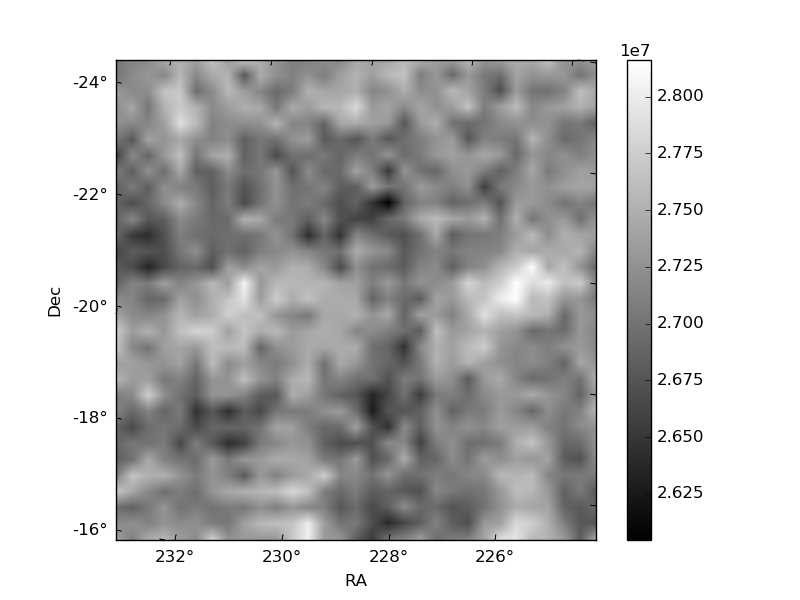
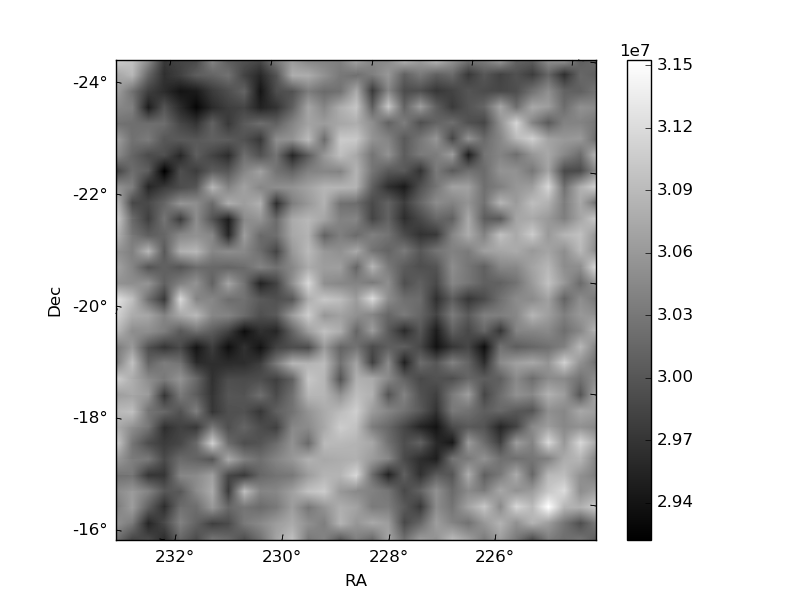
Histogram calculated using DETX and DETY for each event in the final _common_clean file
| Quadrant A | 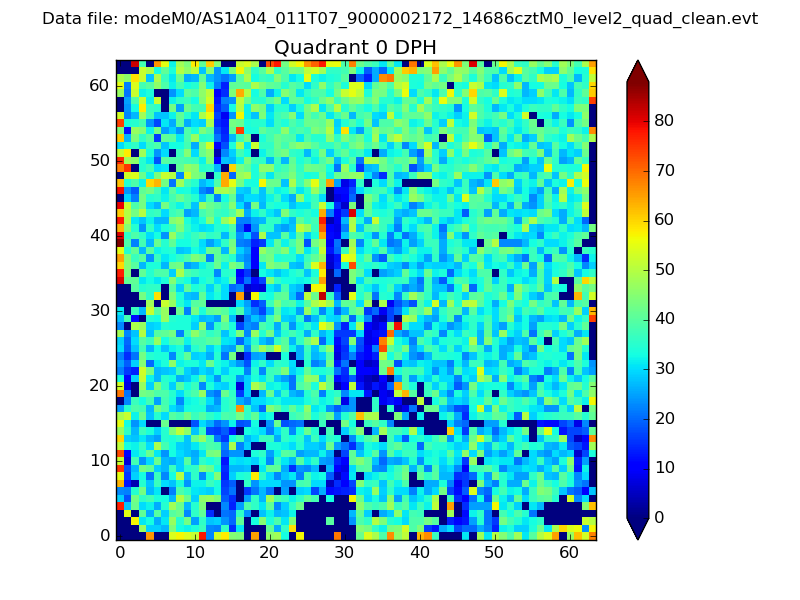 |
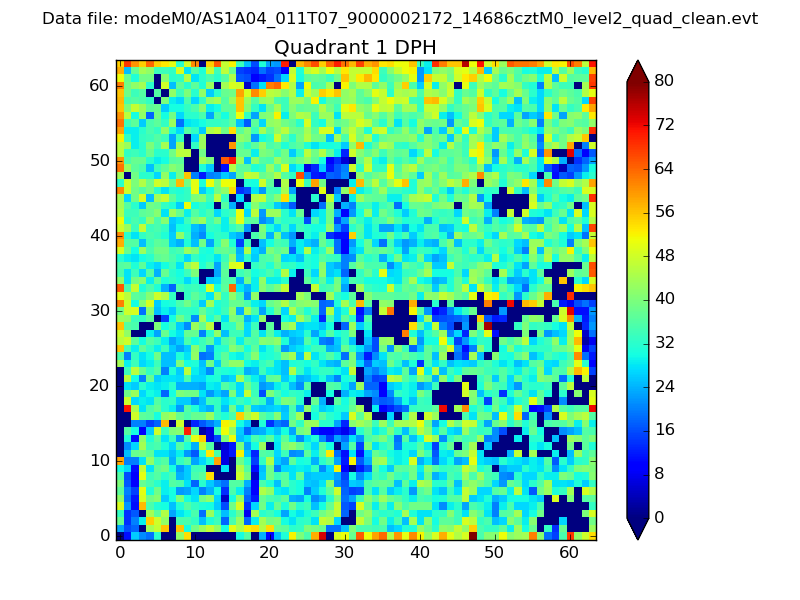 |
Quadrant B |
|---|---|---|---|
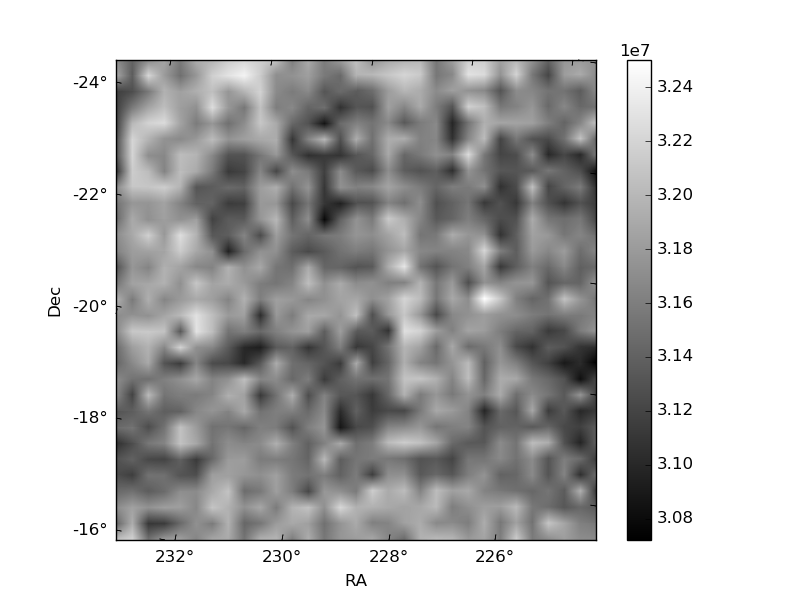
| Quadrant D | 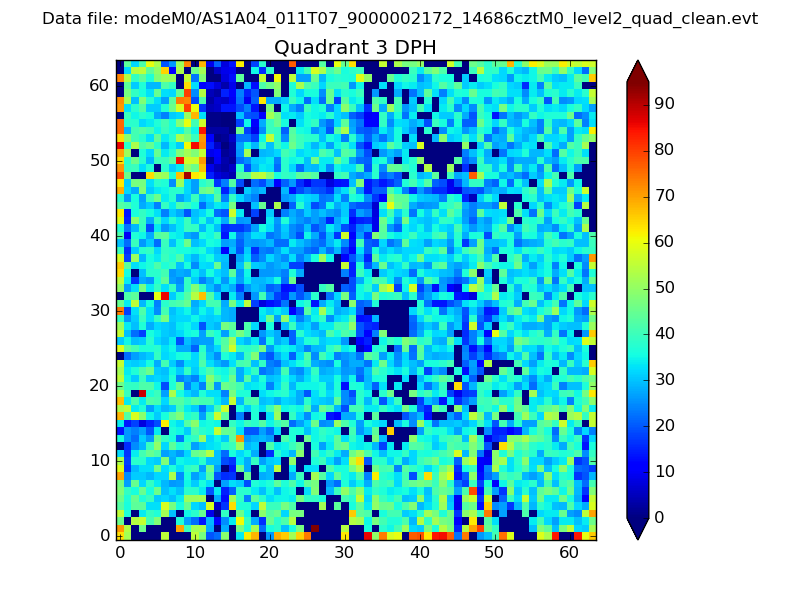 |
 |
Quadrant C |
| Plot type | Count rate plots | Images |
|---|---|---|
| Comparison with Poisson distribution Blue bars denote a histogram of data divided into 1 sec bins. Red curve is a Poisson curve with rate = median count rate of data. |
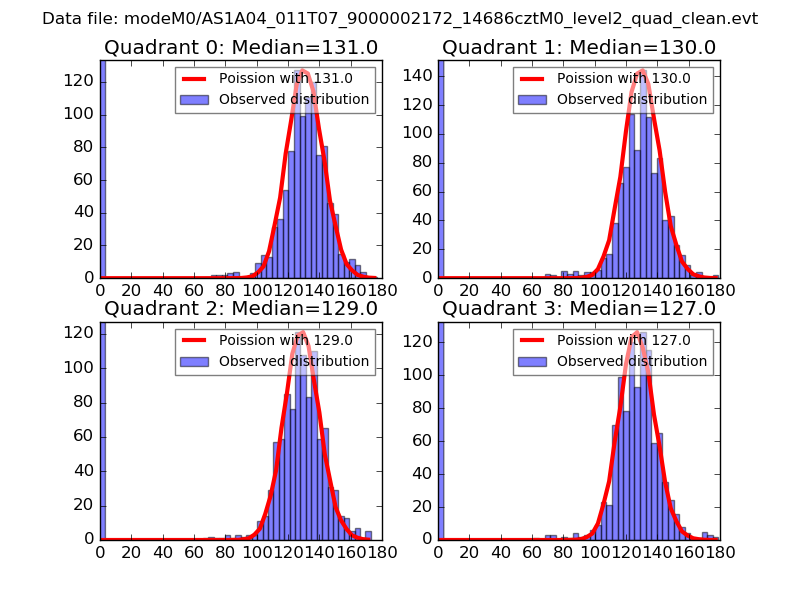 |
 |
| Quadrant-wise count rates Data is divided into 100 sec bins |
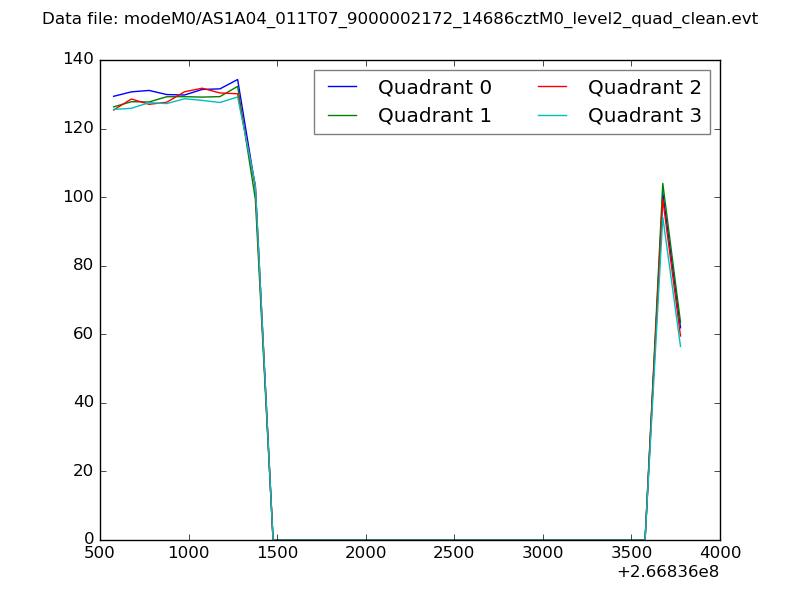 |
|
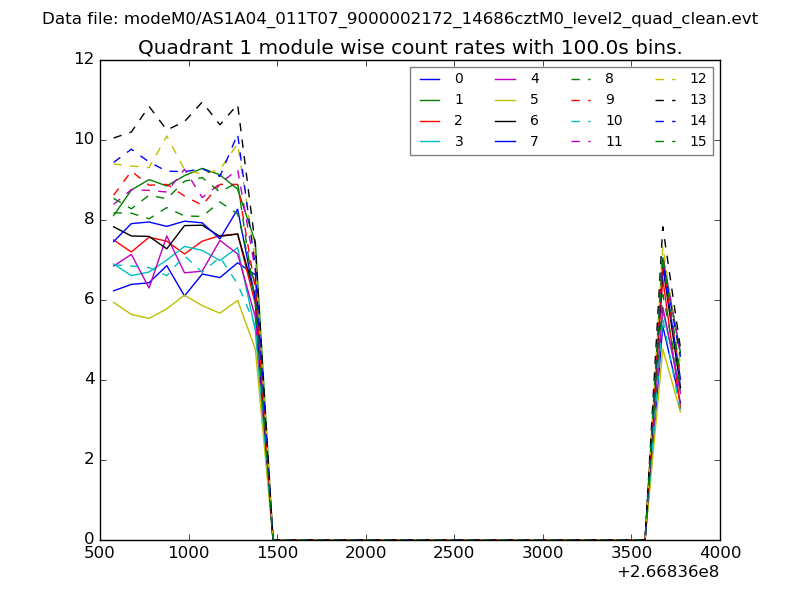
| Module-wise count rates for Quadrant A Data is divided into 100 sec bins |
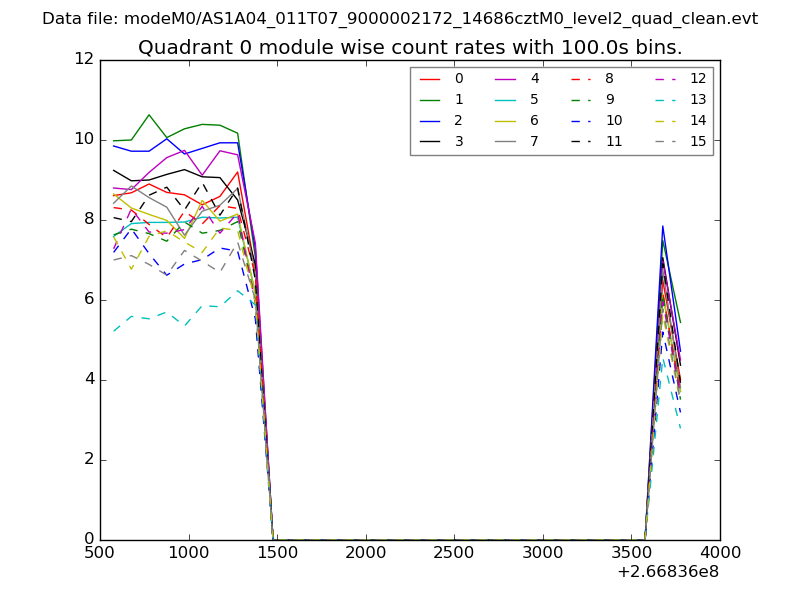 |
 |
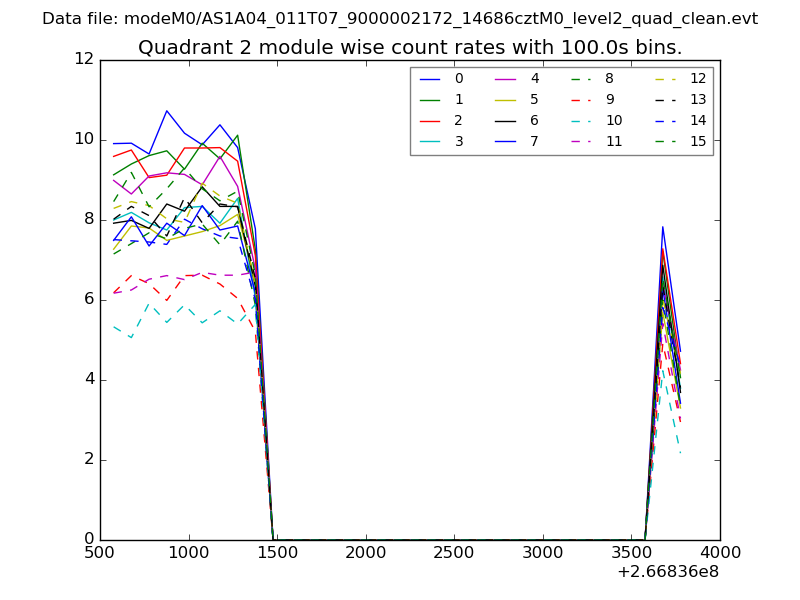
| Module-wise count rates for Quadrant B Data is divided into 100 sec bins |
 |
 |
| Module-wise count rates for Quadrant C Data is divided into 100 sec bins |
 |
 |
| Module-wise count rates for Quadrant D Data is divided into 100 sec bins |
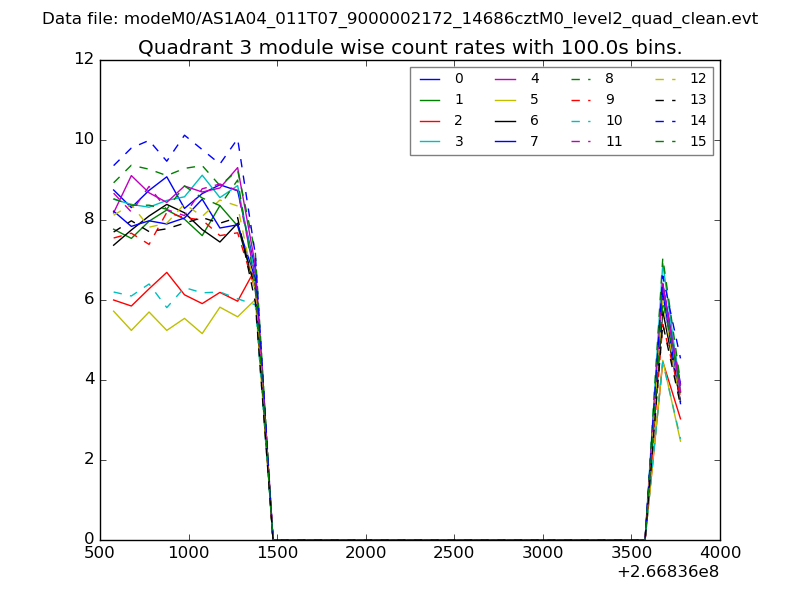 |
 |
| Parameter | Plot |
|---|---|
| CZT HV Monitor | 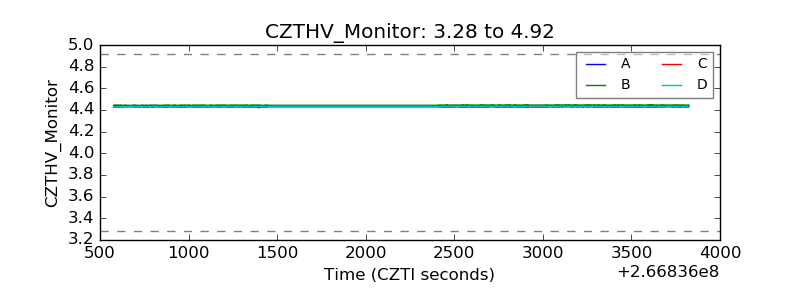 |
| D_VDD | 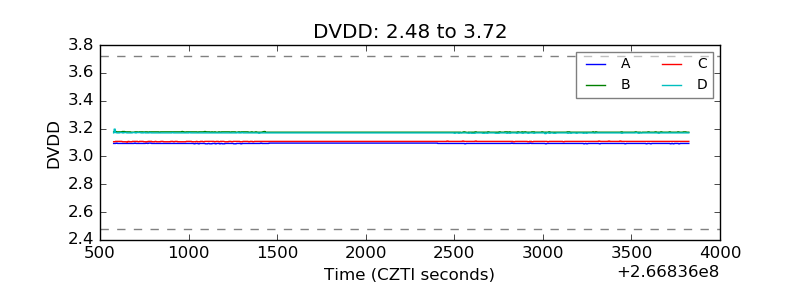 |
| Temperature 1 | 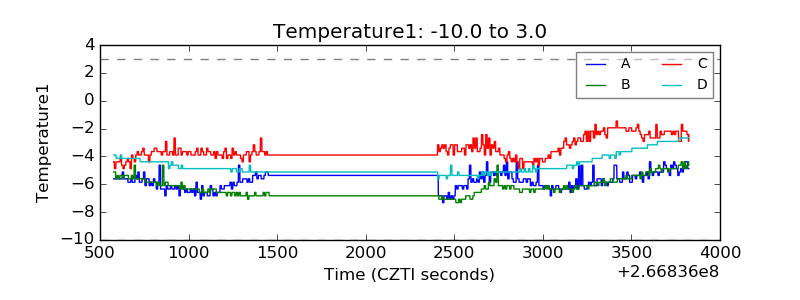 |
| Veto HV Monitor | 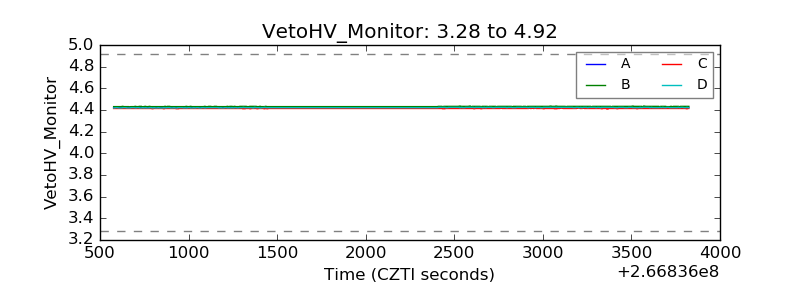 |
| Veto LLD | 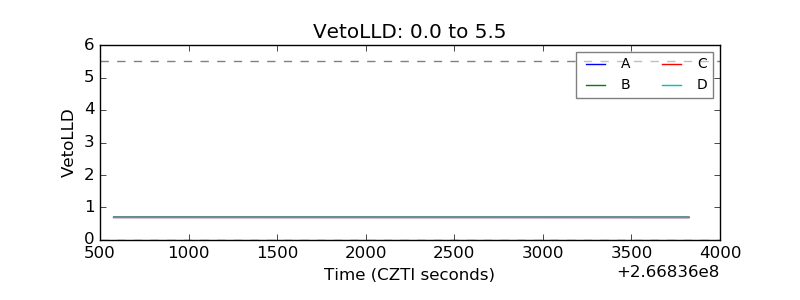 |
| Alpha Counter | 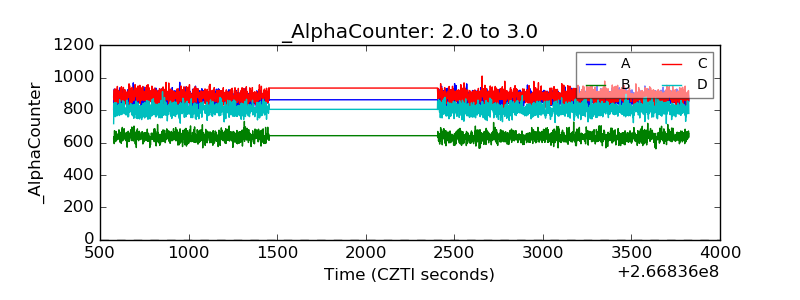 |
| _CPM_Rate | 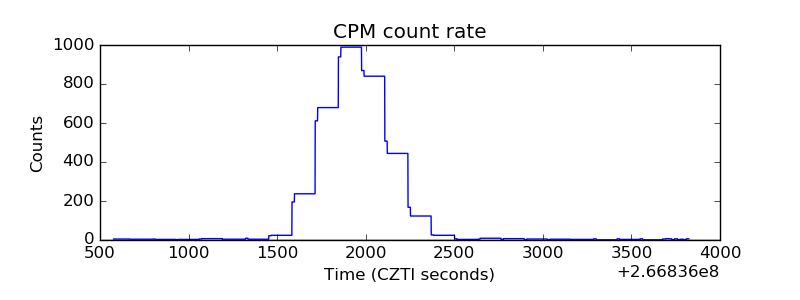 |
| CZT Counter | 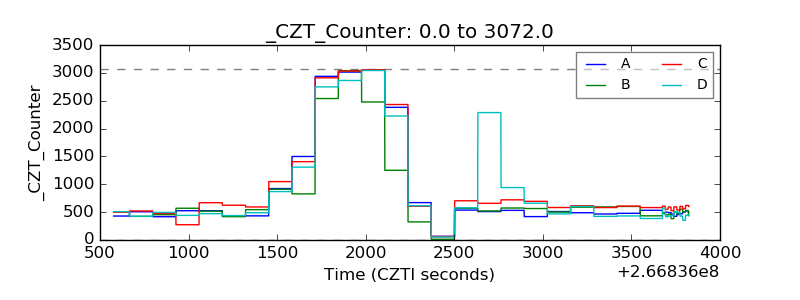 |
| +2.5 Volts monitor |  |
| +5 Volts monitor |  |
| _ROLL_ROT | 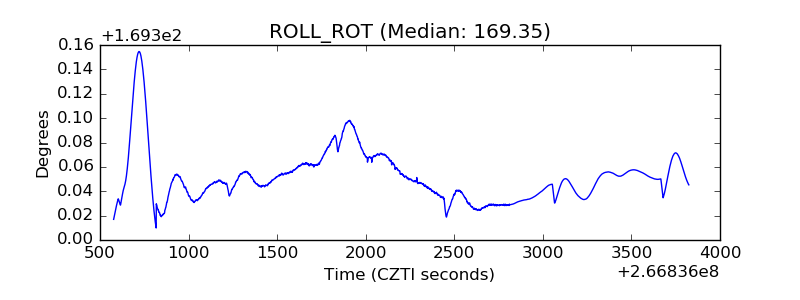 |
| _Roll_DEC | 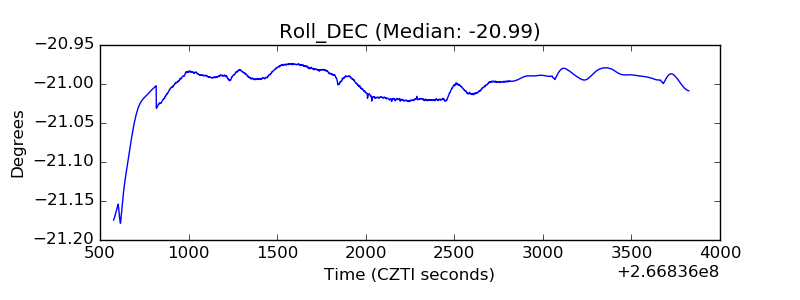 |
| _Roll_RA | 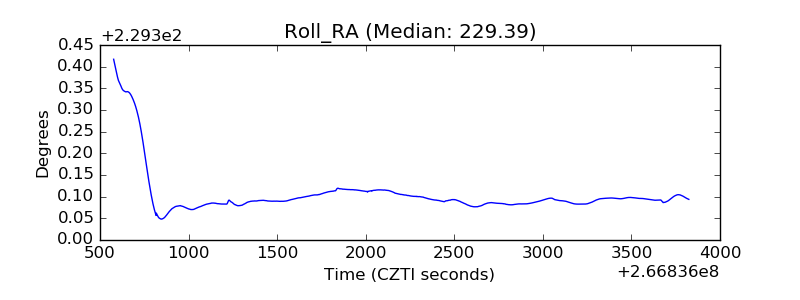 |
| Veto Counter | 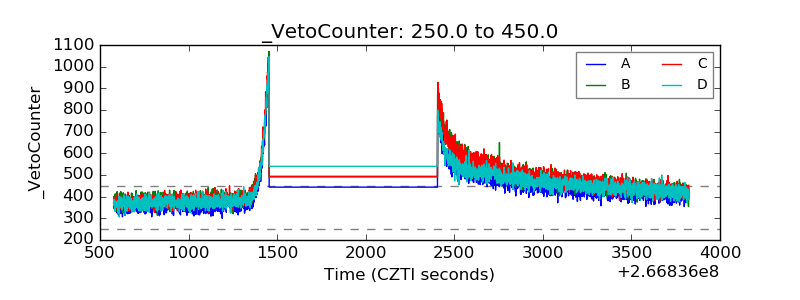 |