| Param | Original file | Final file |
|---|---|---|
| Filename | modeM0/AS1A04_011T07_9000002172_14689cztM0_level2.evt | modeM0/AS1A04_011T07_9000002172_14689cztM0_level2_quad_clean.evt |
| Size (bytes) | 498,173,760 | 99,192,960 |
| Size | 475.1 MB | 94.6 MB |
| Events in quadrant A | 3,599,178 | 651,834 |
| Events in quadrant B | 3,626,903 | 642,336 |
| Events in quadrant C | 4,007,518 | 631,031 |
| Events in quadrant D | 3,408,674 | 621,418 |
| Mode M0 | |||
|---|---|---|---|
| Quadrant | BADHDUFLAG | Total packets | Discarded packets |
| A | 0 | 14931 | 3 |
| B | 0 | 15083 | 2 |
| C | 0 | 16409 | 2 |
| D | 0 | 14379 | 2 |
| Mode M9 | |||
|---|---|---|---|
| Quadrant | BADHDUFLAG | Total packets | Discarded packets |
| A | 0 | 24 | 0 |
| B | 0 | 24 | 0 |
| C | 0 | 24 | 0 |
| D | 0 | 24 | 0 |
| Mode SS | |||
|---|---|---|---|
| Quadrant | BADHDUFLAG | Total packets | Discarded packets |
| A | 0 | 134 | 0 |
| B | 0 | 134 | 0 |
| C | 0 | 134 | 0 |
| D | 0 | 134 | 0 |
| Quadrant | Total seconds | Saturated seconds | Saturation percentage |
|---|---|---|---|
| A | 6564 | 85 | 1.294942% |
| B | 6564 | 90 | 1.371115% |
| C | 6564 | 82 | 1.249238% |
| D | 6564 | 78 | 1.188300% |
Noise dominated data is calculated using 1-second bins in cleaned event files. If a bin has >2000 counts, and if more than 50% of those come from <1% of pixels, then it is considered to be noise-dominated and hence unusable.
| Quadrant | # 1 sec bins | Bins with >0 counts | Bins with >2000 counts | High rate bins dominated by noise | Noise dominated (total time) | Noise dominated (detector-on time) | Marked lightcurve |
|---|---|---|---|---|---|---|---|
| A | 8920 | 6565 | 3 | 3 | 0.03% | 0.05% | 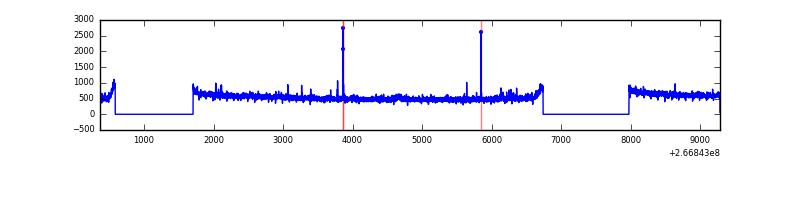 |
| B | 8920 | 6565 | 2 | 2 | 0.02% | 0.03% | 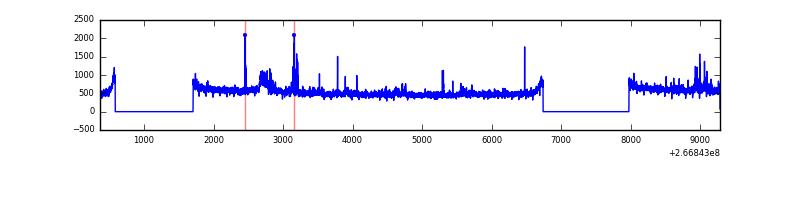 |
| C | 8920 | 6565 | 0 | 0 | 0.00% | 0.00% | 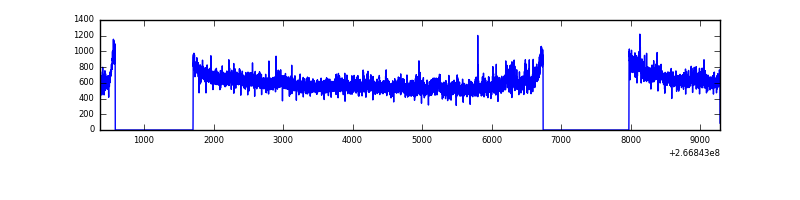 |
| D | 8920 | 6565 | 12 | 12 | 0.13% | 0.18% |  |
Top three noisy pixels from each quadrant. If the there are fewer than three noisy pixels in the level2.evt file, extra rows are filled as -1
| Pixel properties | Quadrant properties | ||||||
|---|---|---|---|---|---|---|---|
| Quadrant | DetID | PixID | Counts | Sigma | Mean | Median | Sigma |
| A | 8 | 15 | 103153 | 575.81 | 887 | 869 | 177.6 |
| A | 12 | 189 | 59471 | 329.9 | 887 | 869 | 177.6 |
| A | 3 | 1 | 19455 | 104.63 | 887 | 869 | 177.6 |
| B | 10 | 16 | 110117 | 663.97 | 868 | 848 | 164.6 |
| B | 4 | 80 | 65784 | 394.58 | 868 | 848 | 164.6 |
| B | 0 | 205 | 28170 | 166.02 | 868 | 848 | 164.6 |
| C | 3 | 233 | 706811 | 3627.14 | 846 | 853 | 194.6 |
| C | 13 | 61 | 6220 | 27.58 | 846 | 853 | 194.6 |
| C | 3 | 234 | 2895 | 10.49 | 846 | 853 | 194.6 |
| D | 12 | 110 | 78026 | 339.74 | 849 | 834 | 227.2 |
| D | 2 | 234 | 39309 | 169.34 | 849 | 834 | 227.2 |
| D | 2 | 120 | 25462 | 108.39 | 849 | 834 | 227.2 |
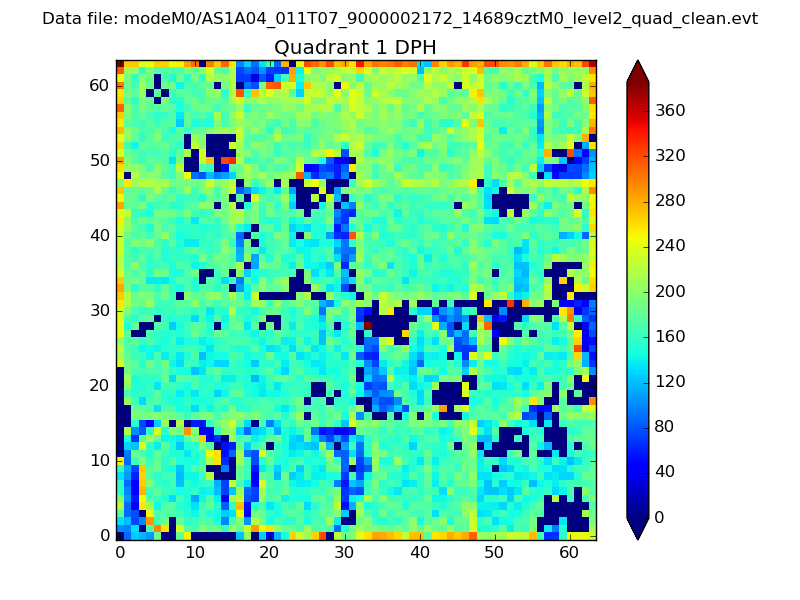
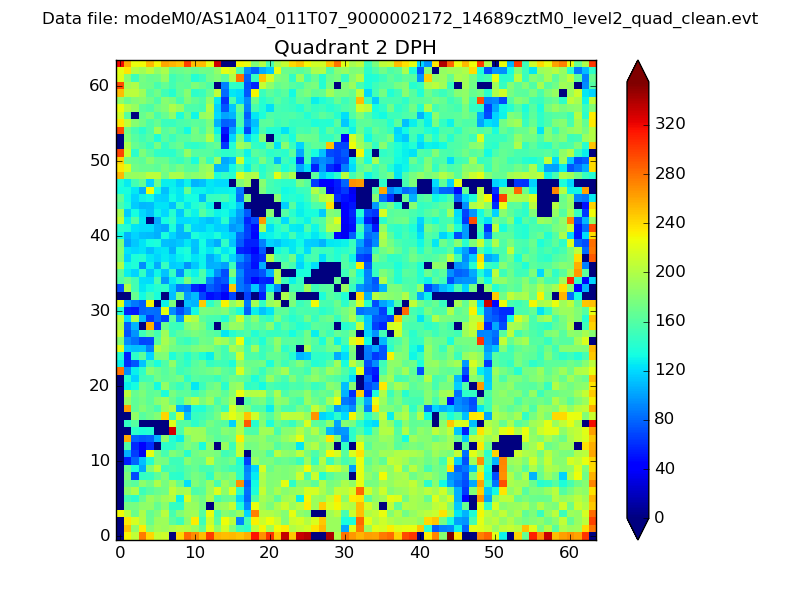
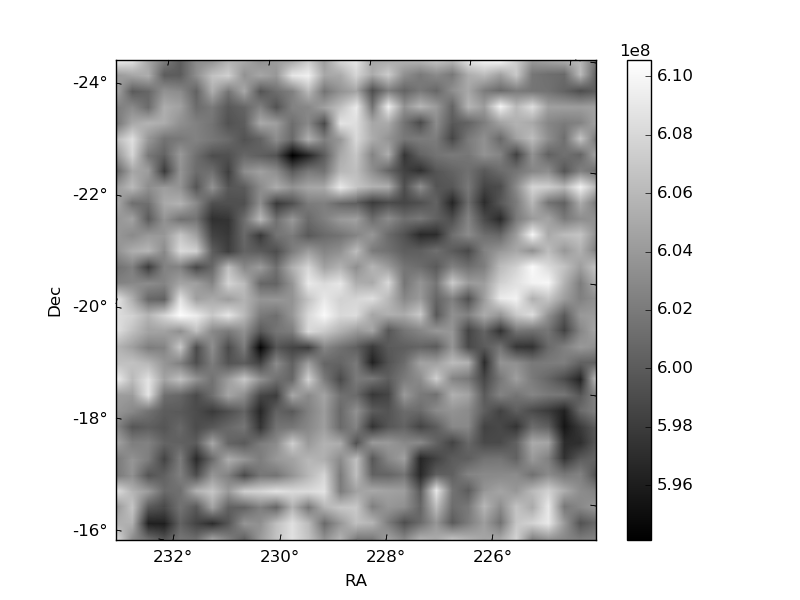
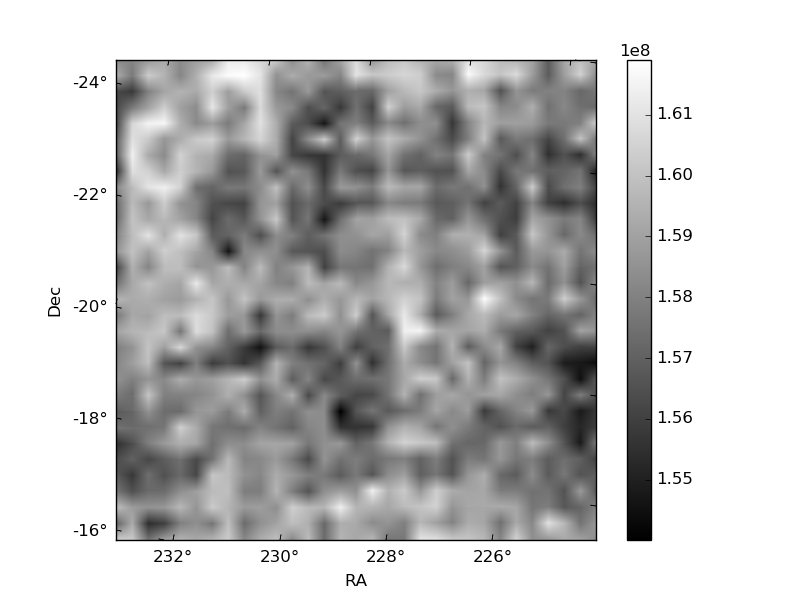
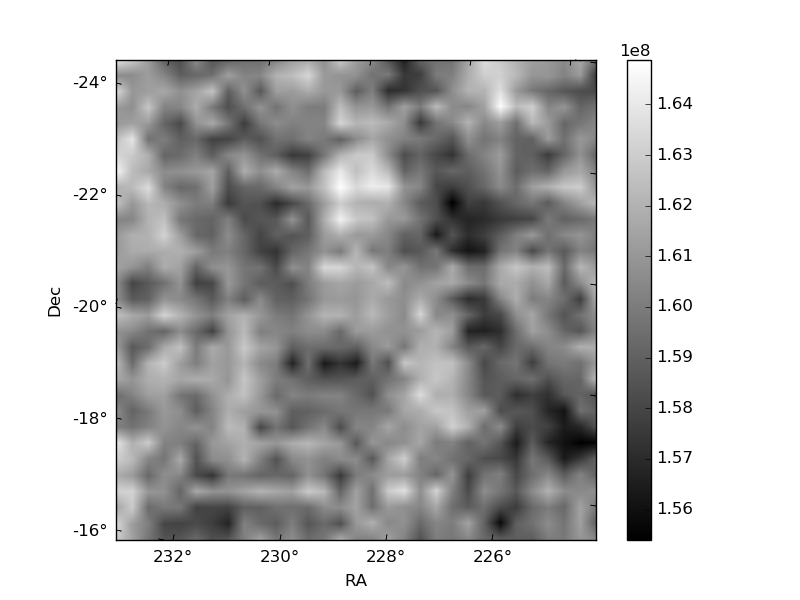
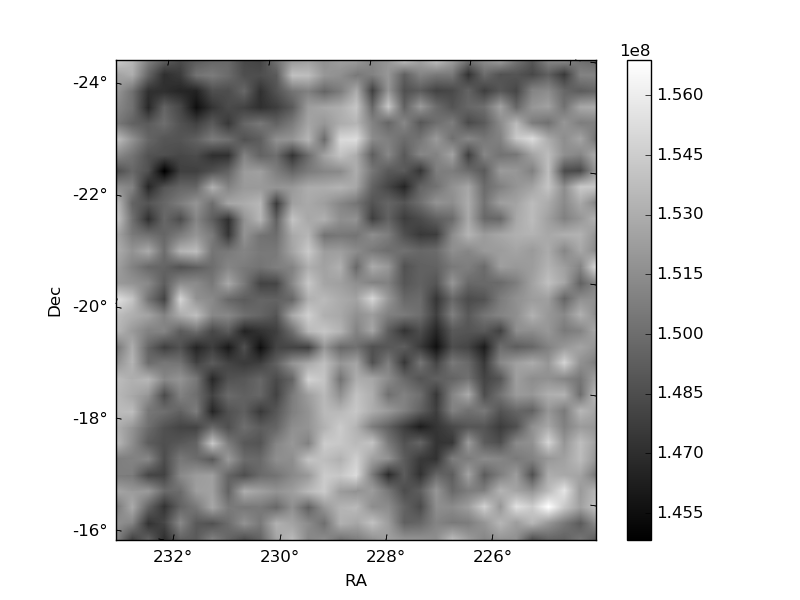
Histogram calculated using DETX and DETY for each event in the final _common_clean file
| Quadrant A | 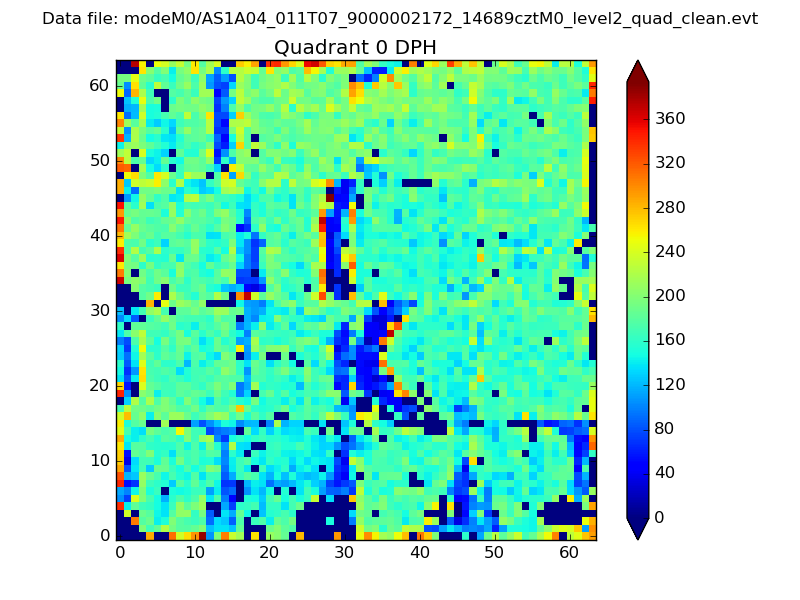 |
 |
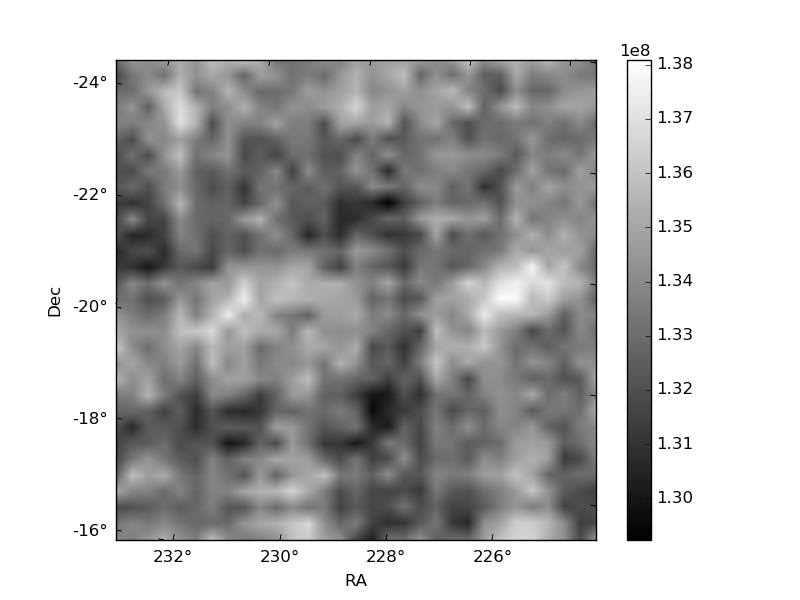
Quadrant B |
|---|---|---|---|
| Quadrant D | 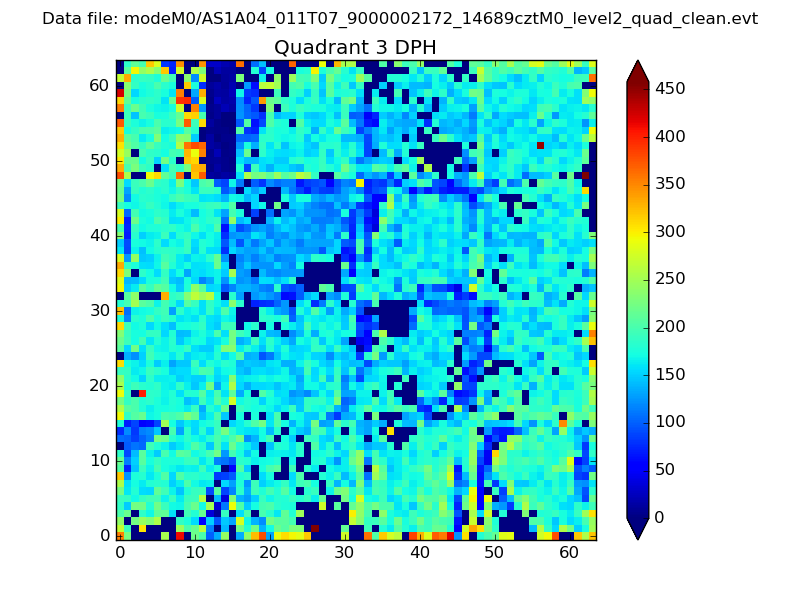 |
 |
Quadrant C |
| Plot type | Count rate plots | Images |
|---|---|---|
| Comparison with Poisson distribution Blue bars denote a histogram of data divided into 1 sec bins. Red curve is a Poisson curve with rate = median count rate of data. |
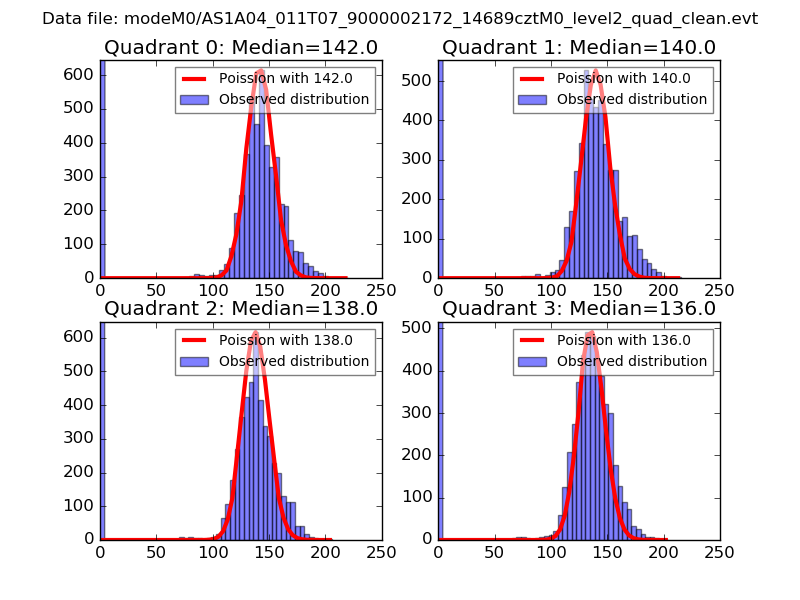 |
 |
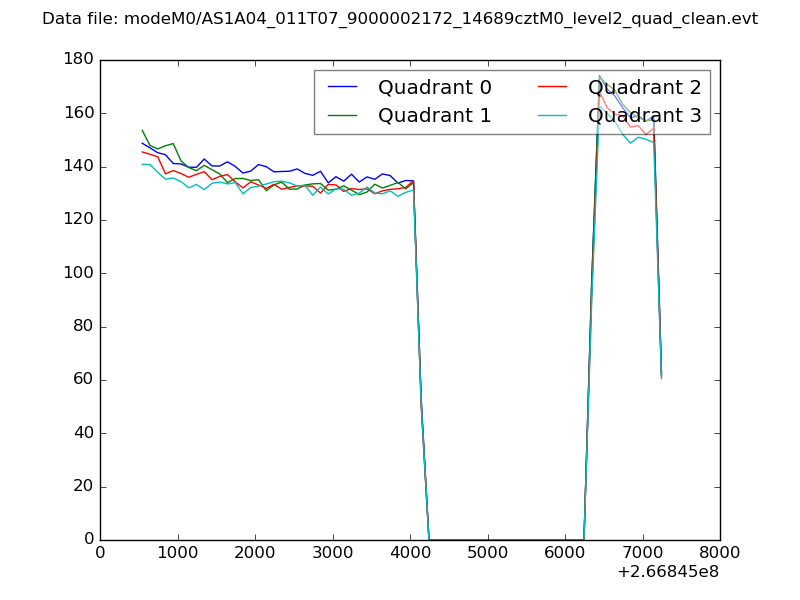
| Quadrant-wise count rates Data is divided into 100 sec bins |
 |
|
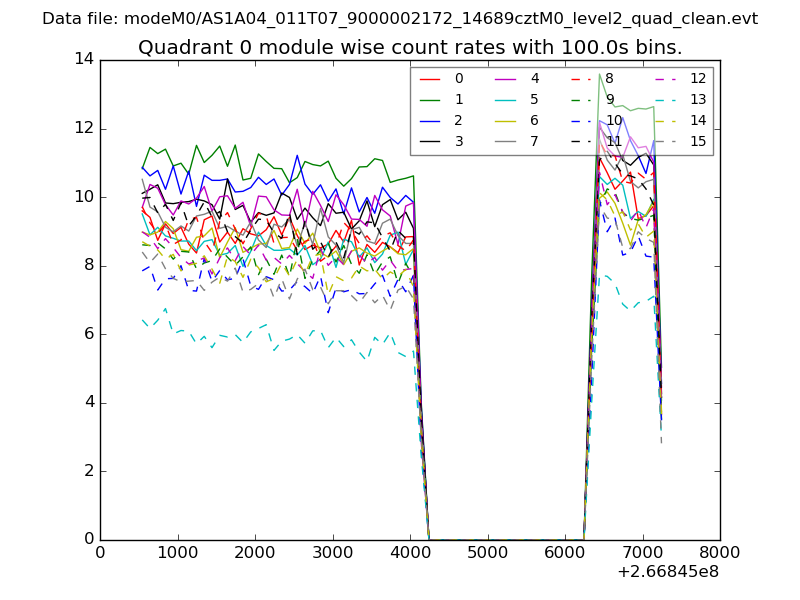
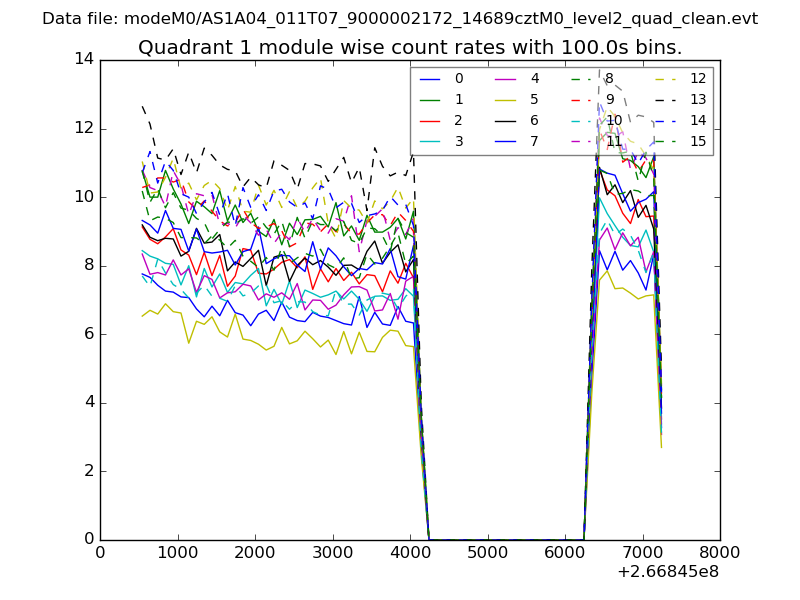
| Module-wise count rates for Quadrant A Data is divided into 100 sec bins |
 |
 |
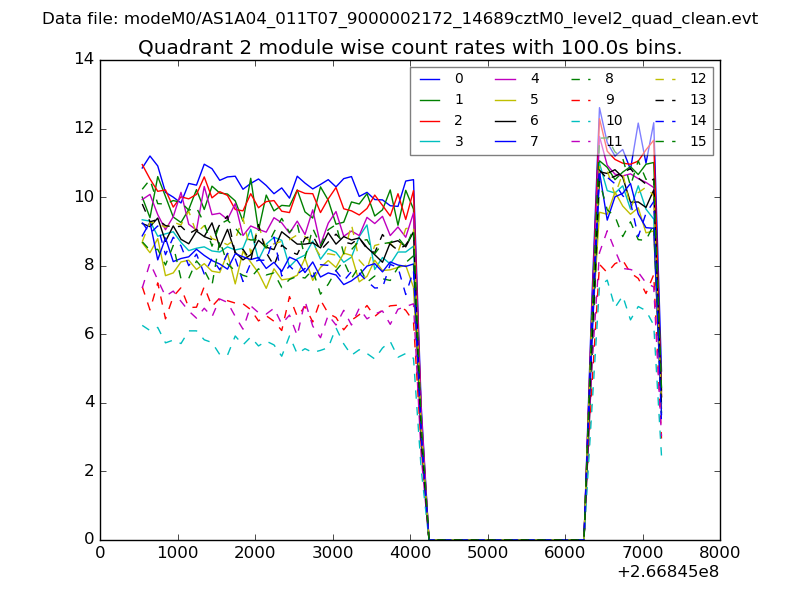
| Module-wise count rates for Quadrant B Data is divided into 100 sec bins |
 |
 |
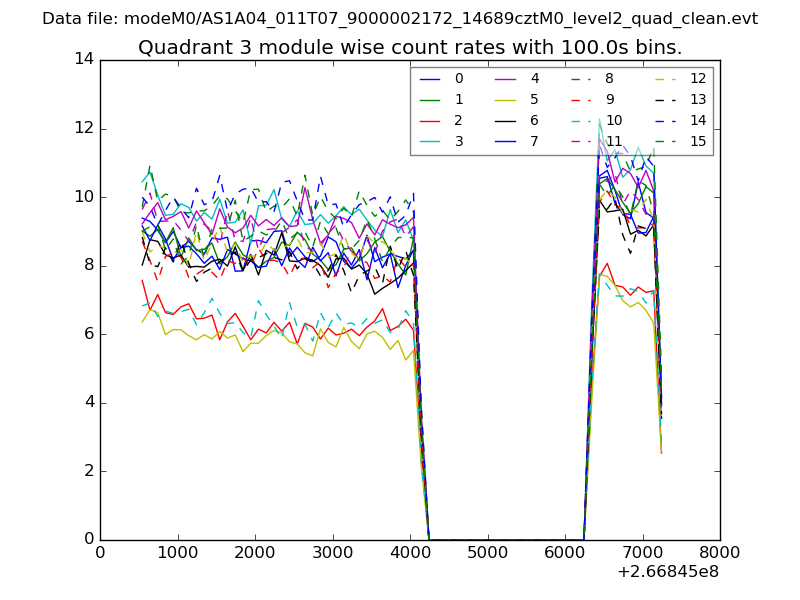
| Module-wise count rates for Quadrant C Data is divided into 100 sec bins |
 |
 |
| Module-wise count rates for Quadrant D Data is divided into 100 sec bins |
 |
 |
| Parameter | Plot |
|---|---|
| CZT HV Monitor | 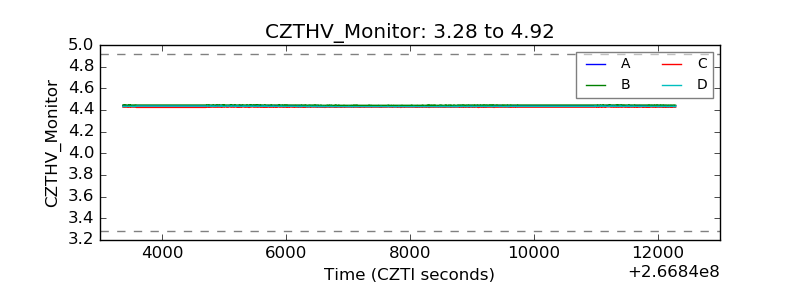 |
| D_VDD | 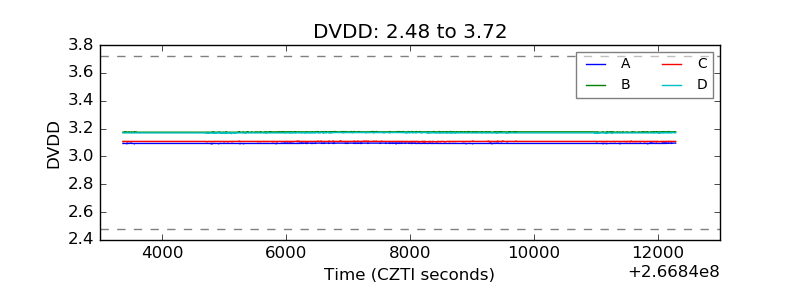 |
| Temperature 1 | 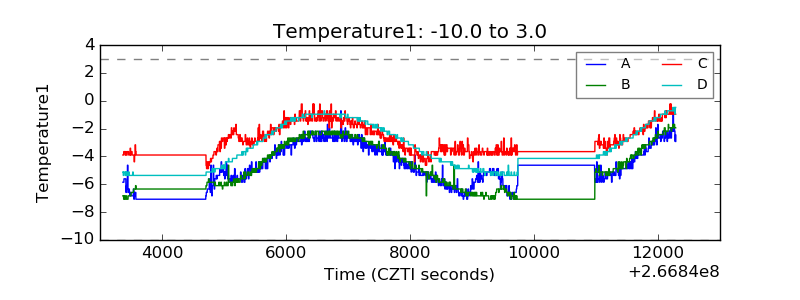 |
| Veto HV Monitor | 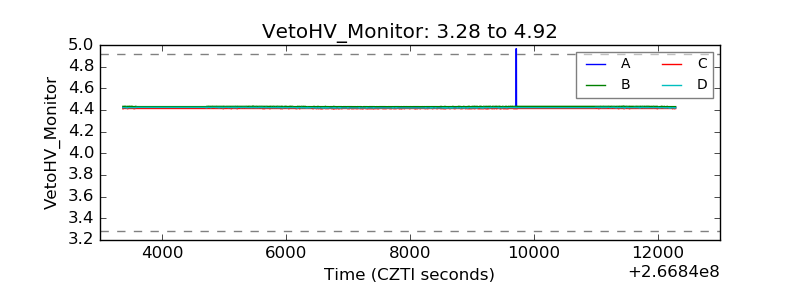 |
| Veto LLD | 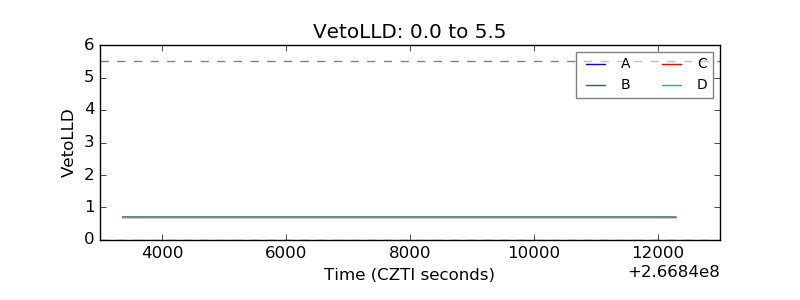 |
| Alpha Counter | 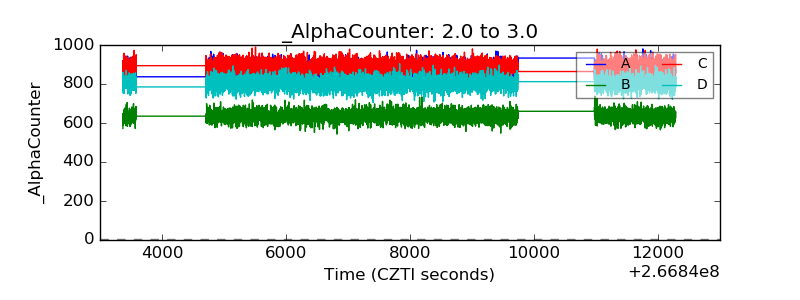 |
| _CPM_Rate | 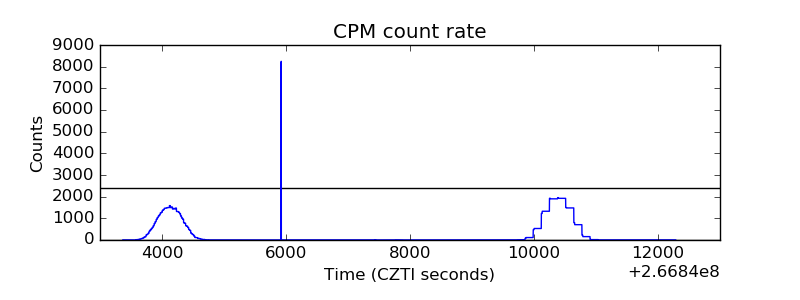 |
| CZT Counter | 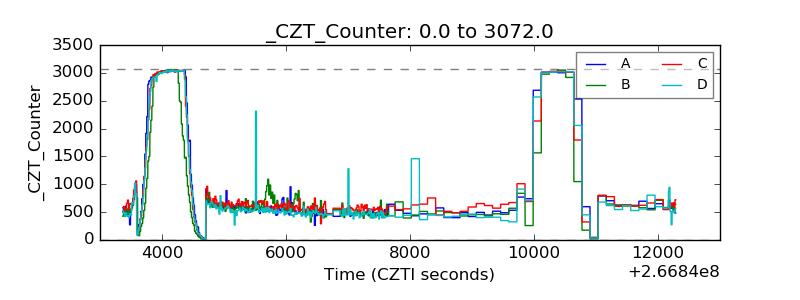 |
| +2.5 Volts monitor | 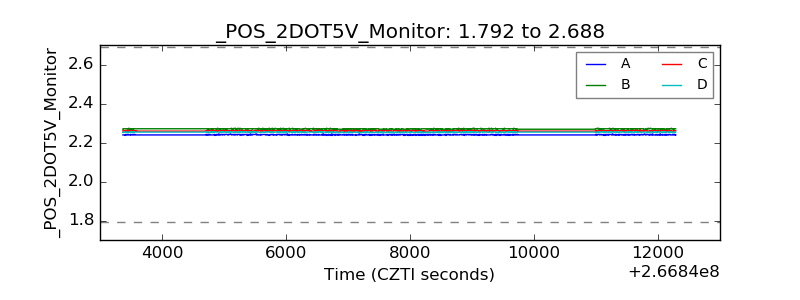 |
| +5 Volts monitor | 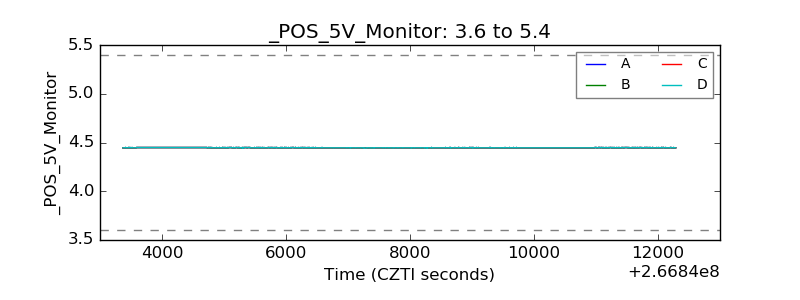 |
| _ROLL_ROT |  |
| _Roll_DEC | 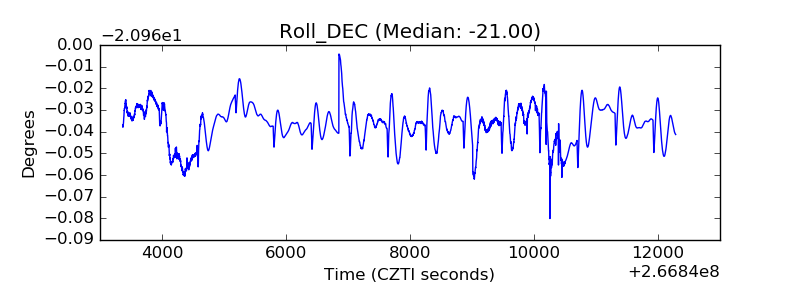 |
| _Roll_RA | 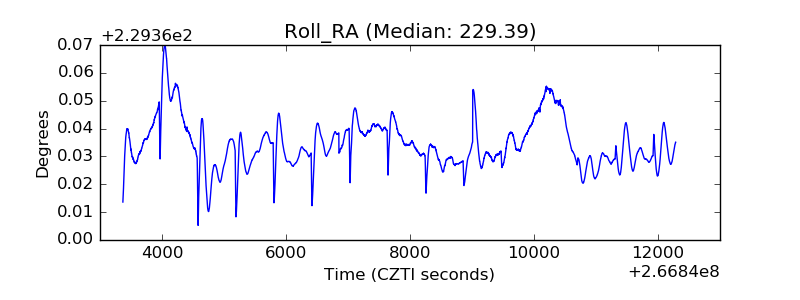 |
| Veto Counter | 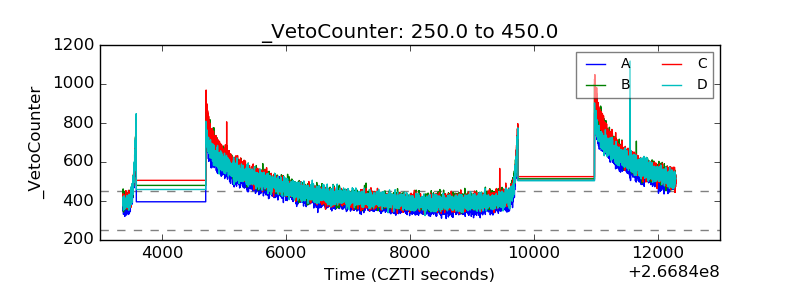 |