| Param | Original file | Final file |
|---|---|---|
| Filename | modeM0/AS1A04_011T07_9000002172_14691cztM0_level2.evt | modeM0/AS1A04_011T07_9000002172_14691cztM0_level2_quad_clean.evt |
| Size (bytes) | 513,673,920 | 118,667,520 |
| Size | 489.9 MB | 113.2 MB |
| Events in quadrant A | 3,698,940 | 811,704 |
| Events in quadrant B | 3,485,080 | 796,831 |
| Events in quadrant C | 4,406,149 | 770,530 |
| Events in quadrant D | 3,533,962 | 769,974 |
| Mode M0 | |||
|---|---|---|---|
| Quadrant | BADHDUFLAG | Total packets | Discarded packets |
| A | 0 | 15213 | 3 |
| B | 0 | 14424 | 2 |
| C | 0 | 18069 | 2 |
| D | 0 | 14581 | 2 |
| Mode M9 | |||
|---|---|---|---|
| Quadrant | BADHDUFLAG | Total packets | Discarded packets |
| A | 0 | 15 | 0 |
| B | 0 | 15 | 0 |
| C | 0 | 15 | 0 |
| D | 0 | 16 | 0 |
| Mode SS | |||
|---|---|---|---|
| Quadrant | BADHDUFLAG | Total packets | Discarded packets |
| A | 0 | 130 | 0 |
| B | 0 | 130 | 0 |
| C | 0 | 130 | 0 |
| D | 0 | 130 | 0 |
| Quadrant | Total seconds | Saturated seconds | Saturation percentage |
|---|---|---|---|
| A | 6380 | 101 | 1.583072% |
| B | 6380 | 96 | 1.504702% |
| C | 6380 | 96 | 1.504702% |
| D | 6380 | 95 | 1.489028% |
Noise dominated data is calculated using 1-second bins in cleaned event files. If a bin has >2000 counts, and if more than 50% of those come from <1% of pixels, then it is considered to be noise-dominated and hence unusable.
| Quadrant | # 1 sec bins | Bins with >0 counts | Bins with >2000 counts | High rate bins dominated by noise | Noise dominated (total time) | Noise dominated (detector-on time) | Marked lightcurve |
|---|---|---|---|---|---|---|---|
| A | 7701 | 6381 | 0 | 0 | 0.00% | 0.00% | 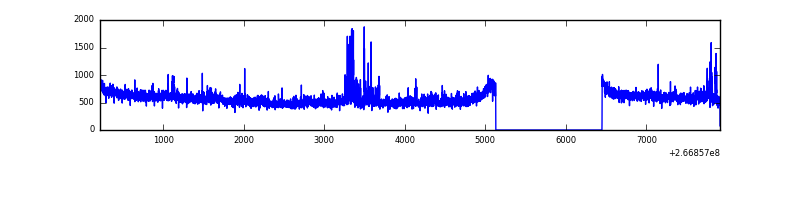 |
| B | 7701 | 6381 | 4 | 4 | 0.05% | 0.06% | 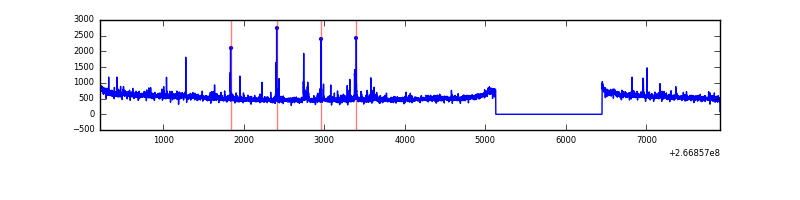 |
| C | 7701 | 6381 | 3 | 3 | 0.04% | 0.05% | 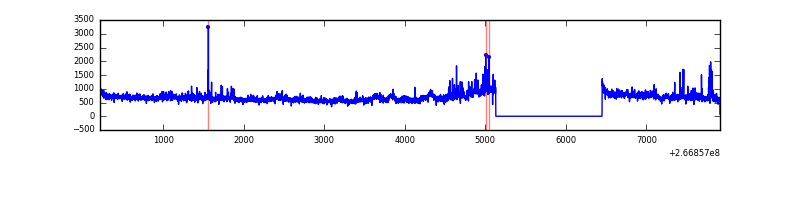 |
| D | 7701 | 6381 | 32 | 32 | 0.42% | 0.50% | 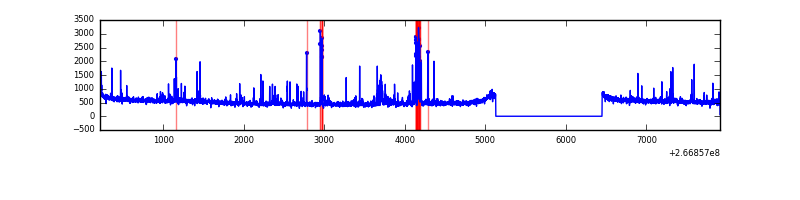 |
Top three noisy pixels from each quadrant. If the there are fewer than three noisy pixels in the level2.evt file, extra rows are filled as -1
| Pixel properties | Quadrant properties | ||||||
|---|---|---|---|---|---|---|---|
| Quadrant | DetID | PixID | Counts | Sigma | Mean | Median | Sigma |
| A | 3 | 1 | 100578 | 564.58 | 880 | 865 | 176.6 |
| A | 12 | 189 | 79058 | 442.73 | 880 | 865 | 176.6 |
| A | 1 | 162 | 52517 | 292.45 | 880 | 865 | 176.6 |
| B | 10 | 16 | 42554 | 260.83 | 855 | 837 | 159.9 |
| B | 0 | 205 | 36407 | 222.4 | 855 | 837 | 159.9 |
| B | 0 | 214 | 24504 | 147.98 | 855 | 837 | 159.9 |
| C | 3 | 233 | 1145884 | 6067.77 | 824 | 829 | 188.7 |
| C | 0 | 207 | 36928 | 191.29 | 824 | 829 | 188.7 |
| C | 3 | 234 | 9789 | 47.48 | 824 | 829 | 188.7 |
| D | 9 | 1 | 138557 | 629.56 | 843 | 823 | 218.8 |
| D | 10 | 199 | 63749 | 287.62 | 843 | 823 | 218.8 |
| D | 13 | 172 | 42111 | 188.72 | 843 | 823 | 218.8 |
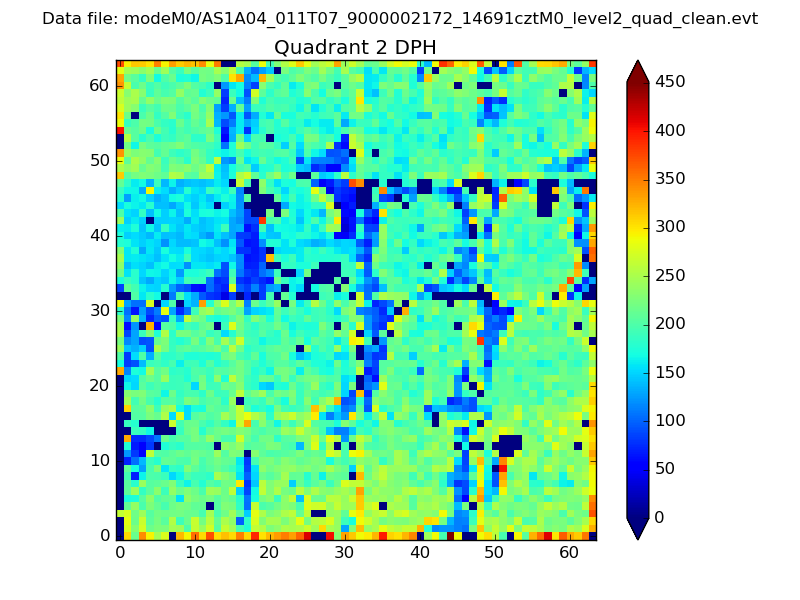
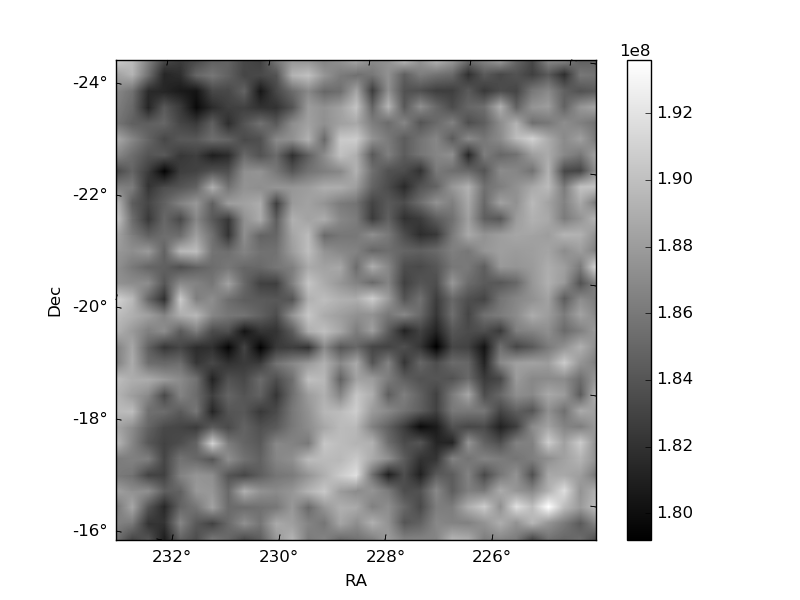
Histogram calculated using DETX and DETY for each event in the final _common_clean file
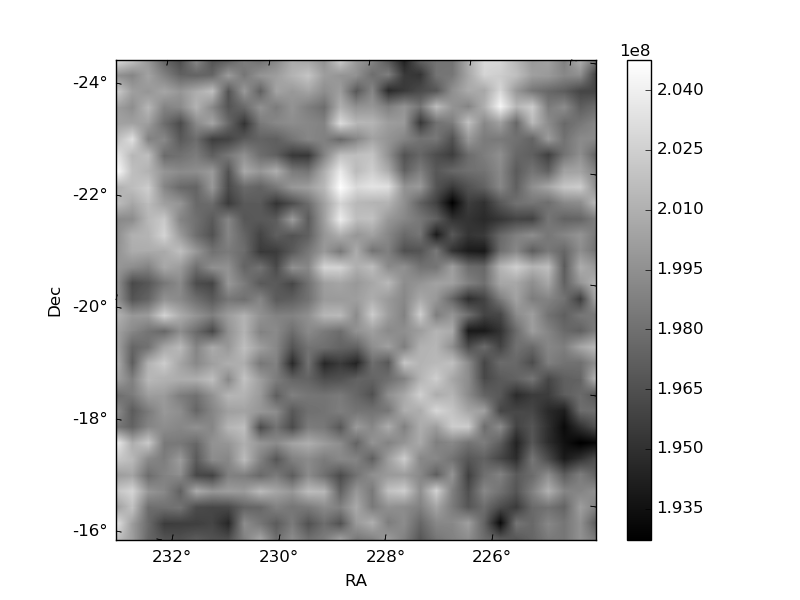
| Quadrant A | 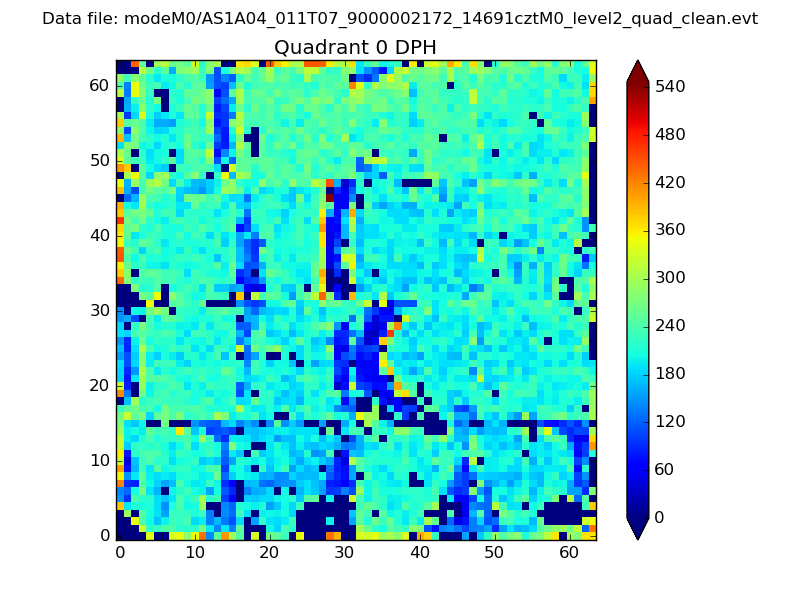 |
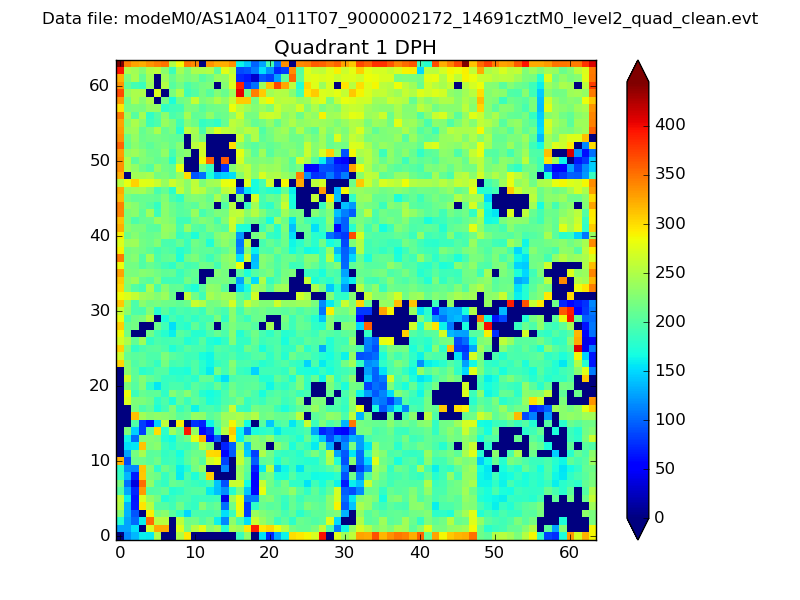 |
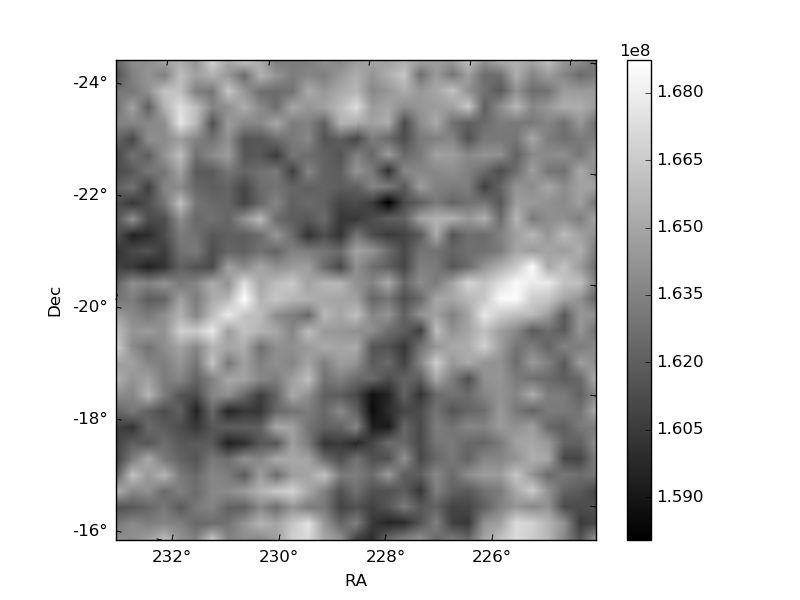
Quadrant B |
|---|---|---|---|
| Quadrant D | 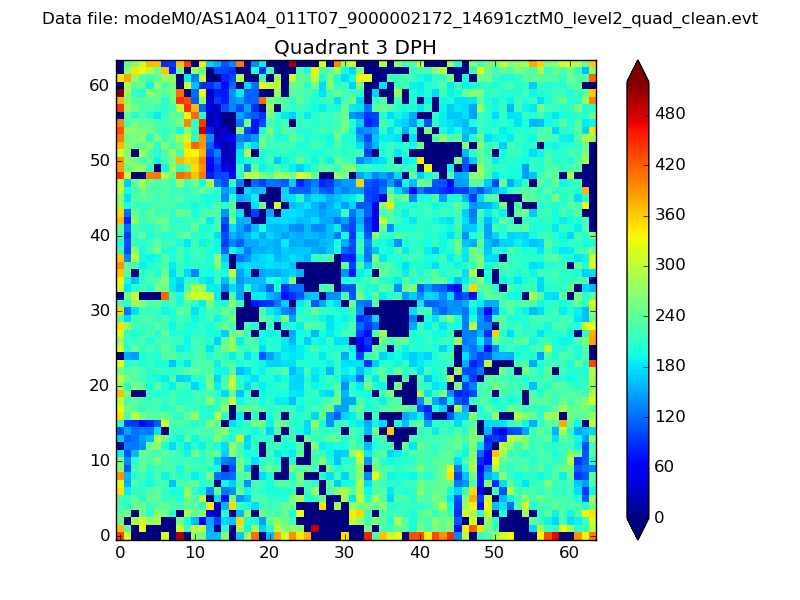 |
 |
Quadrant C |
| Plot type | Count rate plots | Images |
|---|---|---|
| Comparison with Poisson distribution Blue bars denote a histogram of data divided into 1 sec bins. Red curve is a Poisson curve with rate = median count rate of data. |
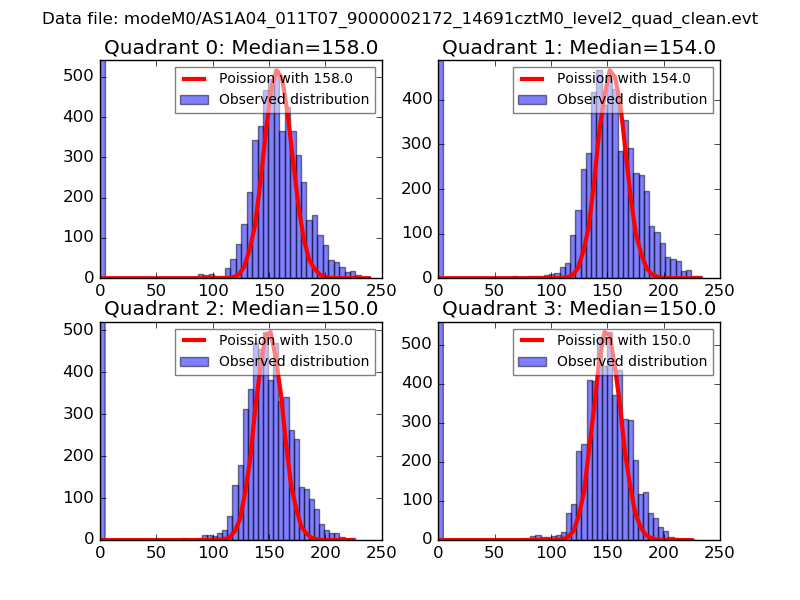 |
 |
| Quadrant-wise count rates Data is divided into 100 sec bins |
 |
|
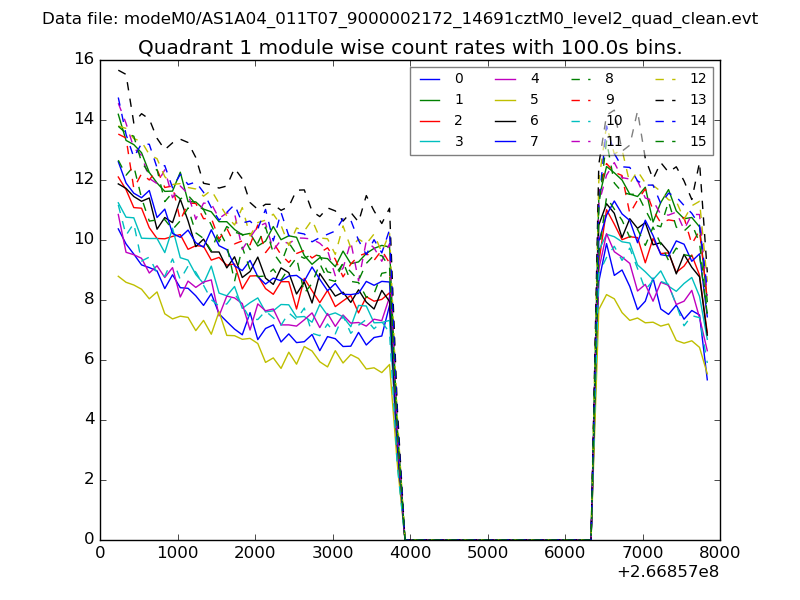
| Module-wise count rates for Quadrant A Data is divided into 100 sec bins |
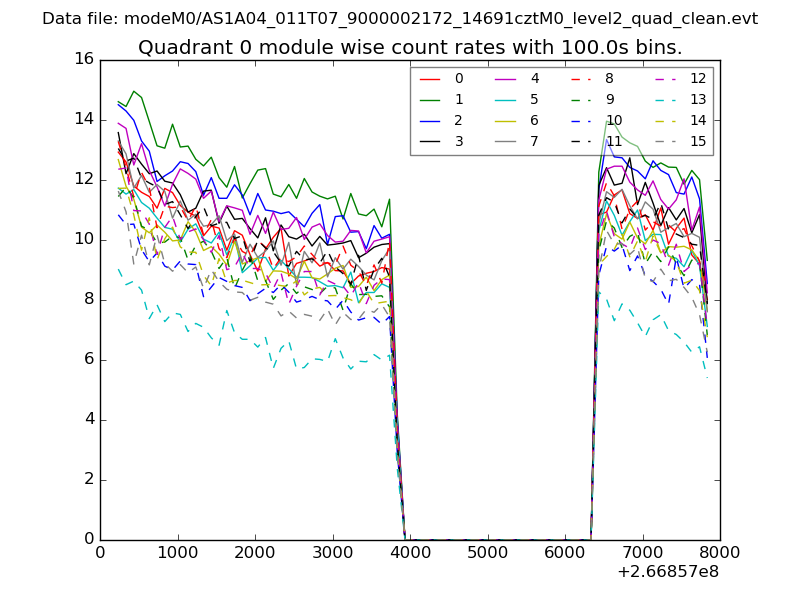 |
 |
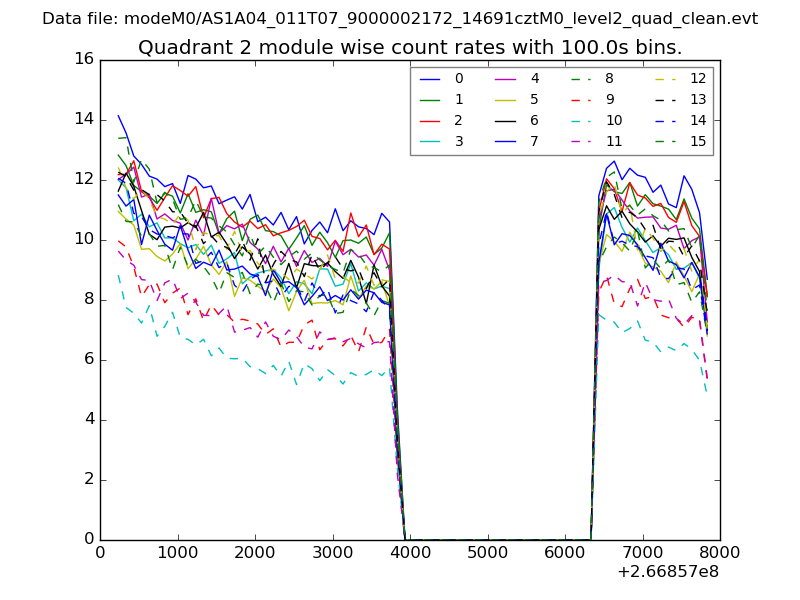
| Module-wise count rates for Quadrant B Data is divided into 100 sec bins |
 |
 |
| Module-wise count rates for Quadrant C Data is divided into 100 sec bins |
 |
 |
| Module-wise count rates for Quadrant D Data is divided into 100 sec bins |
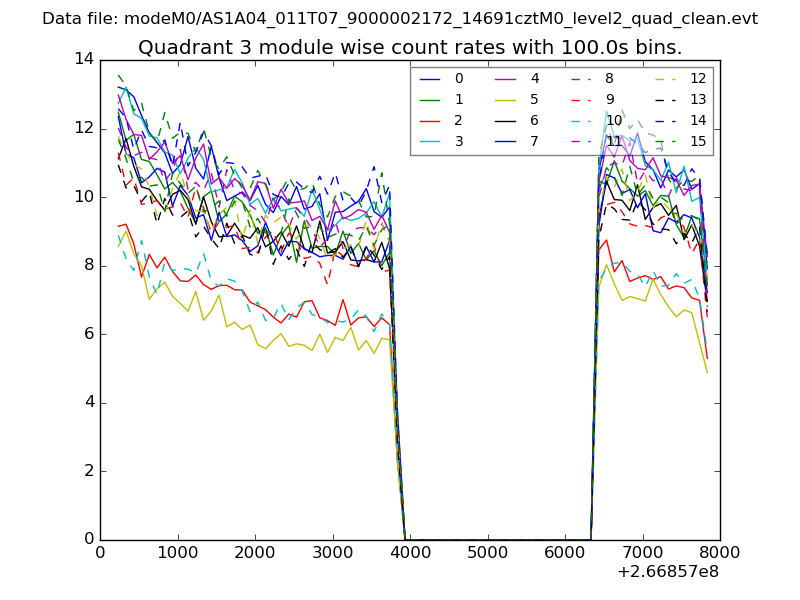 |
 |
| Parameter | Plot |
|---|---|
| CZT HV Monitor | 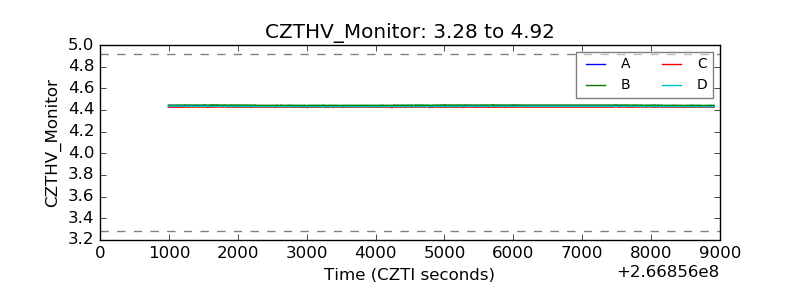 |
| D_VDD | 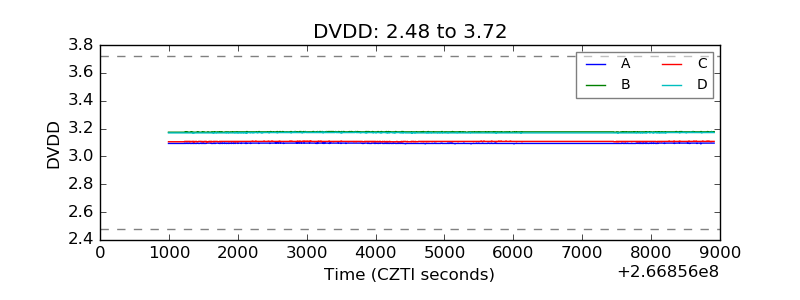 |
| Temperature 1 |  |
| Veto HV Monitor | 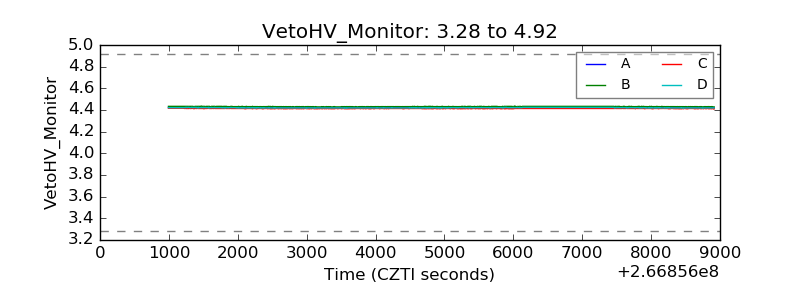 |
| Veto LLD | 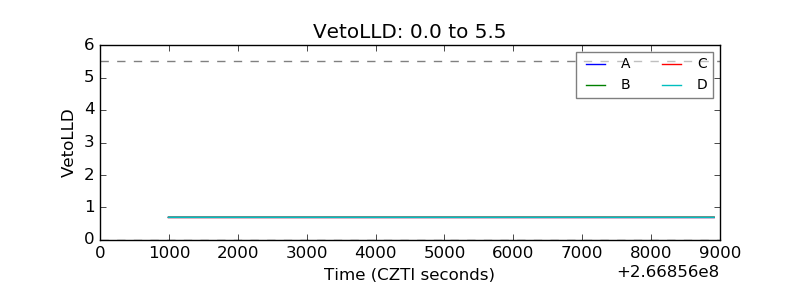 |
| Alpha Counter | 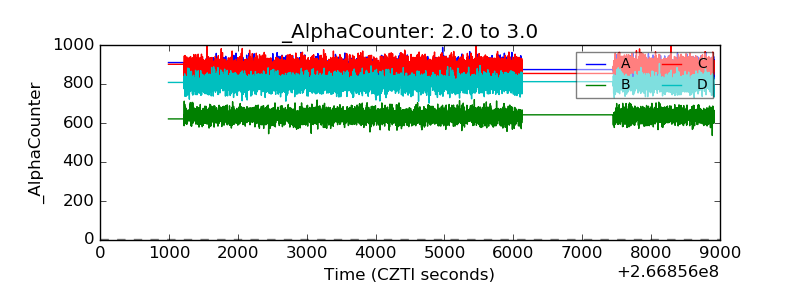 |
| _CPM_Rate | 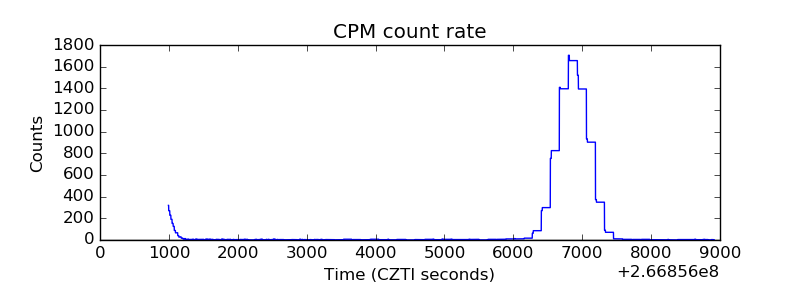 |
| CZT Counter |  |
| +2.5 Volts monitor |  |
| +5 Volts monitor |  |
| _ROLL_ROT | 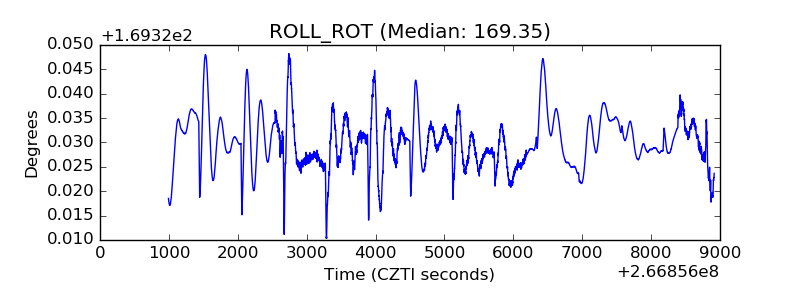 |
| _Roll_DEC | 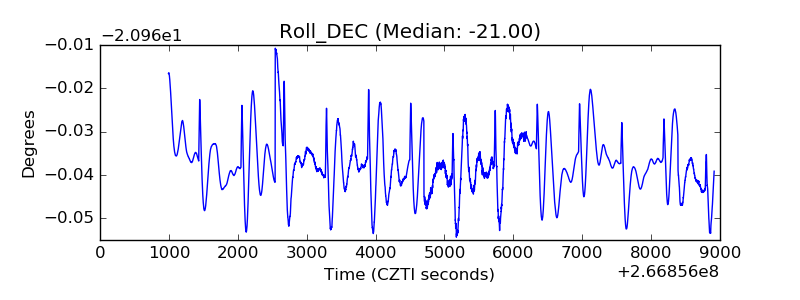 |
| _Roll_RA | 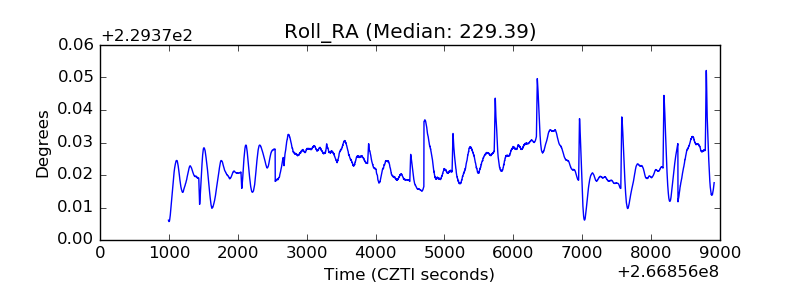 |
| Veto Counter | 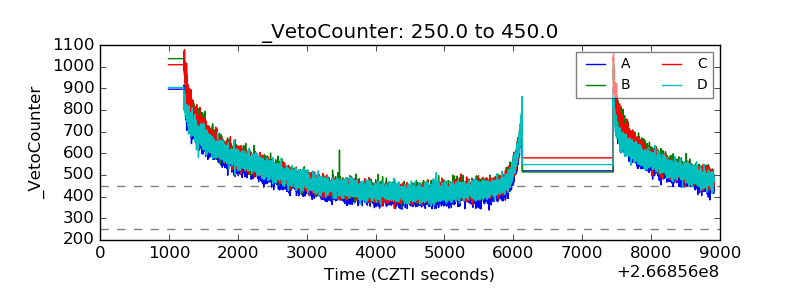 |