| Param | Original file | Final file |
|---|---|---|
| Filename | modeM0/AS1A04_011T07_9000002172_14692cztM0_level2.evt | modeM0/AS1A04_011T07_9000002172_14692cztM0_level2_quad_clean.evt |
| Size (bytes) | 477,875,520 | 99,904,320 |
| Size | 455.7 MB | 95.3 MB |
| Events in quadrant A | 3,528,074 | 668,163 |
| Events in quadrant B | 3,254,865 | 654,949 |
| Events in quadrant C | 4,174,318 | 636,594 |
| Events in quadrant D | 3,097,038 | 635,498 |
| Mode M0 | |||
|---|---|---|---|
| Quadrant | BADHDUFLAG | Total packets | Discarded packets |
| A | 0 | 14486 | 2 |
| B | 0 | 13542 | 1 |
| C | 0 | 16673 | 1 |
| D | 0 | 13212 | 1 |
| Mode M9 | |||
|---|---|---|---|
| Quadrant | BADHDUFLAG | Total packets | Discarded packets |
| A | 0 | 12 | 0 |
| B | 0 | 12 | 0 |
| C | 0 | 12 | 0 |
| D | 0 | 12 | 0 |
| Mode SS | |||
|---|---|---|---|
| Quadrant | BADHDUFLAG | Total packets | Discarded packets |
| A | 0 | 126 | 0 |
| B | 0 | 126 | 0 |
| C | 0 | 126 | 0 |
| D | 0 | 126 | 0 |
| Quadrant | Total seconds | Saturated seconds | Saturation percentage |
|---|---|---|---|
| A | 6163 | 108 | 1.752393% |
| B | 6163 | 94 | 1.525231% |
| C | 6163 | 95 | 1.541457% |
| D | 6163 | 73 | 1.184488% |
Noise dominated data is calculated using 1-second bins in cleaned event files. If a bin has >2000 counts, and if more than 50% of those come from <1% of pixels, then it is considered to be noise-dominated and hence unusable.
| Quadrant | # 1 sec bins | Bins with >0 counts | Bins with >2000 counts | High rate bins dominated by noise | Noise dominated (total time) | Noise dominated (detector-on time) | Marked lightcurve |
|---|---|---|---|---|---|---|---|
| A | 7429 | 6164 | 0 | 0 | 0.00% | 0.00% | 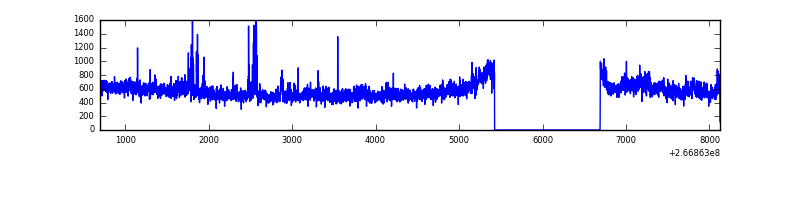 |
| B | 7429 | 6164 | 1 | 1 | 0.01% | 0.02% | 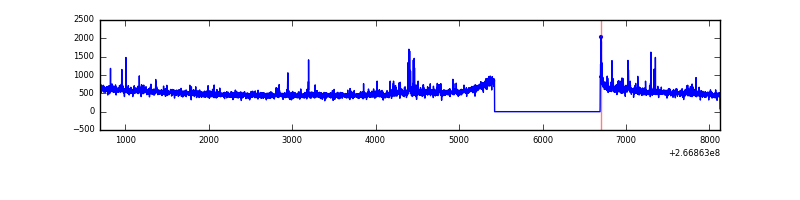 |
| C | 7429 | 6164 | 8 | 8 | 0.11% | 0.13% | 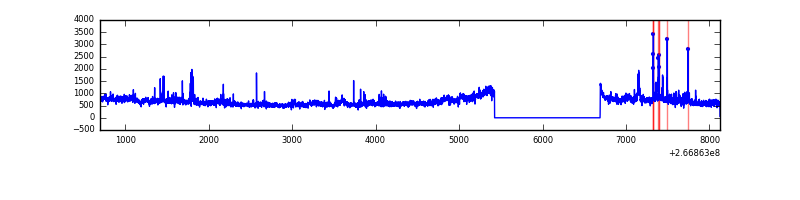 |
| D | 7429 | 6164 | 12 | 12 | 0.16% | 0.19% | 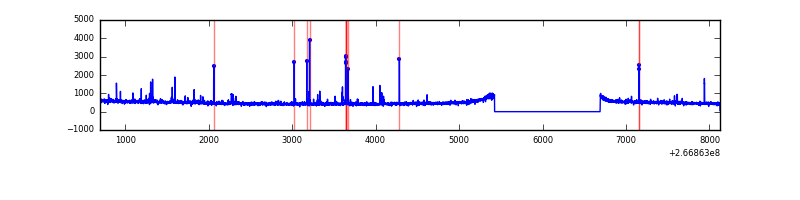 |
Top three noisy pixels from each quadrant. If the there are fewer than three noisy pixels in the level2.evt file, extra rows are filled as -1
| Pixel properties | Quadrant properties | ||||||
|---|---|---|---|---|---|---|---|
| Quadrant | DetID | PixID | Counts | Sigma | Mean | Median | Sigma |
| A | 8 | 15 | 214308 | 1319.69 | 811 | 797 | 161.8 |
| A | 3 | 1 | 65687 | 401.08 | 811 | 797 | 161.8 |
| A | 1 | 162 | 47481 | 288.55 | 811 | 797 | 161.8 |
| B | 10 | 16 | 90803 | 606.25 | 792 | 778 | 148.5 |
| B | 0 | 205 | 18867 | 121.81 | 792 | 778 | 148.5 |
| B | 12 | 111 | 16662 | 106.97 | 792 | 778 | 148.5 |
| C | 3 | 233 | 1087173 | 6184.2 | 763 | 769 | 175.7 |
| C | 0 | 207 | 109677 | 619.94 | 763 | 769 | 175.7 |
| C | 13 | 61 | 5637 | 27.71 | 763 | 769 | 175.7 |
| D | 10 | 199 | 36759 | 172.67 | 775 | 760 | 208.5 |
| D | 2 | 234 | 30514 | 142.71 | 775 | 760 | 208.5 |
| D | 2 | 120 | 27597 | 128.72 | 775 | 760 | 208.5 |
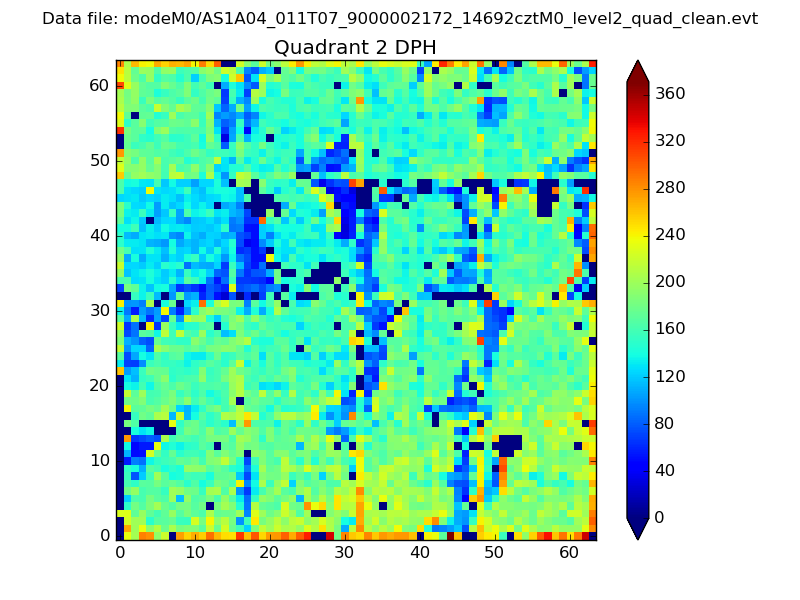
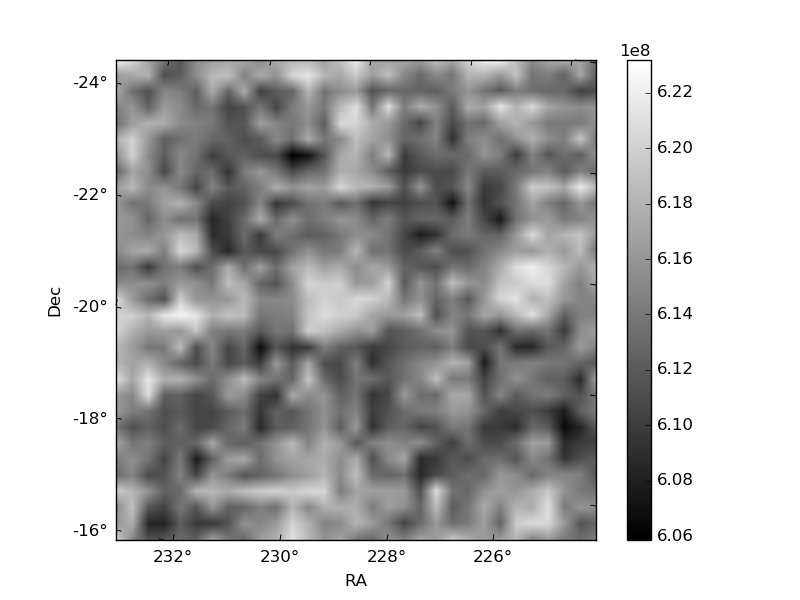
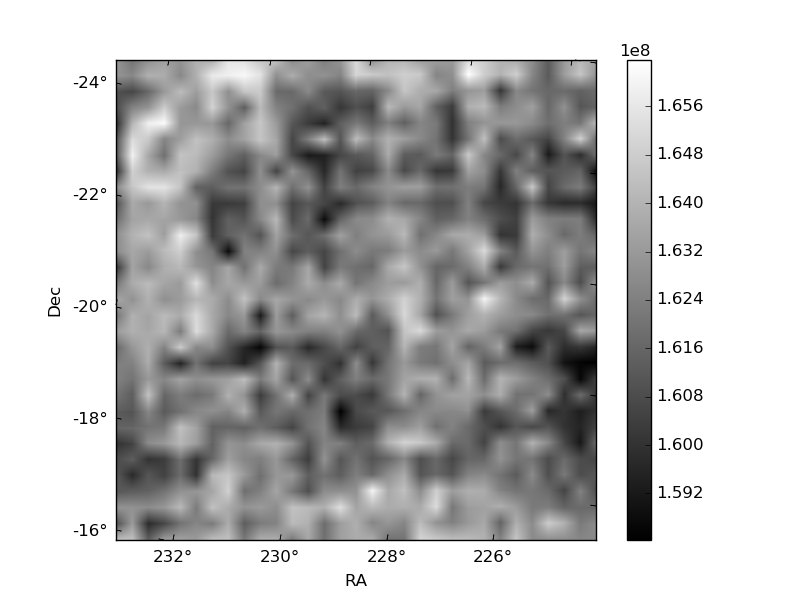
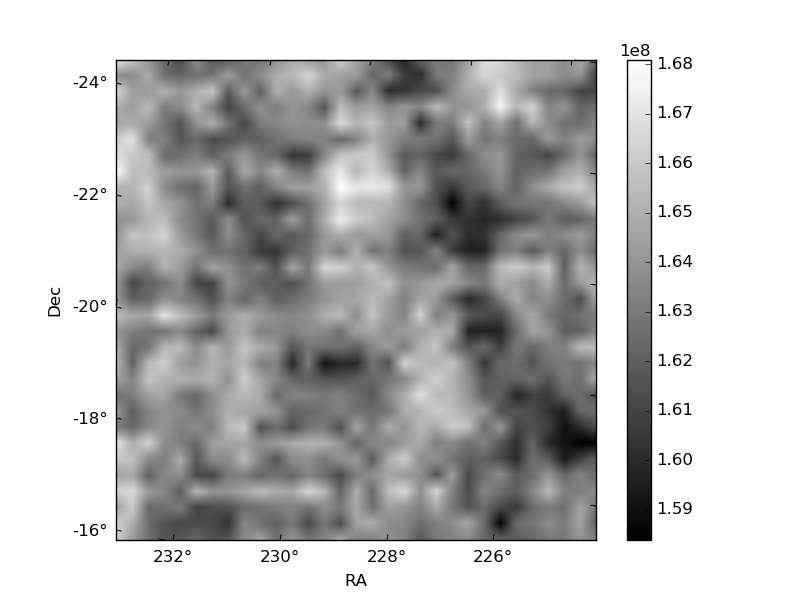
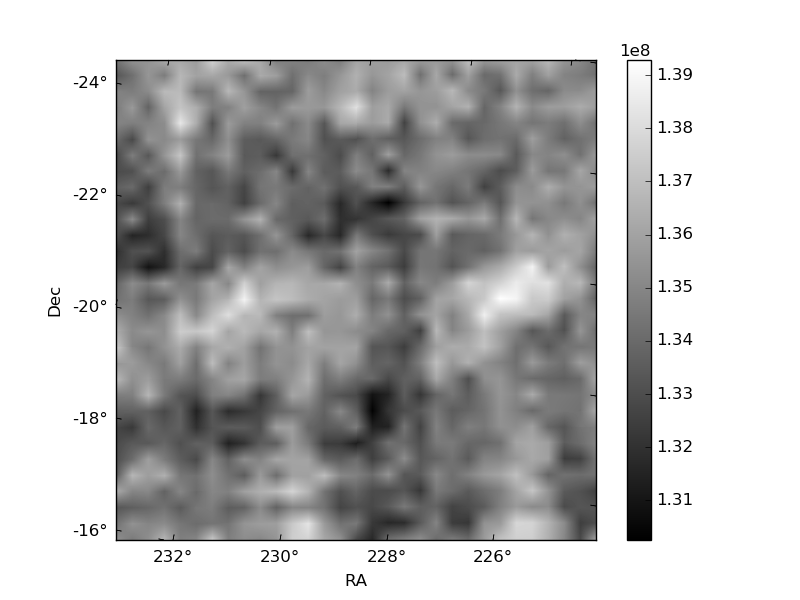
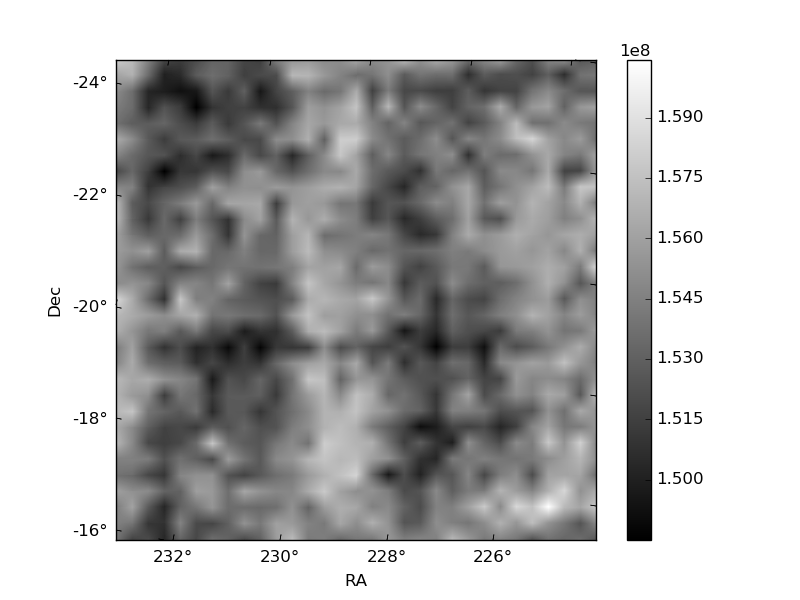
Histogram calculated using DETX and DETY for each event in the final _common_clean file
| Quadrant A | 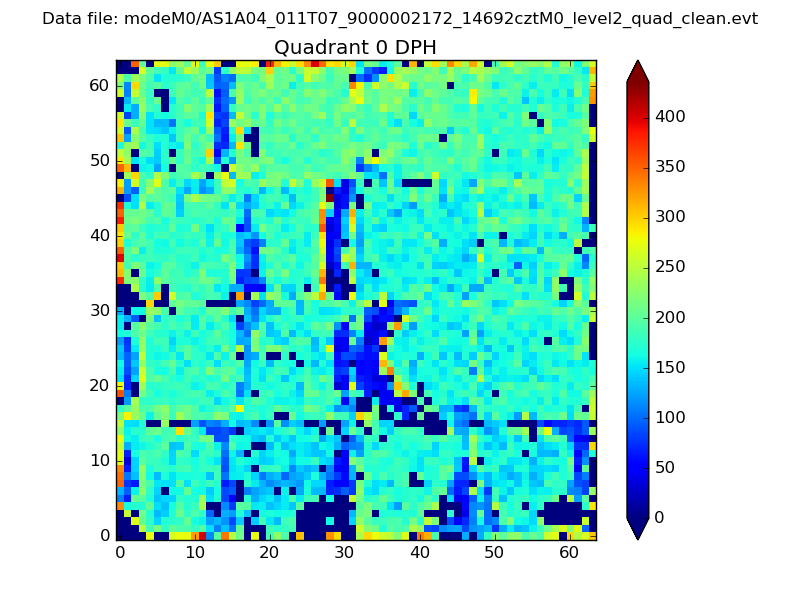 |
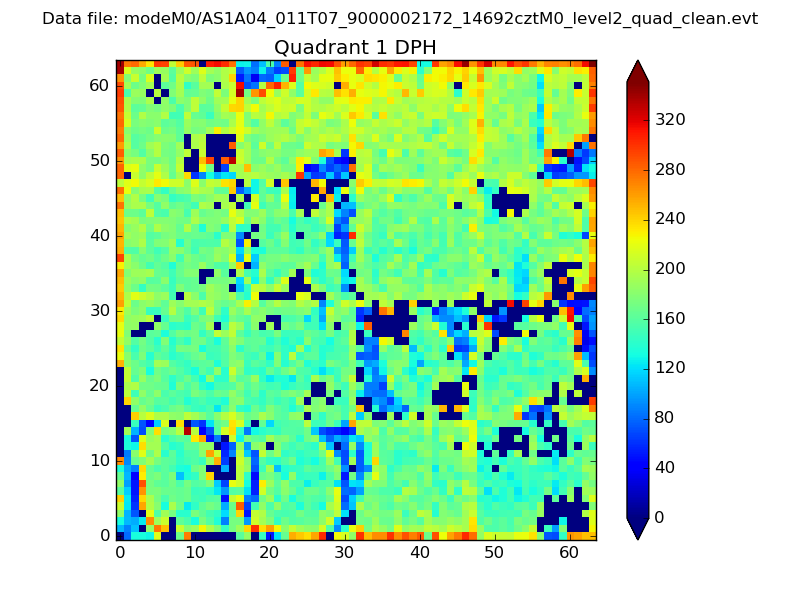 |
Quadrant B |
|---|---|---|---|
| Quadrant D | 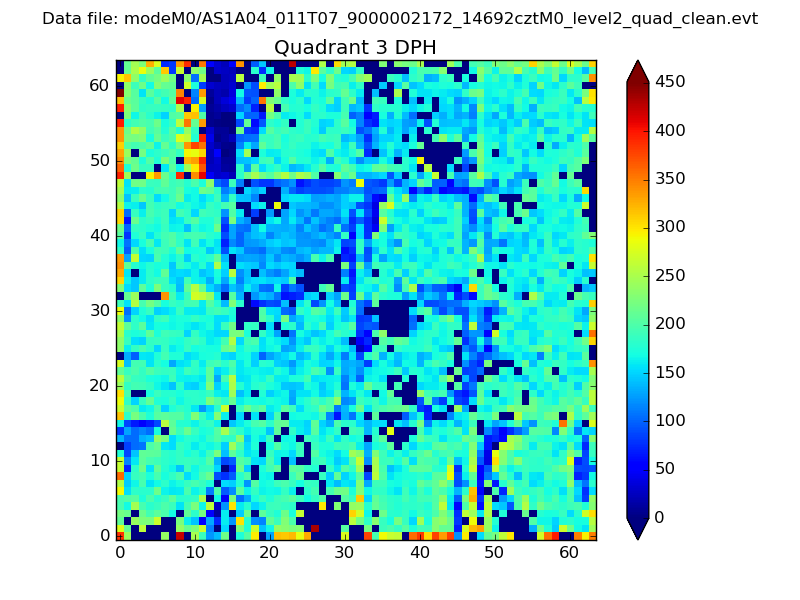 |
 |
Quadrant C |
| Plot type | Count rate plots | Images |
|---|---|---|
| Comparison with Poisson distribution Blue bars denote a histogram of data divided into 1 sec bins. Red curve is a Poisson curve with rate = median count rate of data. |
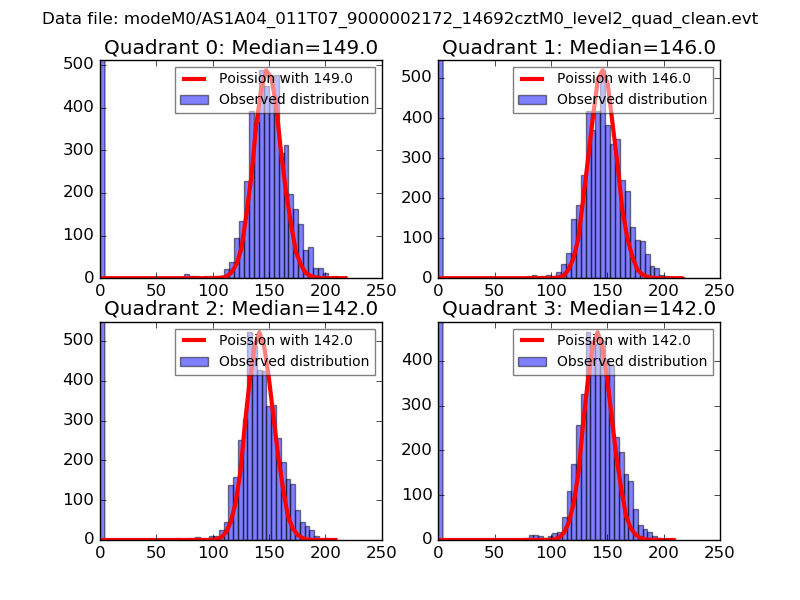 |
 |
| Quadrant-wise count rates Data is divided into 100 sec bins |
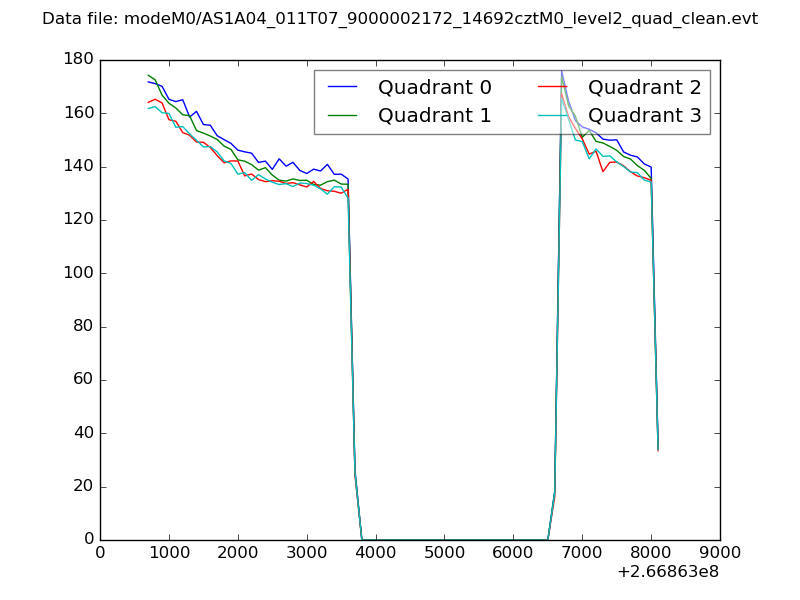 |
|
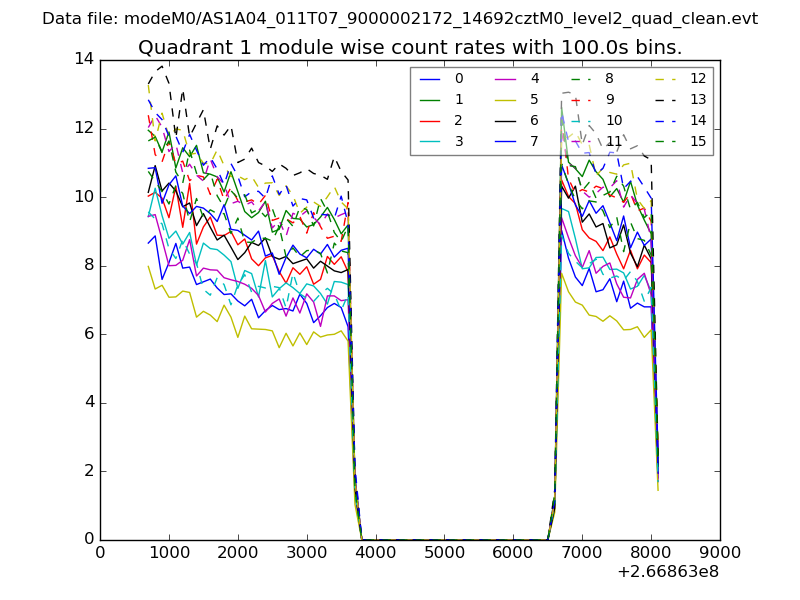
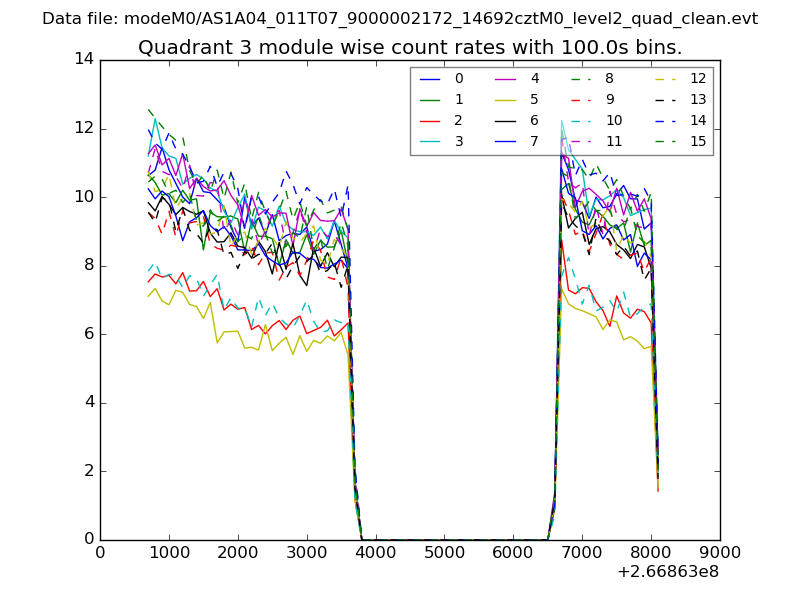
| Module-wise count rates for Quadrant A Data is divided into 100 sec bins |
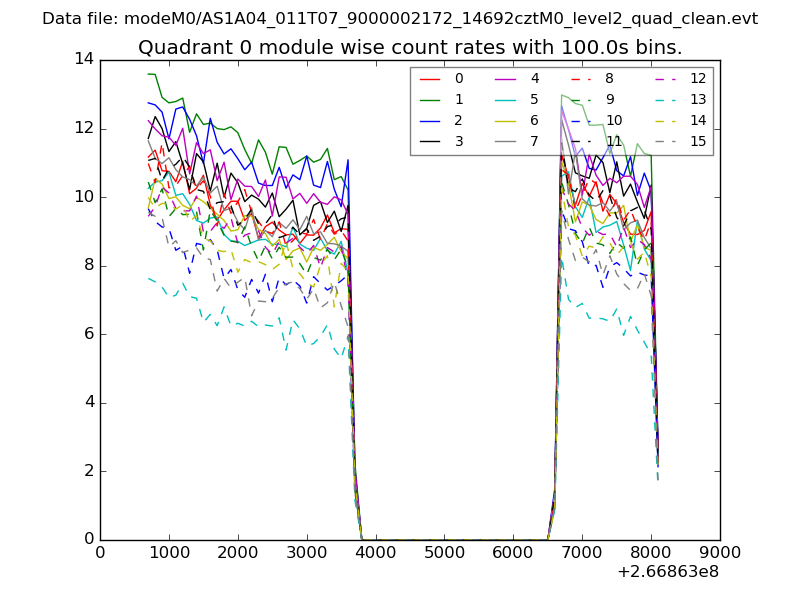 |
 |
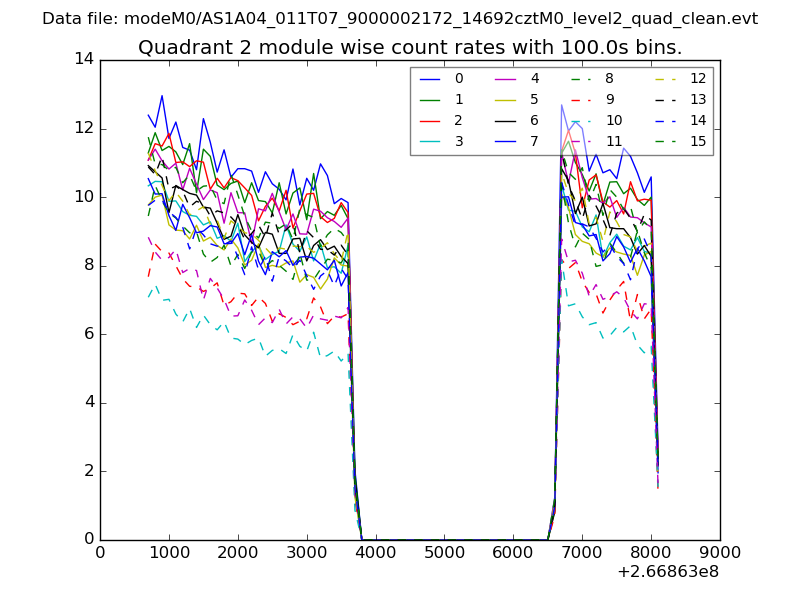
| Module-wise count rates for Quadrant B Data is divided into 100 sec bins |
 |
 |
| Module-wise count rates for Quadrant C Data is divided into 100 sec bins |
 |
 |
| Module-wise count rates for Quadrant D Data is divided into 100 sec bins |
 |
 |
| Parameter | Plot |
|---|---|
| CZT HV Monitor | 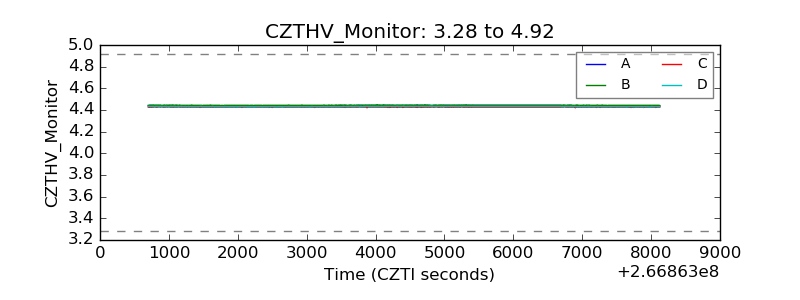 |
| D_VDD | 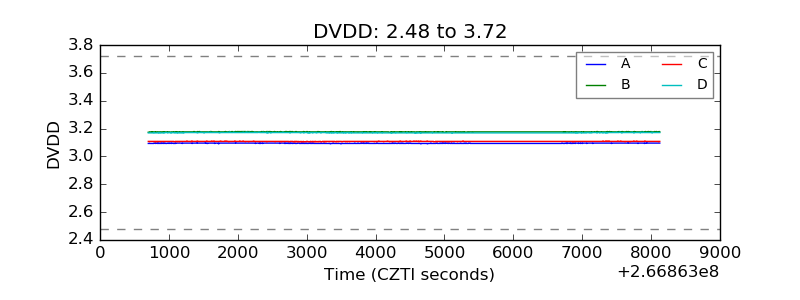 |
| Temperature 1 | 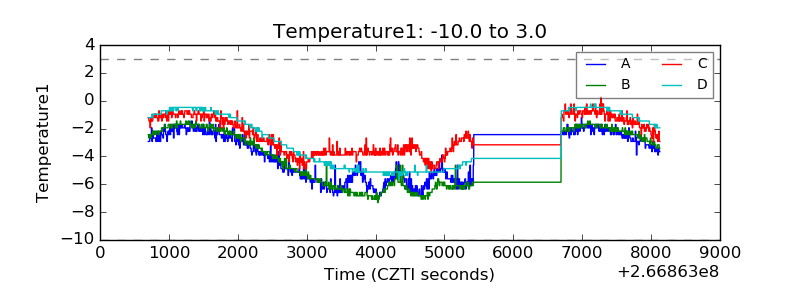 |
| Veto HV Monitor | 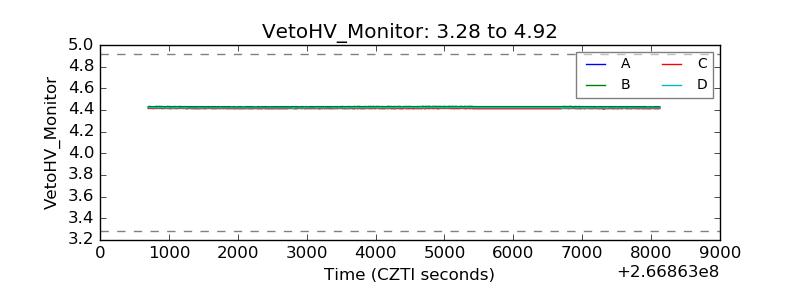 |
| Veto LLD | 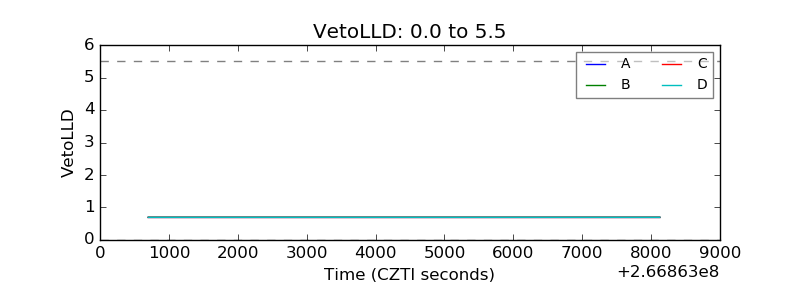 |
| Alpha Counter | 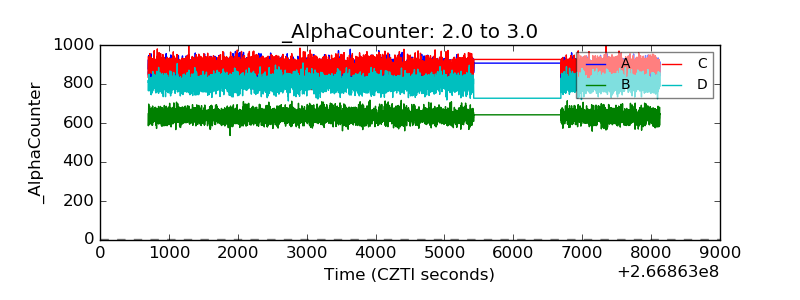 |
| _CPM_Rate | 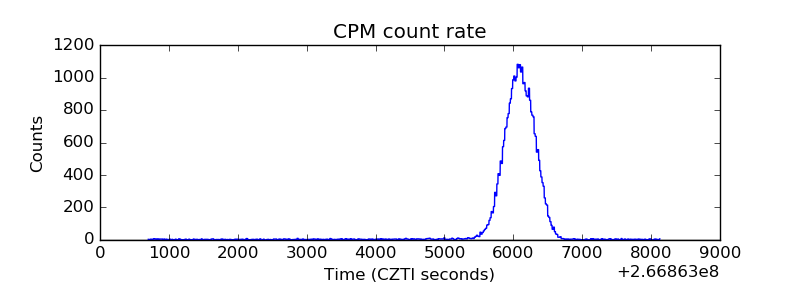 |
| CZT Counter | 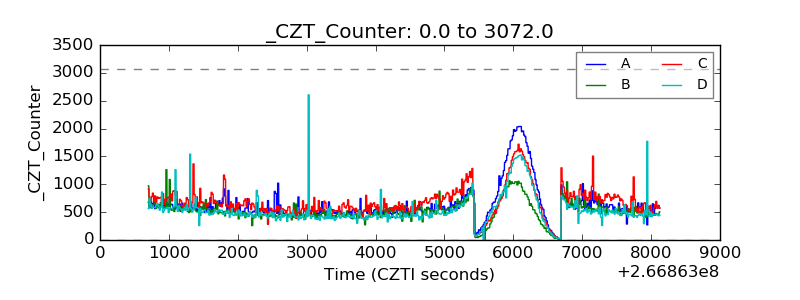 |
| +2.5 Volts monitor |  |
| +5 Volts monitor |  |
| _ROLL_ROT | 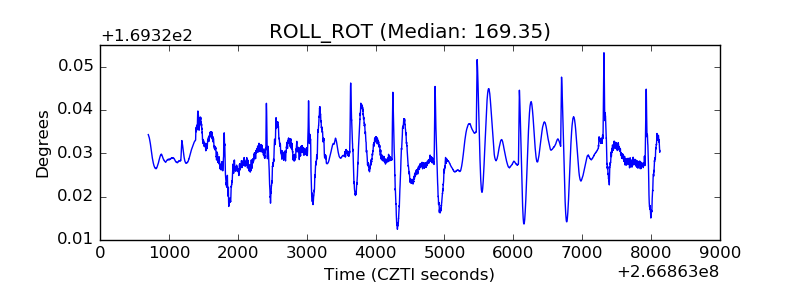 |
| _Roll_DEC | 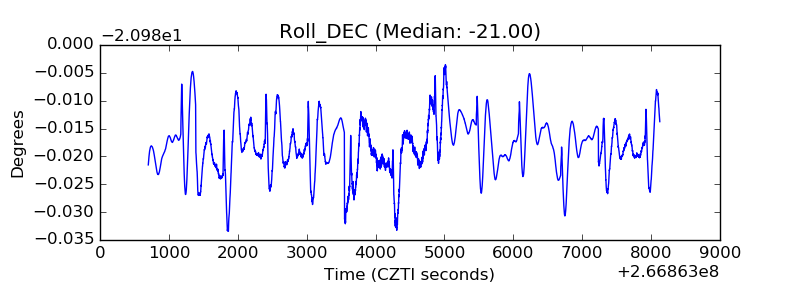 |
| _Roll_RA | 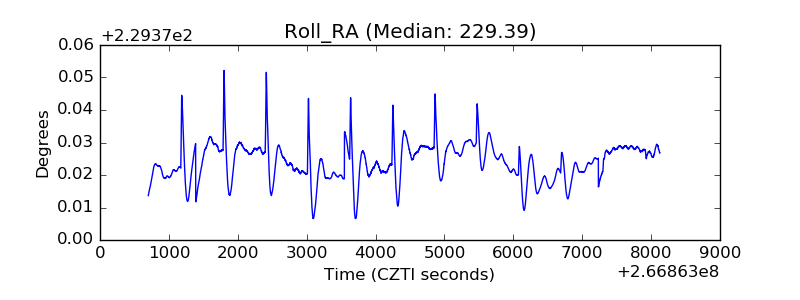 |
| Veto Counter | 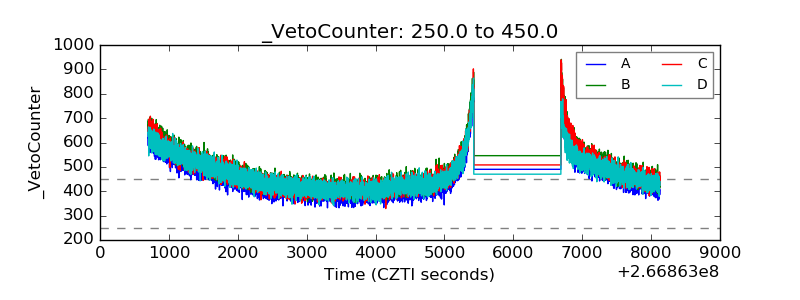 |