| Param | Original file | Final file |
|---|---|---|
| Filename | modeM0/AS1A04_011T07_9000002172_14693cztM0_level2.evt | modeM0/AS1A04_011T07_9000002172_14693cztM0_level2_quad_clean.evt |
| Size (bytes) | 494,910,720 | 94,080,960 |
| Size | 472.0 MB | 89.7 MB |
| Events in quadrant A | 3,510,406 | 613,656 |
| Events in quadrant B | 3,732,290 | 599,758 |
| Events in quadrant C | 4,043,223 | 590,196 |
| Events in quadrant D | 3,259,385 | 590,180 |
| Mode M0 | |||
|---|---|---|---|
| Quadrant | BADHDUFLAG | Total packets | Discarded packets |
| A | 0 | 14664 | 3 |
| B | 0 | 15304 | 2 |
| C | 0 | 16398 | 2 |
| D | 0 | 14080 | 2 |
| Mode M9 | |||
|---|---|---|---|
| Quadrant | BADHDUFLAG | Total packets | Discarded packets |
| A | 0 | 12 | 0 |
| B | 0 | 12 | 0 |
| C | 0 | 12 | 0 |
| D | 0 | 13 | 0 |
| Mode SS | |||
|---|---|---|---|
| Quadrant | BADHDUFLAG | Total packets | Discarded packets |
| A | 0 | 134 | 0 |
| B | 0 | 134 | 0 |
| C | 0 | 134 | 0 |
| D | 0 | 134 | 0 |
| Quadrant | Total seconds | Saturated seconds | Saturation percentage |
|---|---|---|---|
| A | 6524 | 101 | 1.548130% |
| B | 6524 | 235 | 3.602085% |
| C | 6524 | 77 | 1.180258% |
| D | 6524 | 60 | 0.919681% |
Noise dominated data is calculated using 1-second bins in cleaned event files. If a bin has >2000 counts, and if more than 50% of those come from <1% of pixels, then it is considered to be noise-dominated and hence unusable.
| Quadrant | # 1 sec bins | Bins with >0 counts | Bins with >2000 counts | High rate bins dominated by noise | Noise dominated (total time) | Noise dominated (detector-on time) | Marked lightcurve |
|---|---|---|---|---|---|---|---|
| A | 7605 | 6525 | 0 | 0 | 0.00% | 0.00% | 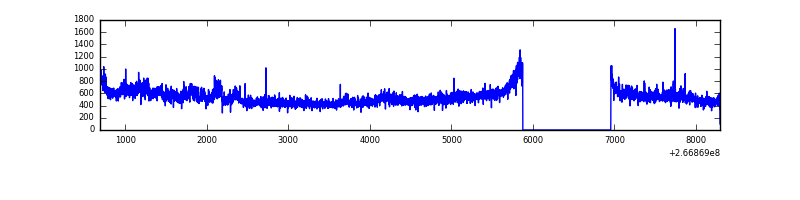 |
| B | 7605 | 6525 | 104 | 104 | 1.37% | 1.59% | 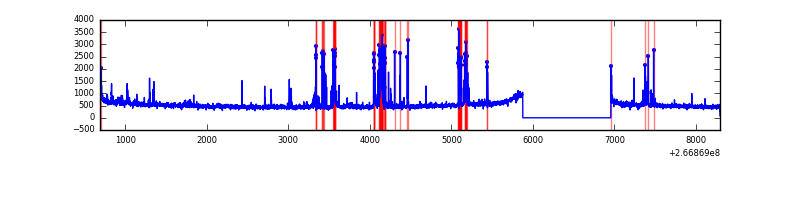 |
| C | 7605 | 6525 | 9 | 9 | 0.12% | 0.14% | 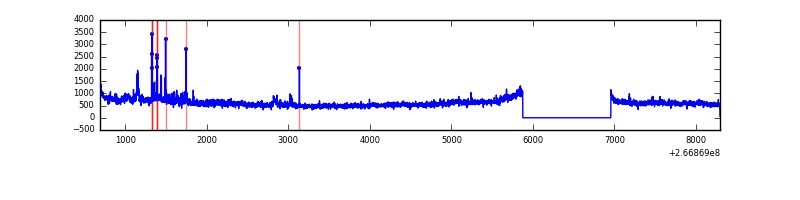 |
| D | 7605 | 6525 | 11 | 11 | 0.14% | 0.17% | 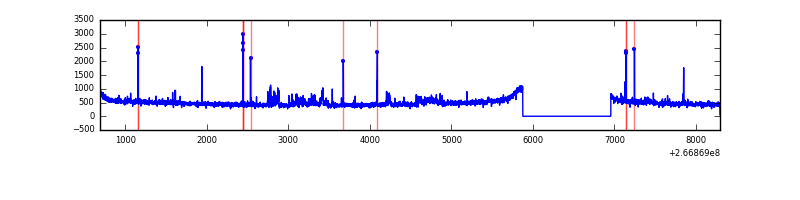 |
Top three noisy pixels from each quadrant. If the there are fewer than three noisy pixels in the level2.evt file, extra rows are filled as -1
| Pixel properties | Quadrant properties | ||||||
|---|---|---|---|---|---|---|---|
| Quadrant | DetID | PixID | Counts | Sigma | Mean | Median | Sigma |
| A | 8 | 15 | 259618 | 1527.04 | 836 | 823 | 169.5 |
| A | 12 | 189 | 17516 | 98.5 | 836 | 823 | 169.5 |
| A | 0 | 226 | 7777 | 41.03 | 836 | 823 | 169.5 |
| B | 10 | 16 | 369651 | 2361.84 | 816 | 797 | 156.2 |
| B | 0 | 229 | 124432 | 791.66 | 816 | 797 | 156.2 |
| B | 12 | 111 | 17689 | 108.16 | 816 | 797 | 156.2 |
| C | 3 | 233 | 845930 | 4603.15 | 794 | 799 | 183.6 |
| C | 0 | 207 | 95118 | 513.72 | 794 | 799 | 183.6 |
| C | 13 | 61 | 5684 | 26.61 | 794 | 799 | 183.6 |
| D | 12 | 110 | 116186 | 550.75 | 803 | 784 | 209.5 |
| D | 2 | 234 | 25707 | 118.94 | 803 | 784 | 209.5 |
| D | 9 | 1 | 22965 | 105.86 | 803 | 784 | 209.5 |
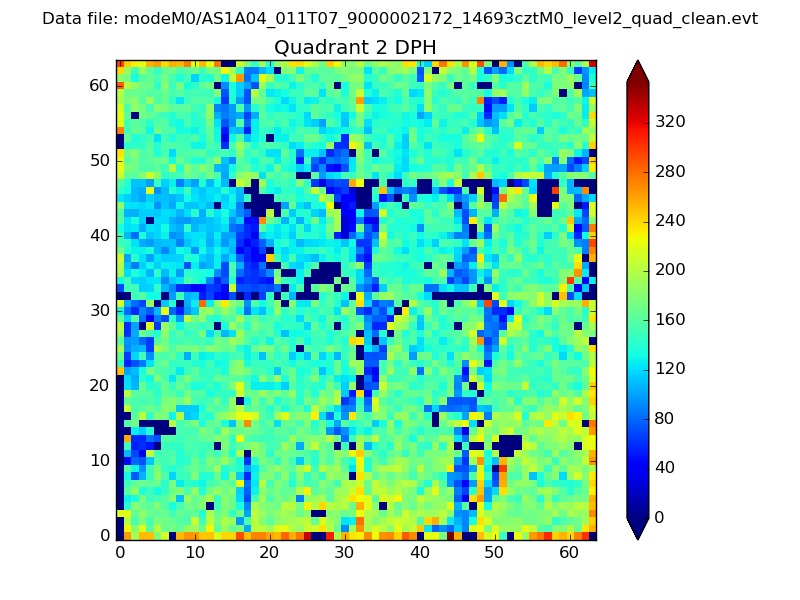
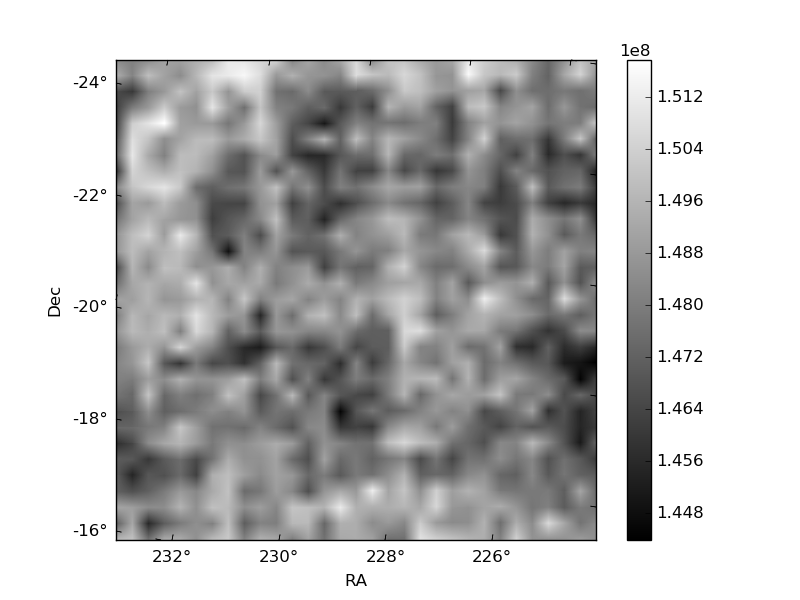
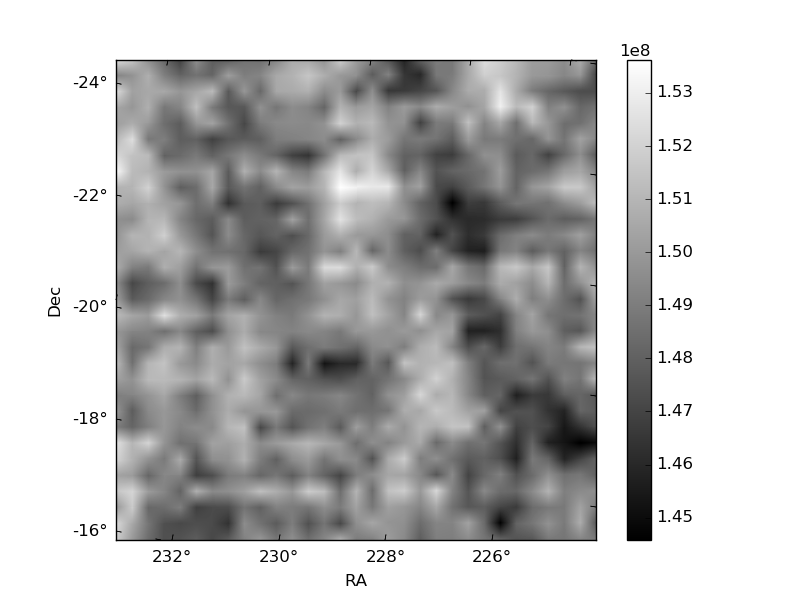
Histogram calculated using DETX and DETY for each event in the final _common_clean file
| Quadrant A | 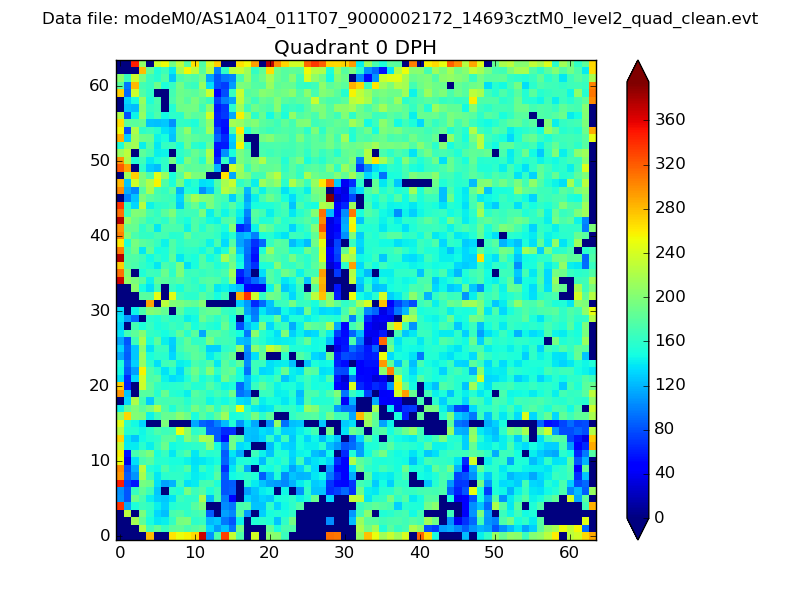 |
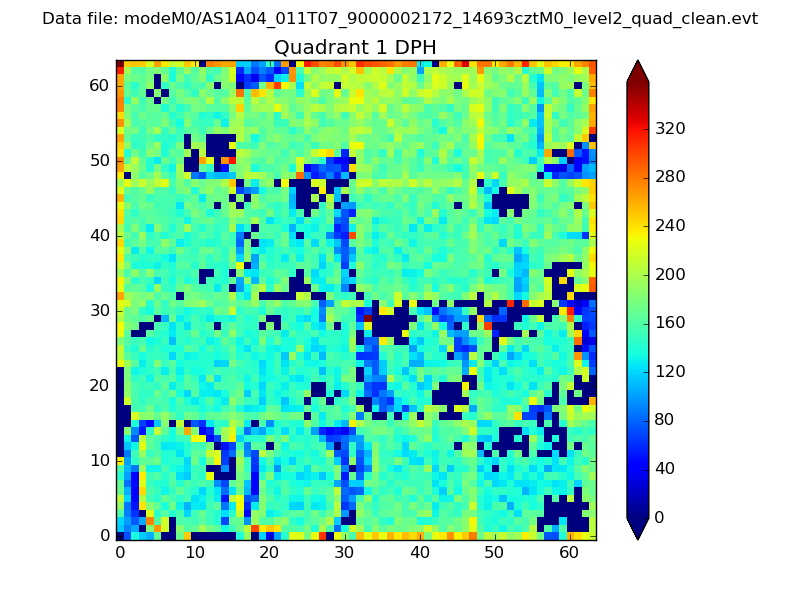 |
Quadrant B |
|---|---|---|---|
| Quadrant D | 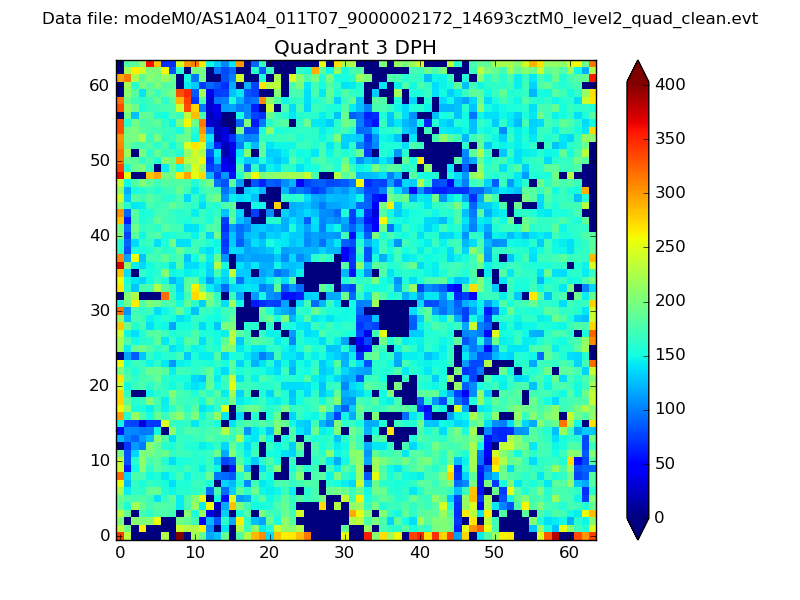 |
 |
Quadrant C |
| Plot type | Count rate plots | Images |
|---|---|---|
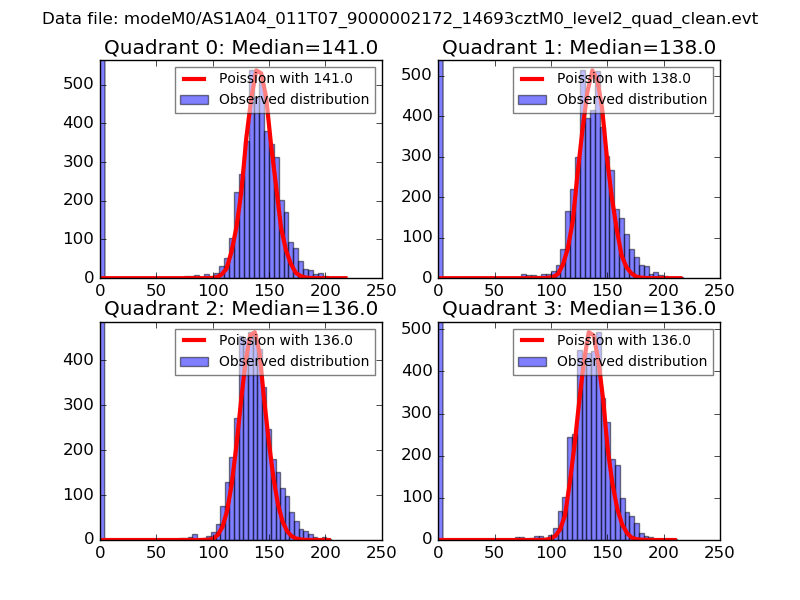
| Comparison with Poisson distribution Blue bars denote a histogram of data divided into 1 sec bins. Red curve is a Poisson curve with rate = median count rate of data. |
 |
 |
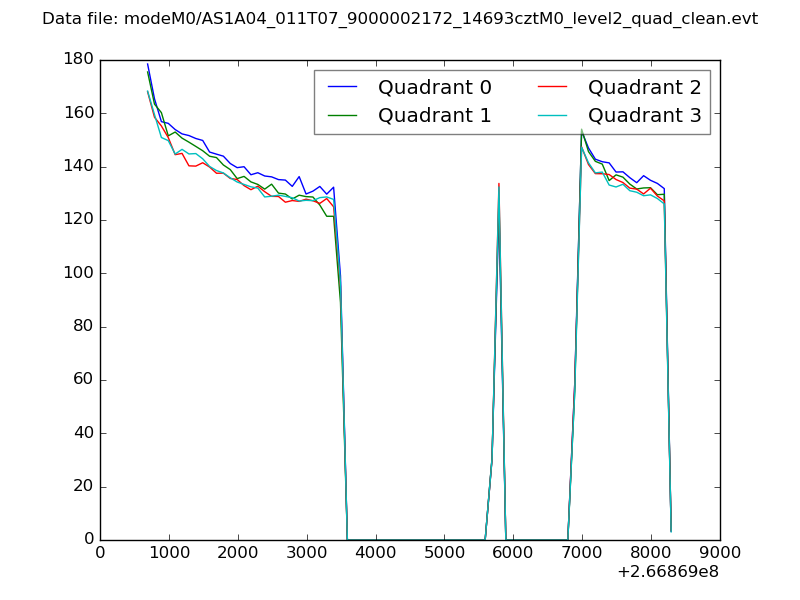
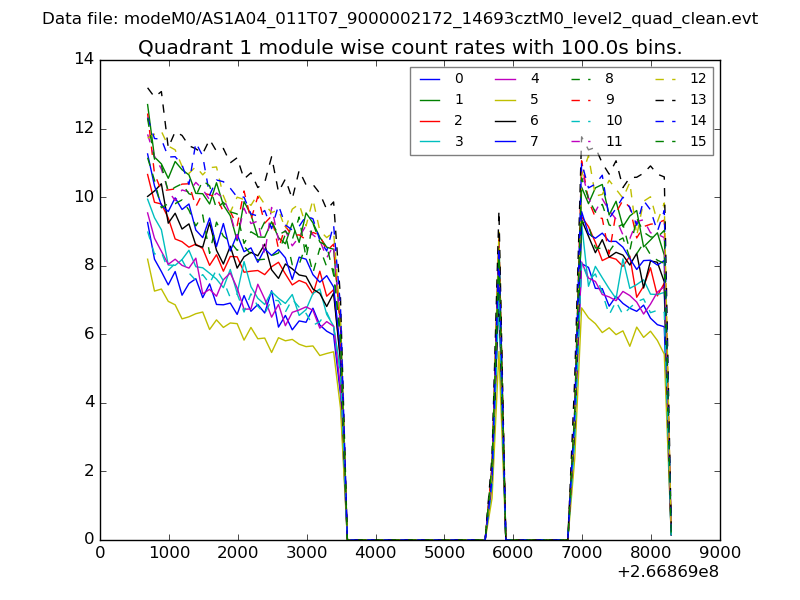
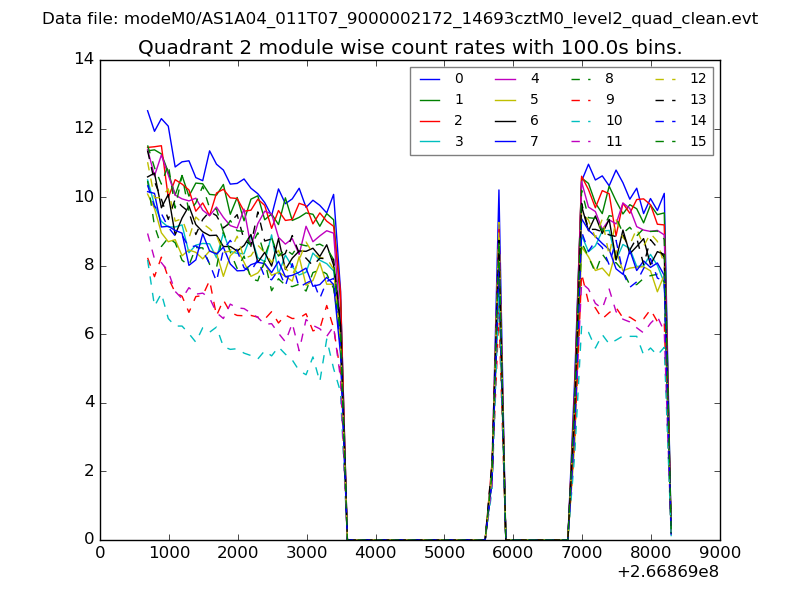
| Quadrant-wise count rates Data is divided into 100 sec bins |
 |
|
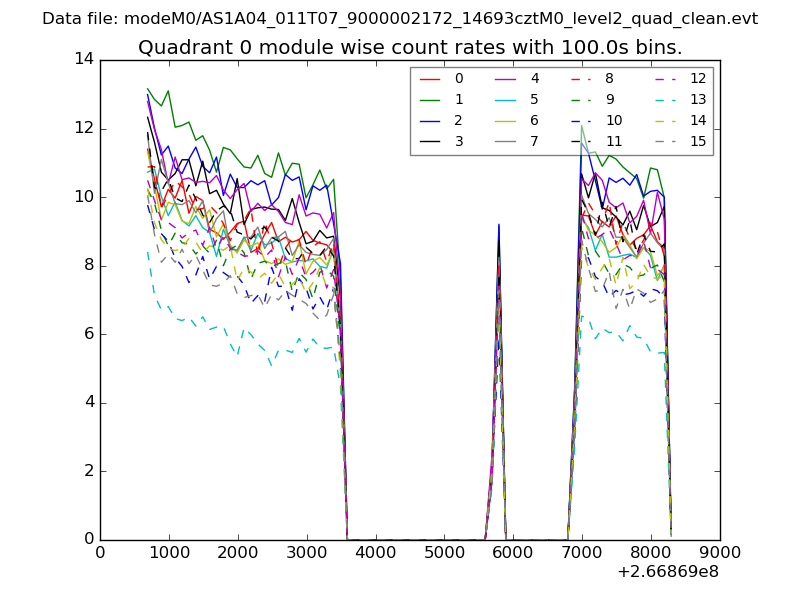
| Module-wise count rates for Quadrant A Data is divided into 100 sec bins |
 |
 |
| Module-wise count rates for Quadrant B Data is divided into 100 sec bins |
 |
 |
| Module-wise count rates for Quadrant C Data is divided into 100 sec bins |
 |
 |
| Module-wise count rates for Quadrant D Data is divided into 100 sec bins |
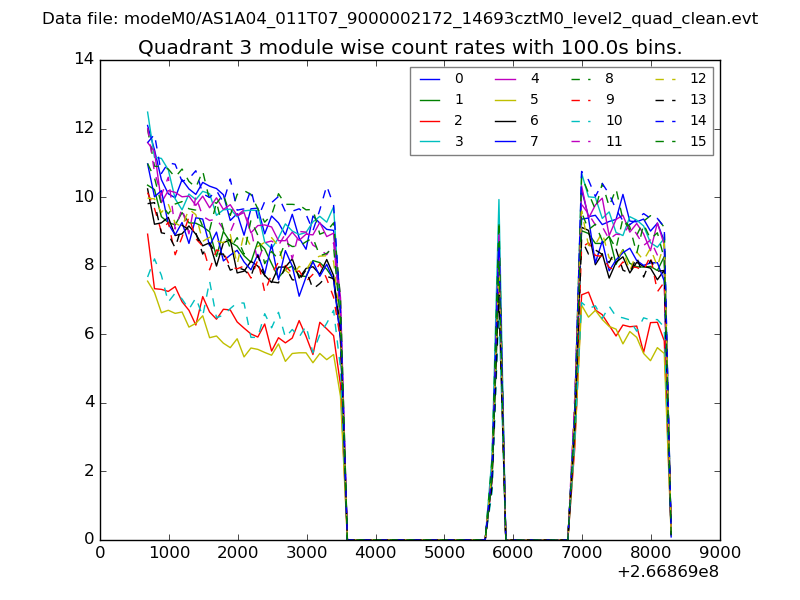 |
 |
| Parameter | Plot |
|---|---|
| CZT HV Monitor | 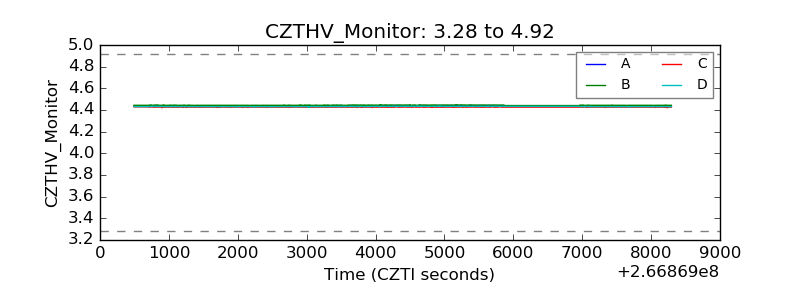 |
| D_VDD | 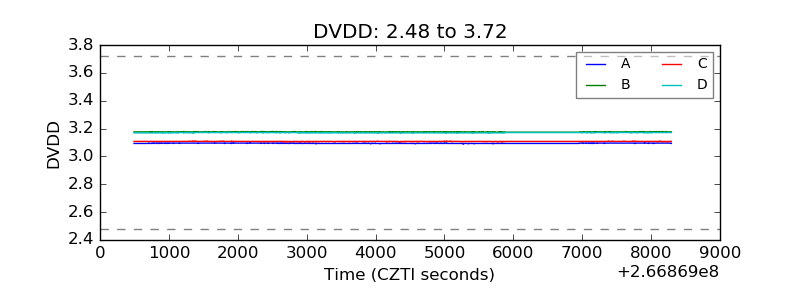 |
| Temperature 1 | 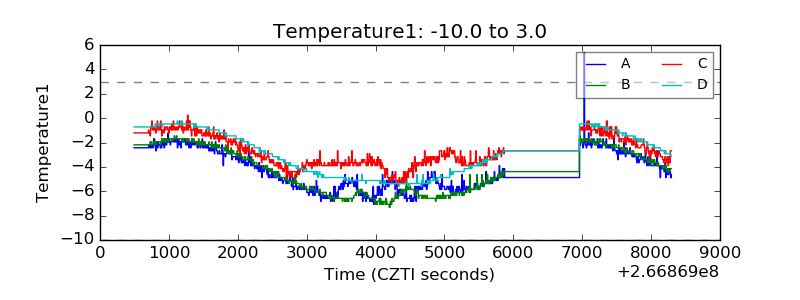 |
| Veto HV Monitor | 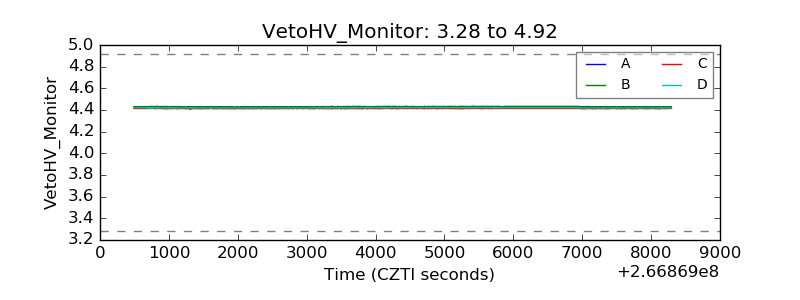 |
| Veto LLD | 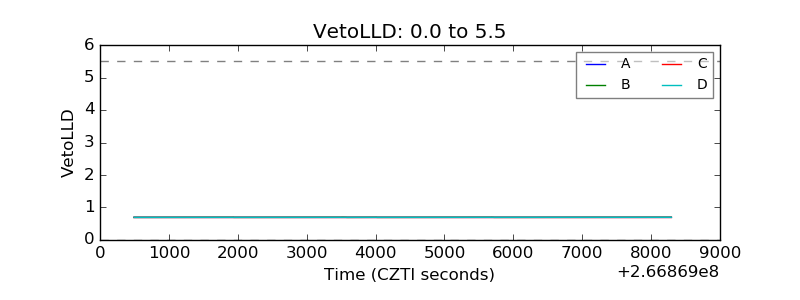 |
| Alpha Counter |  |
| _CPM_Rate |  |
| CZT Counter | 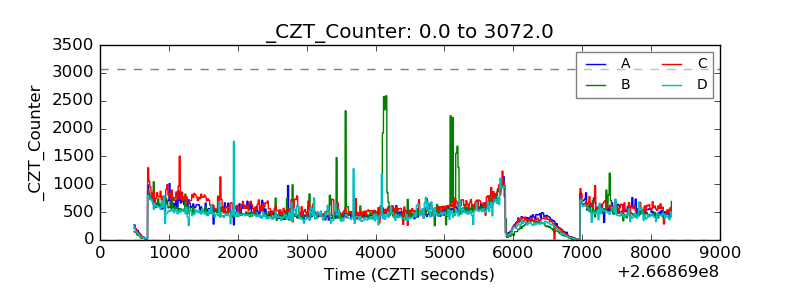 |
| +2.5 Volts monitor |  |
| +5 Volts monitor |  |
| _ROLL_ROT | 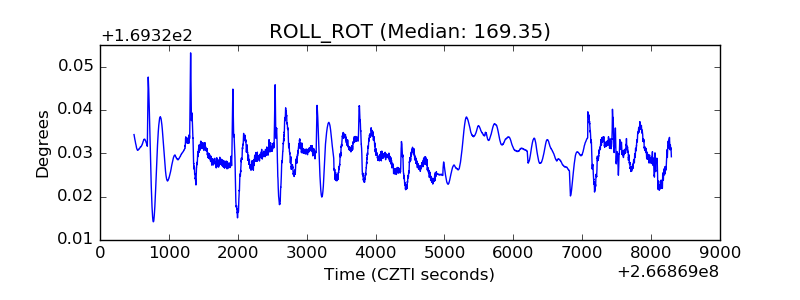 |
| _Roll_DEC | 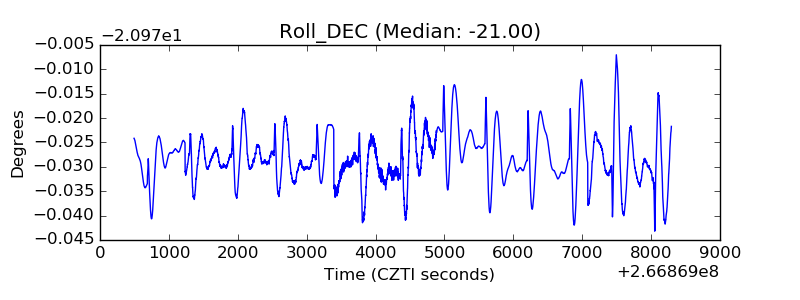 |
| _Roll_RA | 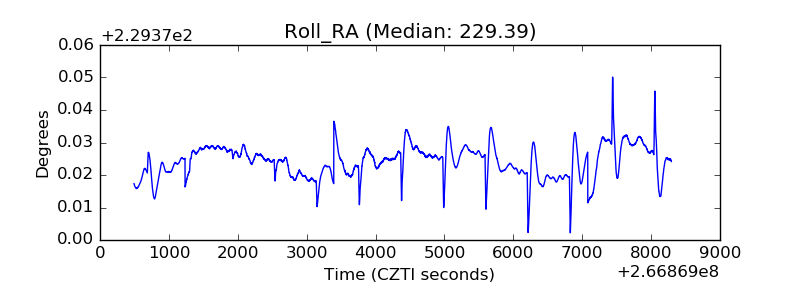 |
| Veto Counter | 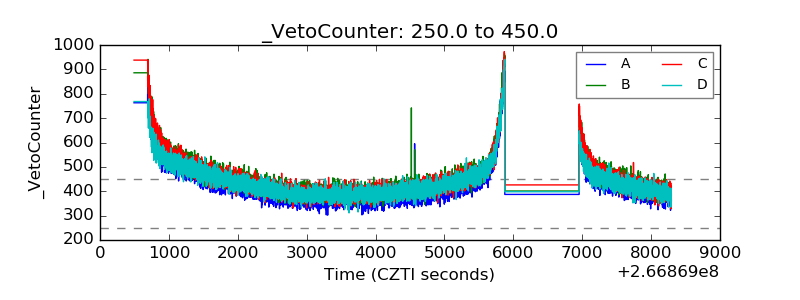 |