| Param | Original file | Final file |
|---|---|---|
| Filename | modeM0/AS1A04_011T07_9000002172_14694cztM0_level2.evt | modeM0/AS1A04_011T07_9000002172_14694cztM0_level2_quad_clean.evt |
| Size (bytes) | 527,693,760 | 96,094,080 |
| Size | 503.2 MB | 91.6 MB |
| Events in quadrant A | 3,558,618 | 623,754 |
| Events in quadrant B | 3,366,165 | 616,922 |
| Events in quadrant C | 4,122,848 | 603,544 |
| Events in quadrant D | 4,469,113 | 588,402 |
| Mode M0 | |||
|---|---|---|---|
| Quadrant | BADHDUFLAG | Total packets | Discarded packets |
| A | 0 | 14972 | 3 |
| B | 0 | 14461 | 2 |
| C | 0 | 16906 | 2 |
| D | 0 | 18262 | 2 |
| Mode M9 | |||
|---|---|---|---|
| Quadrant | BADHDUFLAG | Total packets | Discarded packets |
| A | 0 | 16 | 0 |
| B | 0 | 16 | 0 |
| C | 0 | 16 | 0 |
| D | 0 | 17 | 0 |
| Mode SS | |||
|---|---|---|---|
| Quadrant | BADHDUFLAG | Total packets | Discarded packets |
| A | 0 | 140 | 0 |
| B | 0 | 140 | 0 |
| C | 0 | 140 | 0 |
| D | 0 | 140 | 0 |
| Quadrant | Total seconds | Saturated seconds | Saturation percentage |
|---|---|---|---|
| A | 6848 | 25 | 0.365070% |
| B | 6848 | 41 | 0.598715% |
| C | 6848 | 16 | 0.233645% |
| D | 6848 | 239 | 3.490070% |
Noise dominated data is calculated using 1-second bins in cleaned event files. If a bin has >2000 counts, and if more than 50% of those come from <1% of pixels, then it is considered to be noise-dominated and hence unusable.
| Quadrant | # 1 sec bins | Bins with >0 counts | Bins with >2000 counts | High rate bins dominated by noise | Noise dominated (total time) | Noise dominated (detector-on time) | Marked lightcurve |
|---|---|---|---|---|---|---|---|
| A | 7655 | 6850 | 0 | 0 | 0.00% | 0.00% | 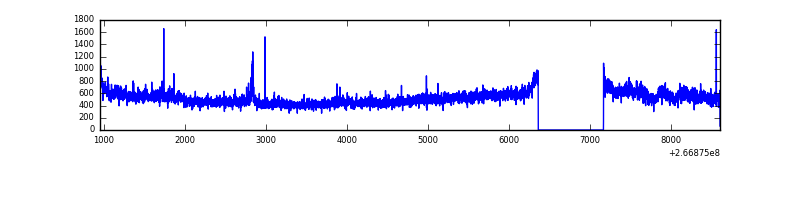 |
| B | 7655 | 6850 | 14 | 14 | 0.18% | 0.20% | 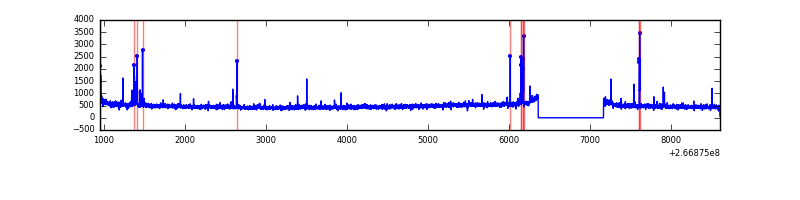 |
| C | 7655 | 6850 | 0 | 0 | 0.00% | 0.00% | 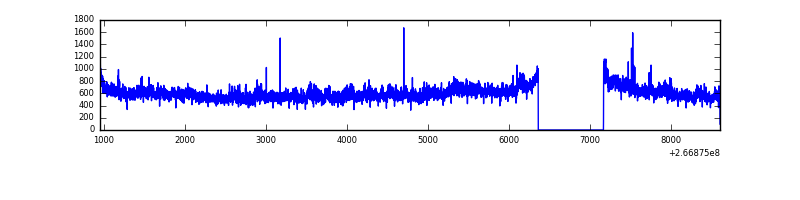 |
| D | 7655 | 6850 | 208 | 208 | 2.72% | 3.04% | 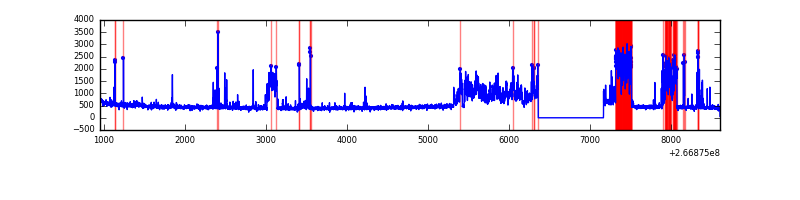 |
Top three noisy pixels from each quadrant. If the there are fewer than three noisy pixels in the level2.evt file, extra rows are filled as -1
| Pixel properties | Quadrant properties | ||||||
|---|---|---|---|---|---|---|---|
| Quadrant | DetID | PixID | Counts | Sigma | Mean | Median | Sigma |
| A | 8 | 15 | 277794 | 1638.95 | 836 | 818 | 169.0 |
| A | 12 | 189 | 52661 | 306.77 | 836 | 818 | 169.0 |
| A | 0 | 226 | 7400 | 38.95 | 836 | 818 | 169.0 |
| B | 10 | 16 | 70875 | 443.77 | 828 | 807 | 157.9 |
| B | 0 | 197 | 21304 | 129.82 | 828 | 807 | 157.9 |
| B | 0 | 229 | 20699 | 125.98 | 828 | 807 | 157.9 |
| C | 3 | 233 | 973556 | 5228.35 | 800 | 807 | 186.1 |
| C | 0 | 207 | 14309 | 72.57 | 800 | 807 | 186.1 |
| C | 3 | 234 | 6998 | 33.28 | 800 | 807 | 186.1 |
| D | 12 | 110 | 1228107 | 5836.35 | 791 | 776 | 210.3 |
| D | 9 | 1 | 121149 | 572.41 | 791 | 776 | 210.3 |
| D | 2 | 234 | 31055 | 143.99 | 791 | 776 | 210.3 |
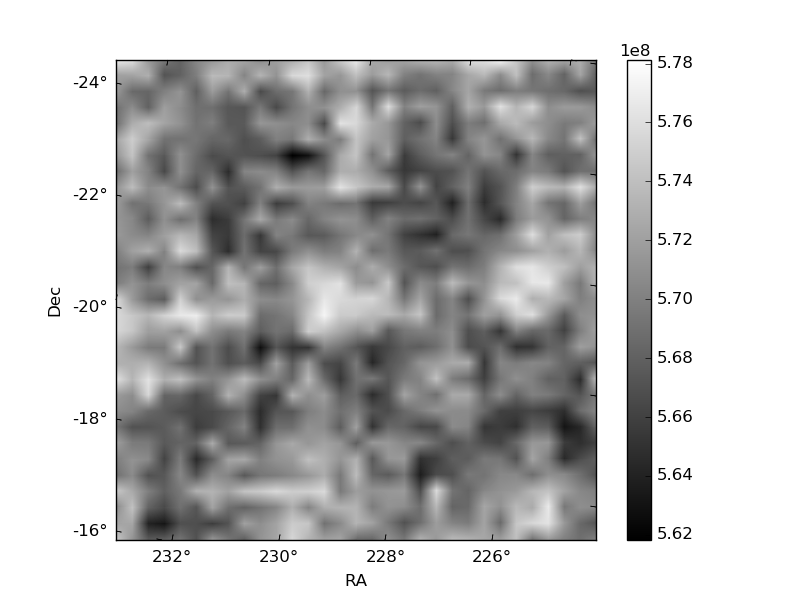
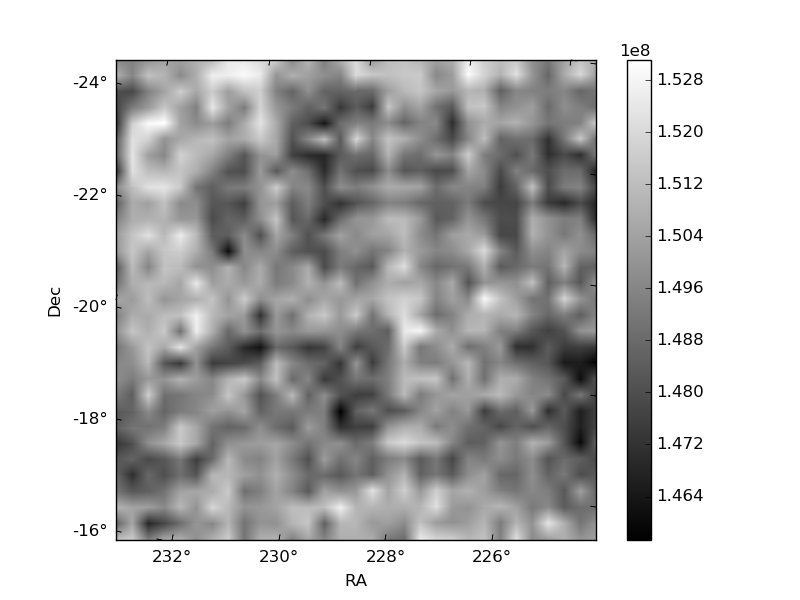
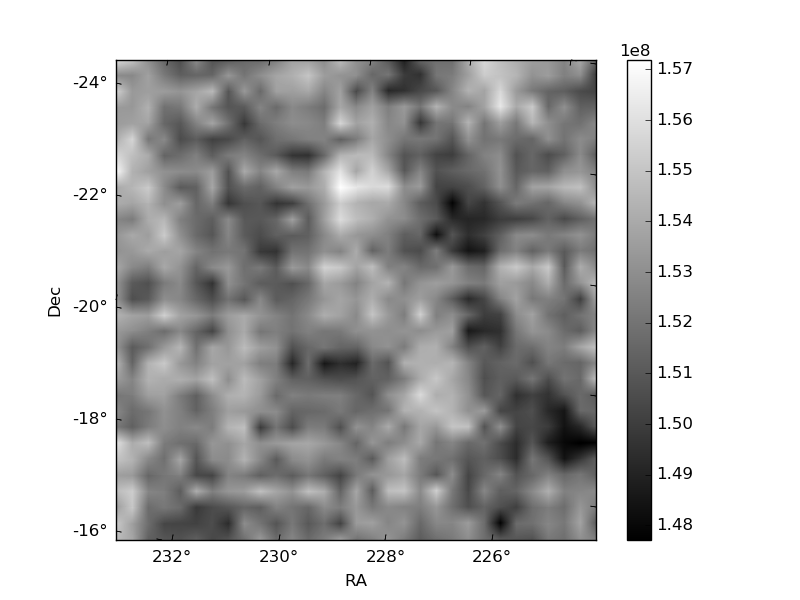
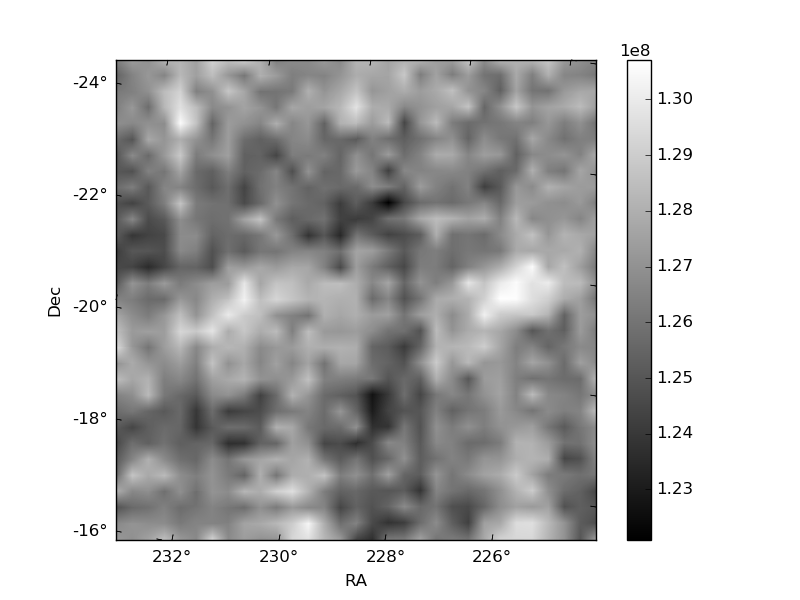
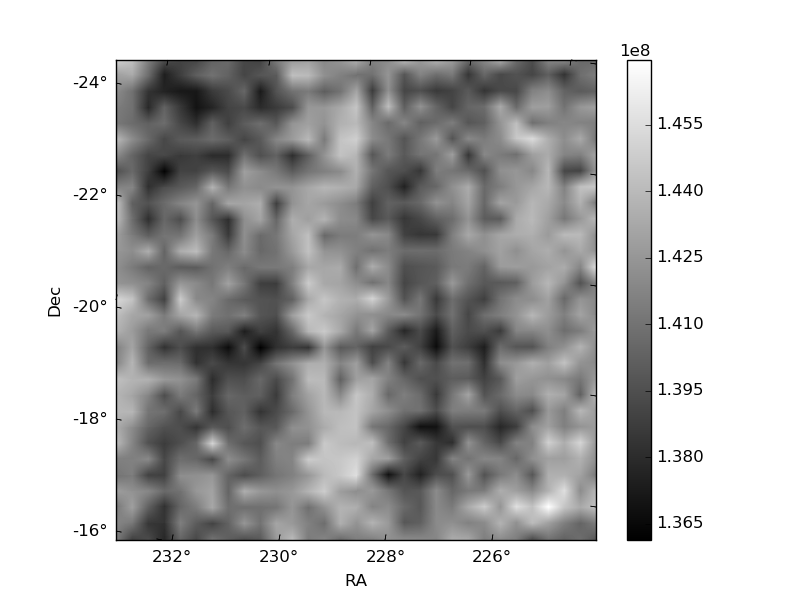
Histogram calculated using DETX and DETY for each event in the final _common_clean file
| Quadrant A | 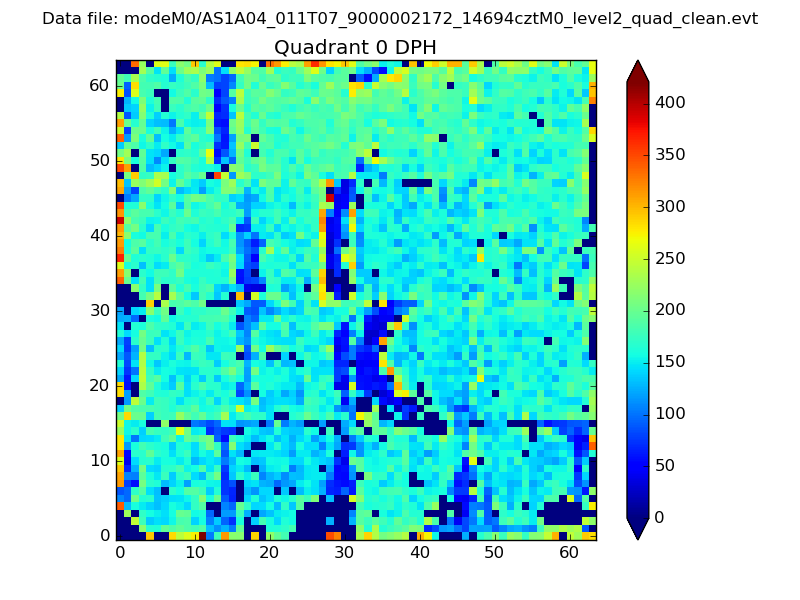 |
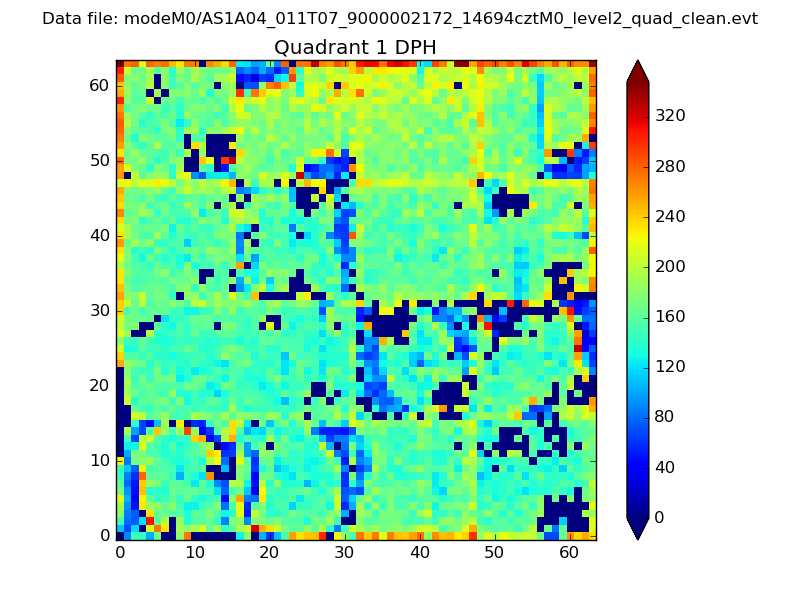 |
Quadrant B |
|---|---|---|---|
| Quadrant D | 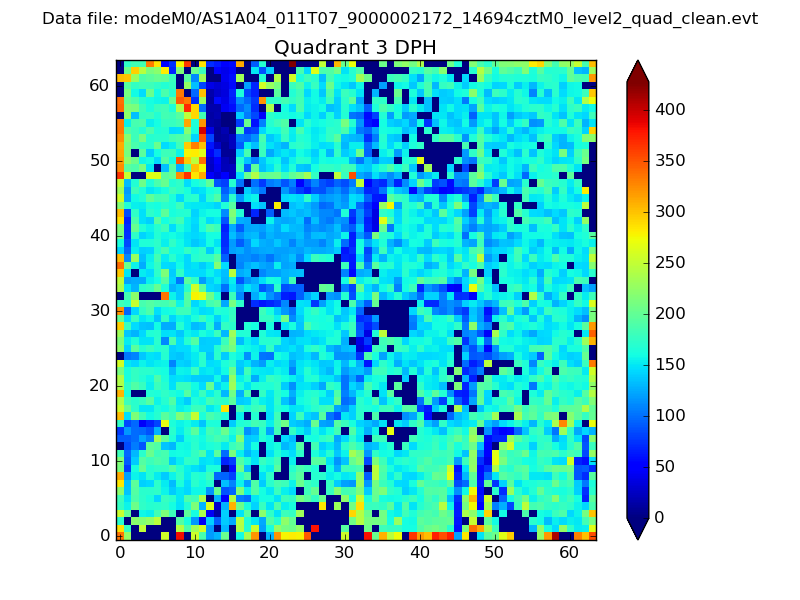 |
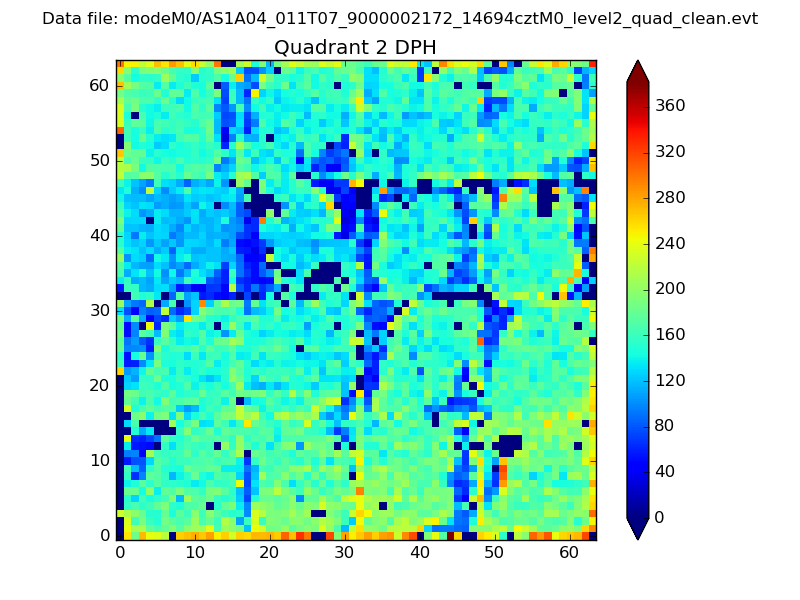 |
Quadrant C |
| Plot type | Count rate plots | Images |
|---|---|---|
| Comparison with Poisson distribution Blue bars denote a histogram of data divided into 1 sec bins. Red curve is a Poisson curve with rate = median count rate of data. |
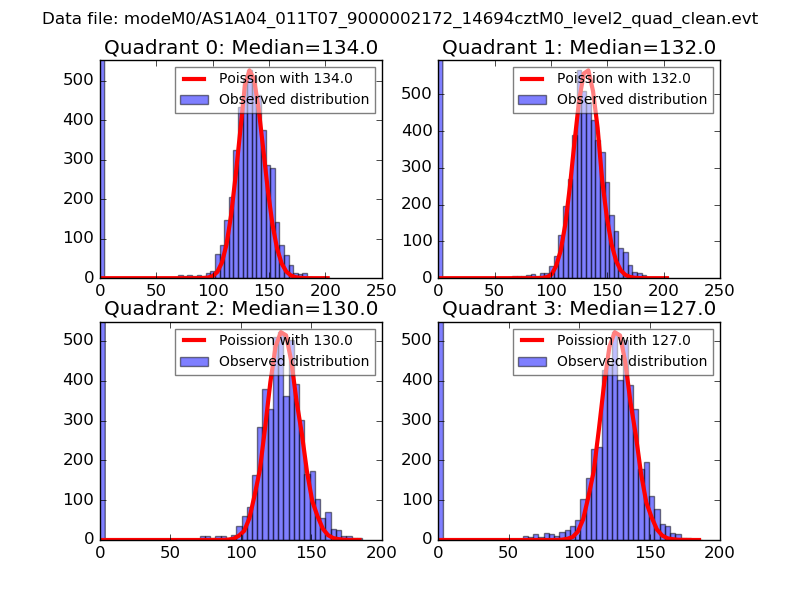 |
 |
| Quadrant-wise count rates Data is divided into 100 sec bins |
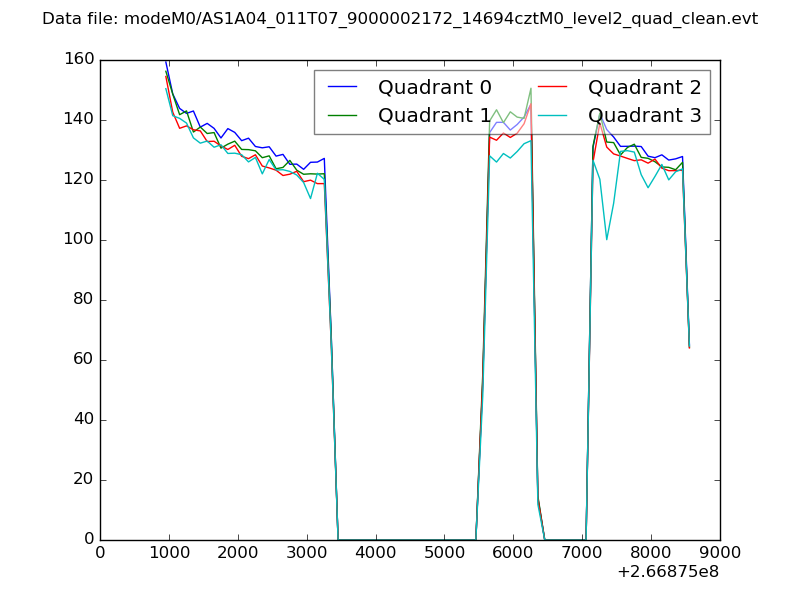 |
|
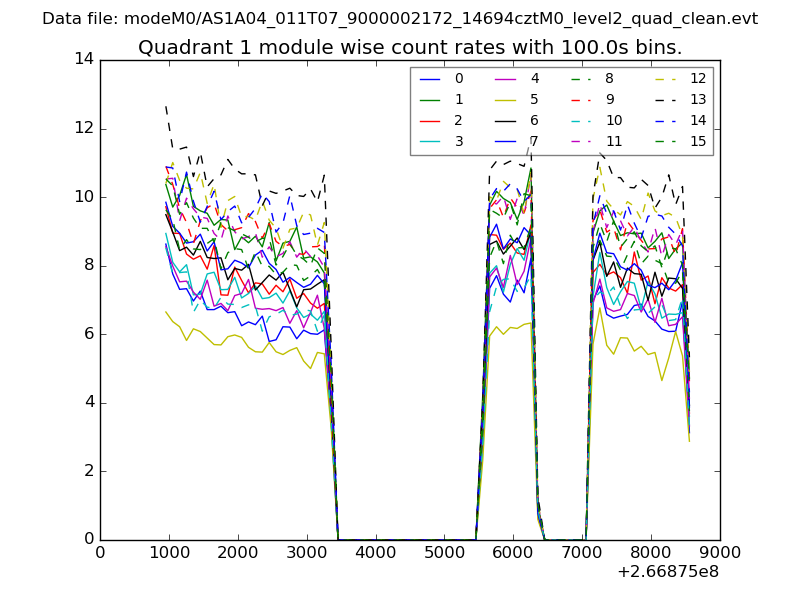
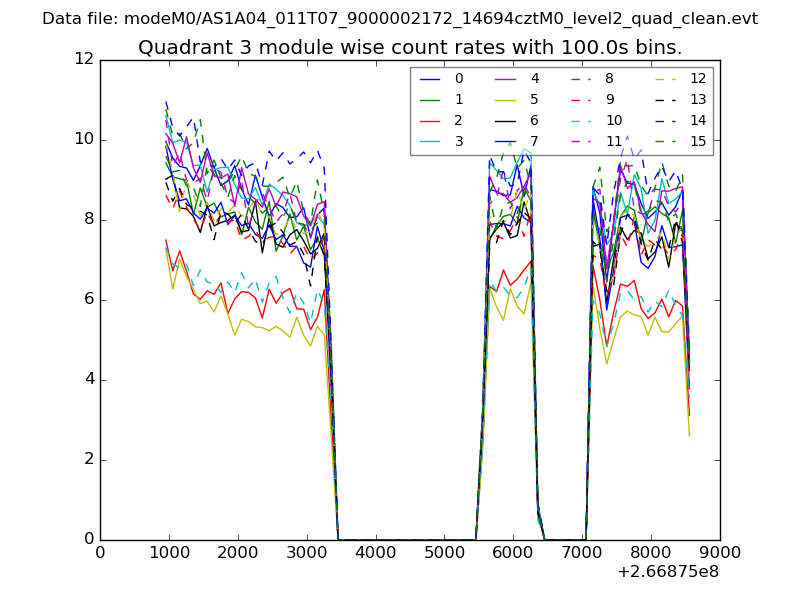
| Module-wise count rates for Quadrant A Data is divided into 100 sec bins |
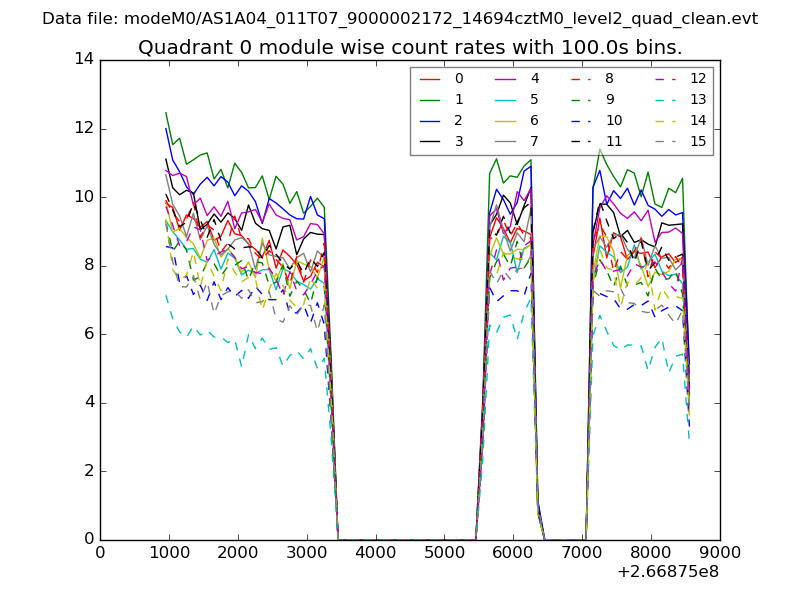 |
 |
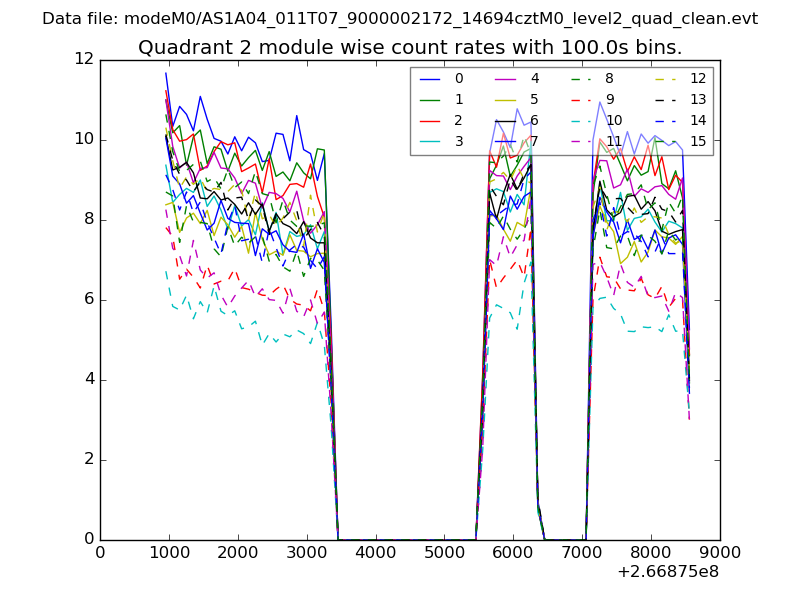
| Module-wise count rates for Quadrant B Data is divided into 100 sec bins |
 |
 |
| Module-wise count rates for Quadrant C Data is divided into 100 sec bins |
 |
 |
| Module-wise count rates for Quadrant D Data is divided into 100 sec bins |
 |
 |
| Parameter | Plot |
|---|---|
| CZT HV Monitor | 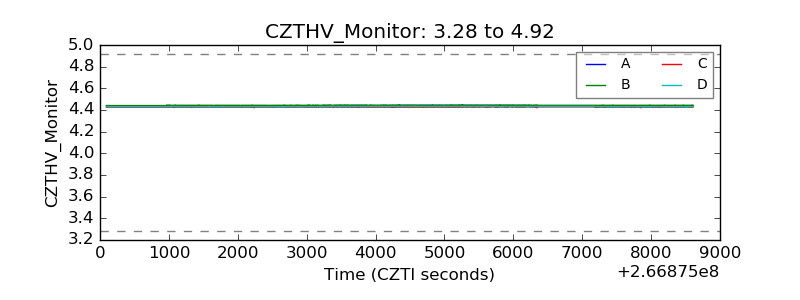 |
| D_VDD | 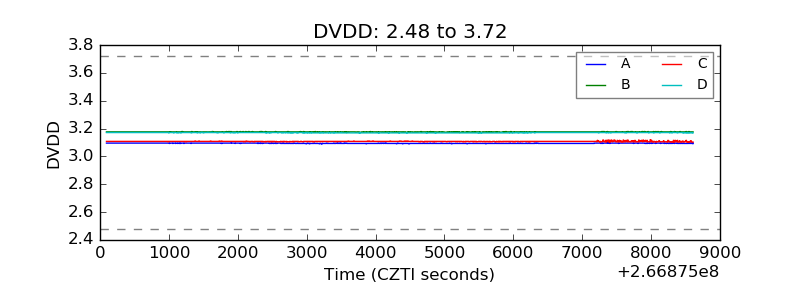 |
| Temperature 1 | 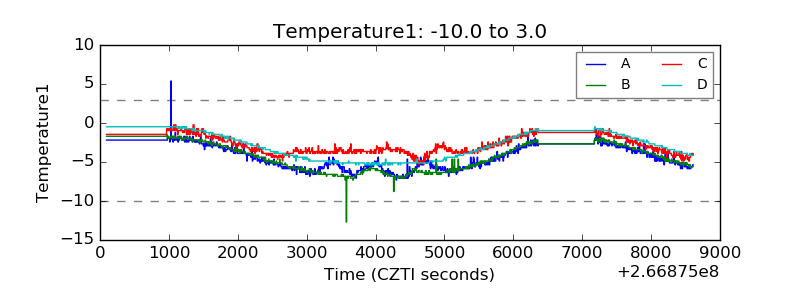 |
| Veto HV Monitor | 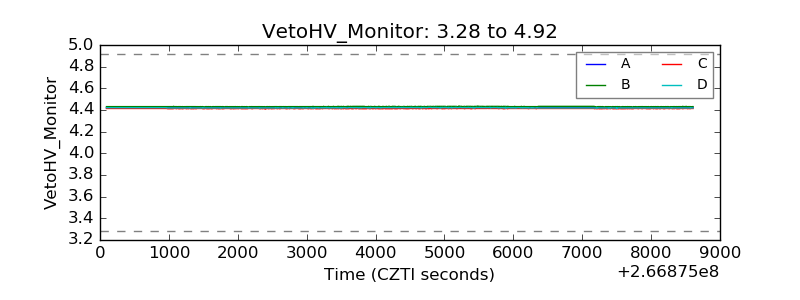 |
| Veto LLD | 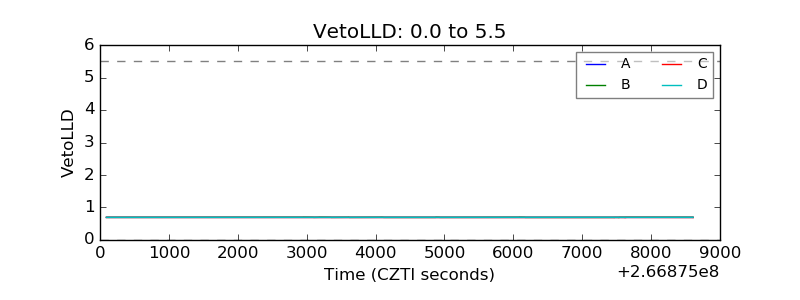 |
| Alpha Counter | 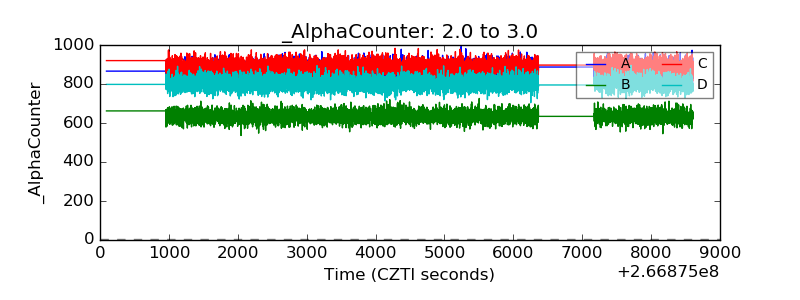 |
| _CPM_Rate | 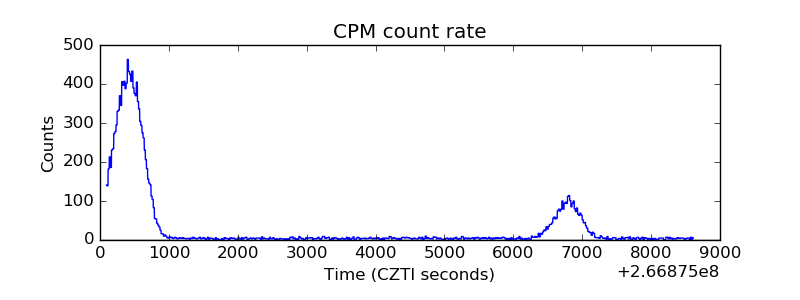 |
| CZT Counter | 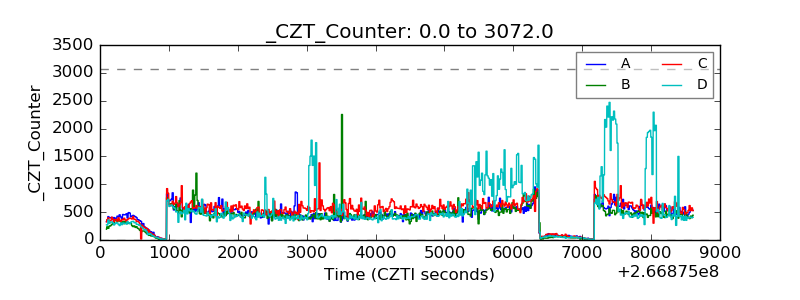 |
| +2.5 Volts monitor |  |
| +5 Volts monitor | 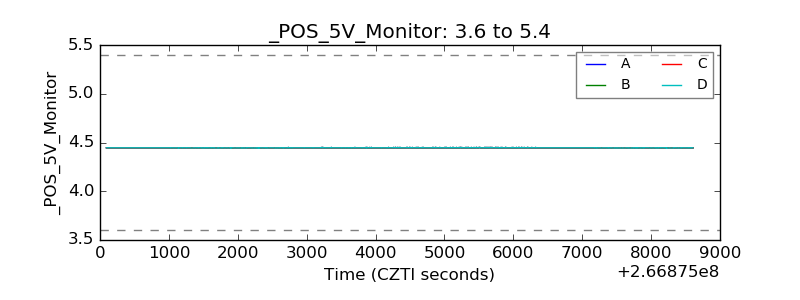 |
| _ROLL_ROT |  |
| _Roll_DEC | 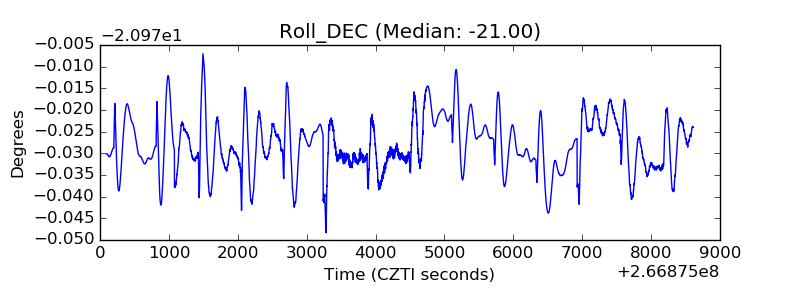 |
| _Roll_RA | 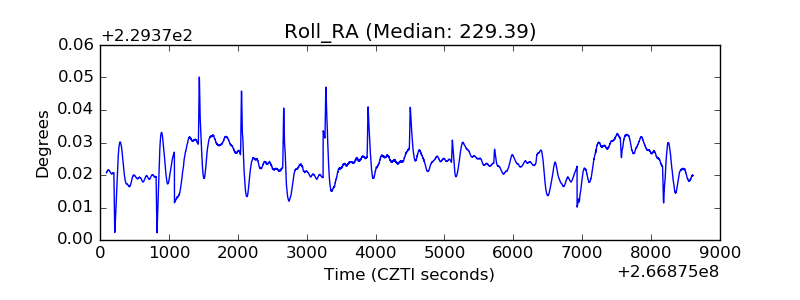 |
| Veto Counter | 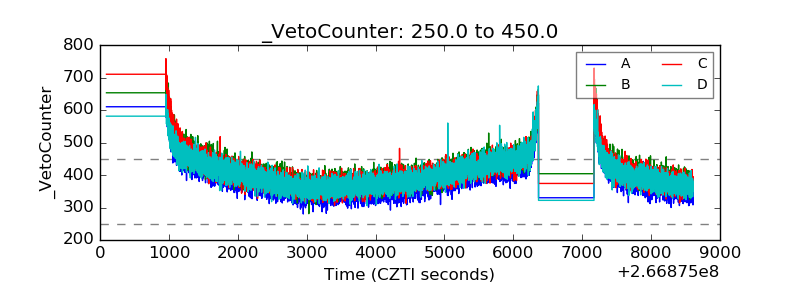 |