| Param | Original file | Final file |
|---|---|---|
| Filename | modeM0/AS1A04_011T07_9000002172_14695cztM0_level2.evt | modeM0/AS1A04_011T07_9000002172_14695cztM0_level2_quad_clean.evt |
| Size (bytes) | 545,486,400 | 103,993,920 |
| Size | 520.2 MB | 99.2 MB |
| Events in quadrant A | 3,796,151 | 674,267 |
| Events in quadrant B | 3,655,102 | 666,428 |
| Events in quadrant C | 4,396,242 | 655,205 |
| Events in quadrant D | 4,175,535 | 643,326 |
| Mode M0 | |||
|---|---|---|---|
| Quadrant | BADHDUFLAG | Total packets | Discarded packets |
| A | 0 | 15954 | 3 |
| B | 0 | 15644 | 2 |
| C | 0 | 17815 | 2 |
| D | 0 | 17609 | 2 |
| Mode M9 | |||
|---|---|---|---|
| Quadrant | BADHDUFLAG | Total packets | Discarded packets |
| A | 0 | 3 | 0 |
| B | 0 | 3 | 0 |
| C | 0 | 3 | 0 |
| D | 0 | 4 | 0 |
| Mode SS | |||
|---|---|---|---|
| Quadrant | BADHDUFLAG | Total packets | Discarded packets |
| A | 0 | 150 | 0 |
| B | 0 | 150 | 0 |
| C | 0 | 150 | 0 |
| D | 0 | 150 | 0 |
| Quadrant | Total seconds | Saturated seconds | Saturation percentage |
|---|---|---|---|
| A | 7324 | 59 | 0.805571% |
| B | 7324 | 68 | 0.928454% |
| C | 7324 | 61 | 0.832878% |
| D | 7324 | 227 | 3.099399% |
Noise dominated data is calculated using 1-second bins in cleaned event files. If a bin has >2000 counts, and if more than 50% of those come from <1% of pixels, then it is considered to be noise-dominated and hence unusable.
| Quadrant | # 1 sec bins | Bins with >0 counts | Bins with >2000 counts | High rate bins dominated by noise | Noise dominated (total time) | Noise dominated (detector-on time) | Marked lightcurve |
|---|---|---|---|---|---|---|---|
| A | 7680 | 7327 | 0 | 0 | 0.00% | 0.00% | 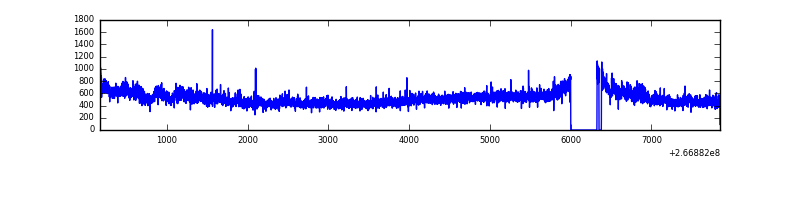 |
| B | 7680 | 7326 | 16 | 16 | 0.21% | 0.22% | 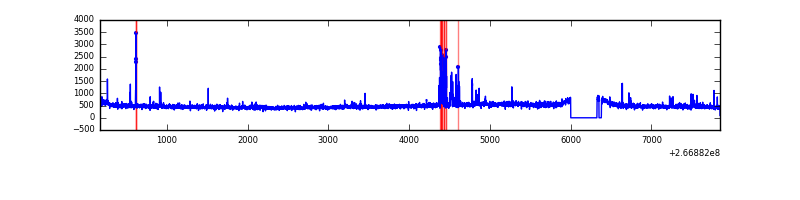 |
| C | 7680 | 7326 | 4 | 4 | 0.05% | 0.05% | 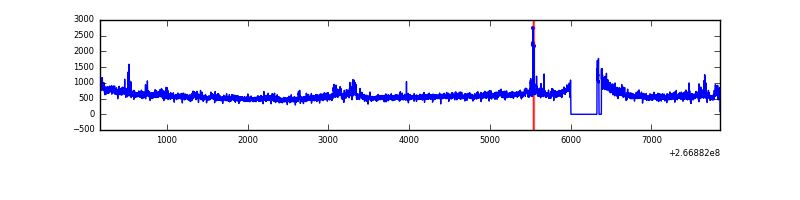 |
| D | 7680 | 7327 | 217 | 217 | 2.83% | 2.96% | 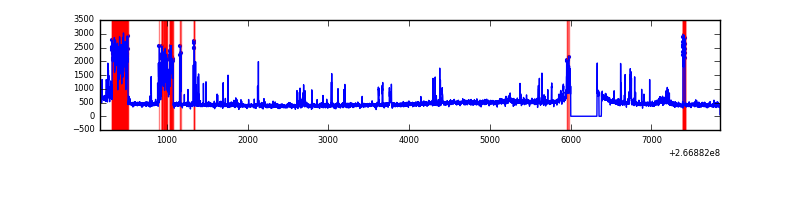 |
Top three noisy pixels from each quadrant. If the there are fewer than three noisy pixels in the level2.evt file, extra rows are filled as -1
| Pixel properties | Quadrant properties | ||||||
|---|---|---|---|---|---|---|---|
| Quadrant | DetID | PixID | Counts | Sigma | Mean | Median | Sigma |
| A | 8 | 15 | 292344 | 1602.07 | 888 | 866 | 181.9 |
| A | 12 | 189 | 42665 | 229.74 | 888 | 866 | 181.9 |
| A | 1 | 162 | 23526 | 124.55 | 888 | 866 | 181.9 |
| B | 0 | 229 | 117567 | 685.93 | 881 | 859 | 170.1 |
| B | 0 | 197 | 21577 | 121.77 | 881 | 859 | 170.1 |
| B | 0 | 214 | 20015 | 112.59 | 881 | 859 | 170.1 |
| C | 3 | 233 | 1009295 | 5080.67 | 850 | 854 | 198.5 |
| C | 0 | 207 | 47959 | 237.32 | 850 | 854 | 198.5 |
| C | 8 | 128 | 11378 | 53.02 | 850 | 854 | 198.5 |
| D | 12 | 110 | 706595 | 3274.55 | 848 | 825 | 215.5 |
| D | 1 | 52 | 88646 | 407.46 | 848 | 825 | 215.5 |
| D | 9 | 1 | 41255 | 187.58 | 848 | 825 | 215.5 |
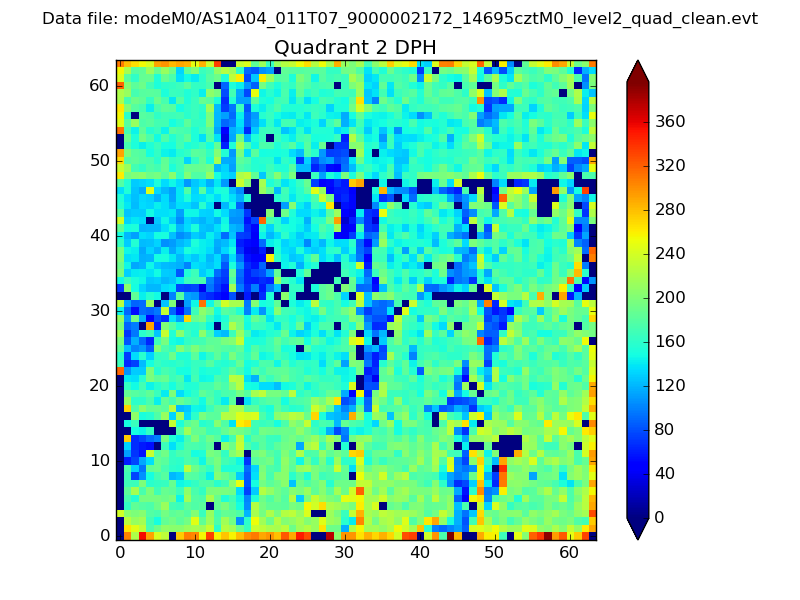
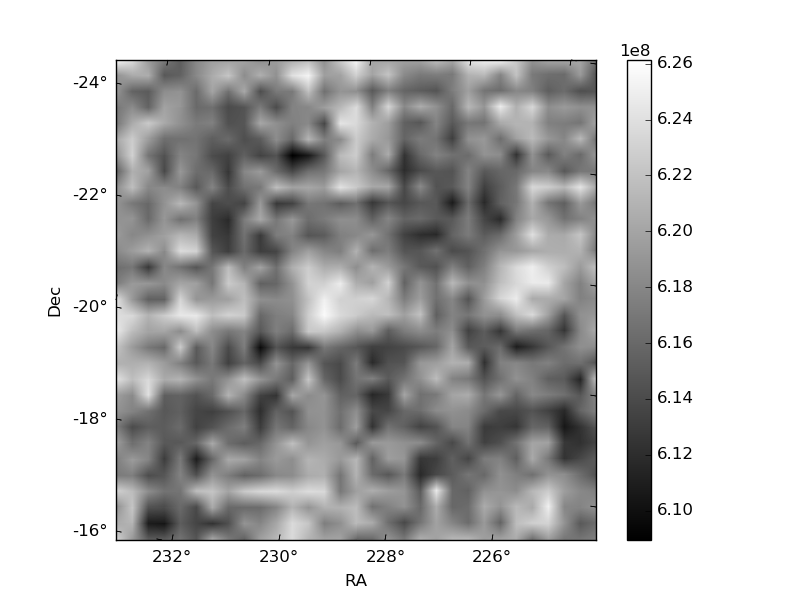
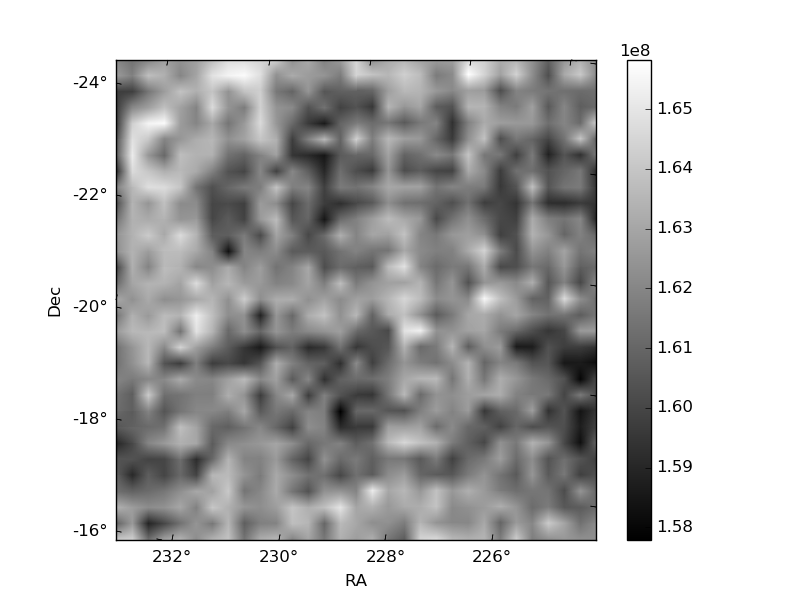
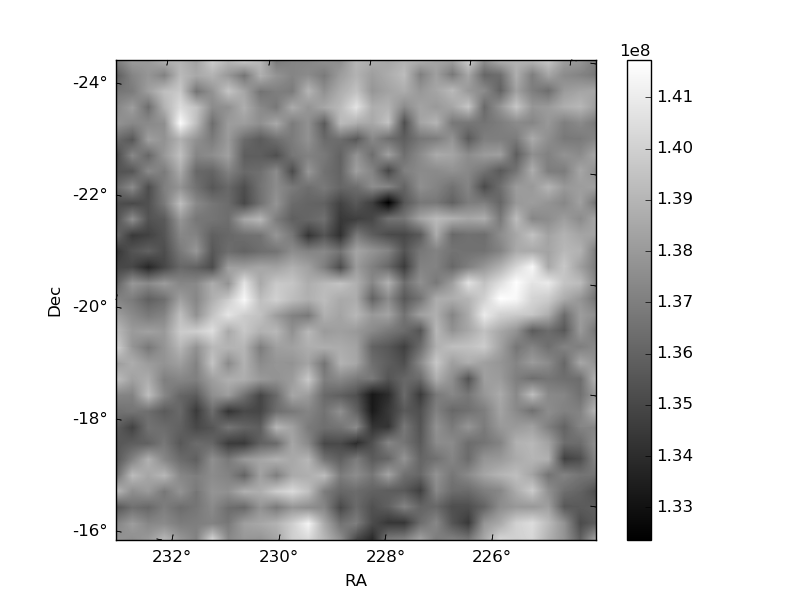
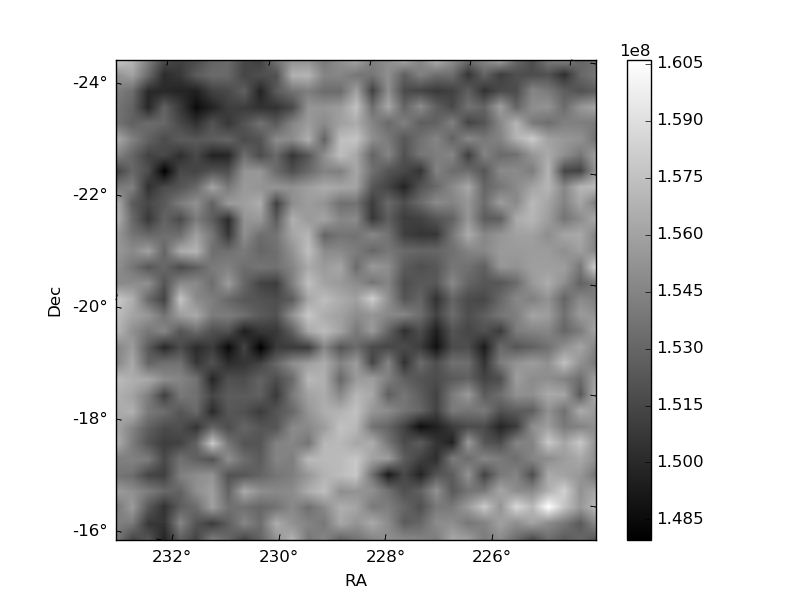
Histogram calculated using DETX and DETY for each event in the final _common_clean file
| Quadrant A | 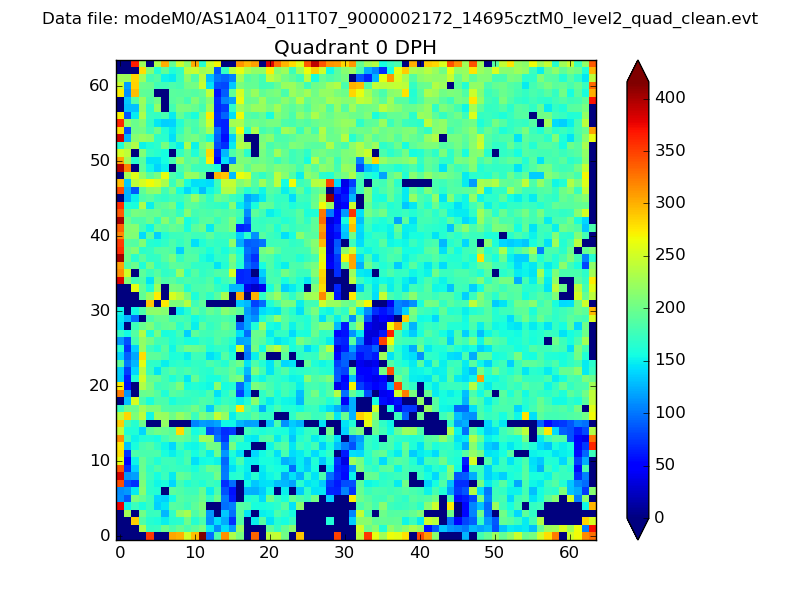 |
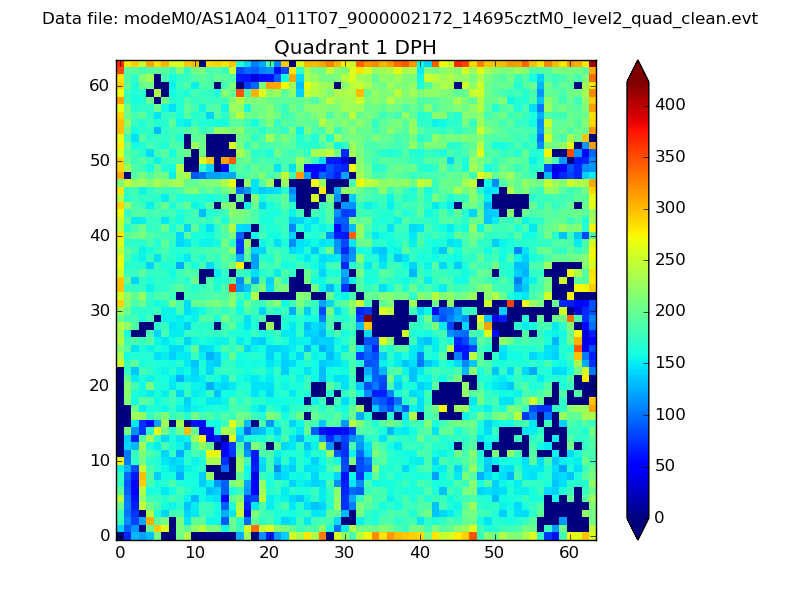 |
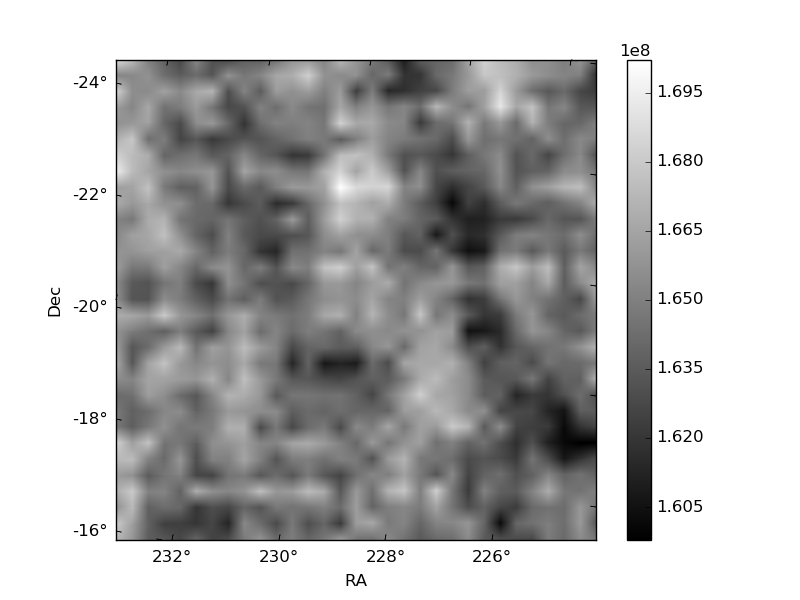
Quadrant B |
|---|---|---|---|
| Quadrant D | 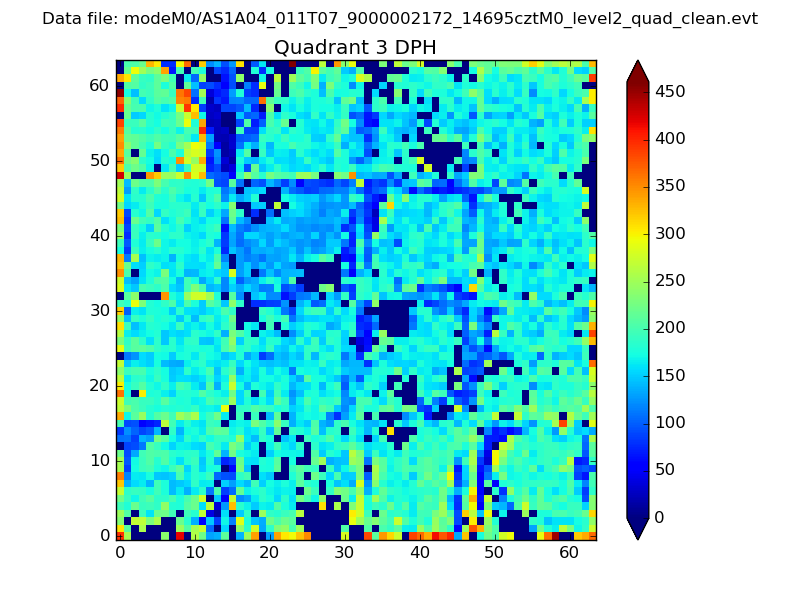 |
 |
Quadrant C |
| Plot type | Count rate plots | Images |
|---|---|---|
| Comparison with Poisson distribution Blue bars denote a histogram of data divided into 1 sec bins. Red curve is a Poisson curve with rate = median count rate of data. |
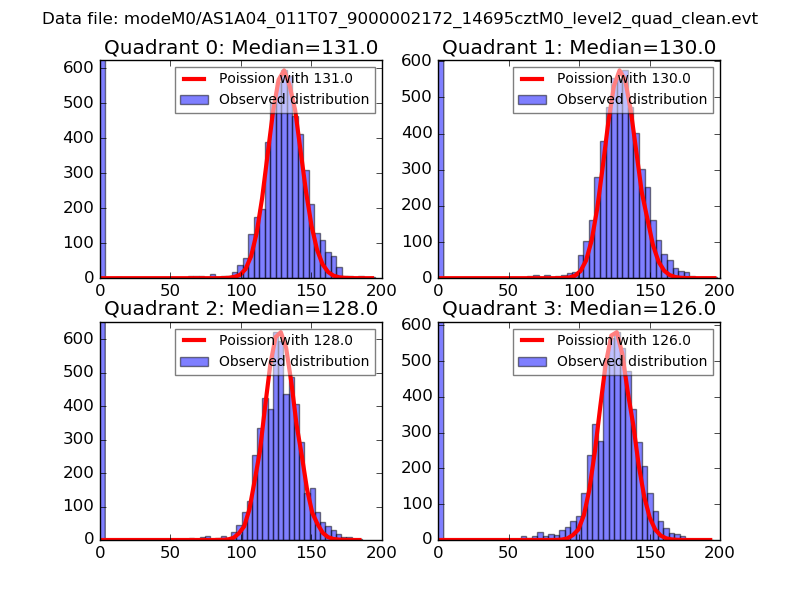 |
 |
| Quadrant-wise count rates Data is divided into 100 sec bins |
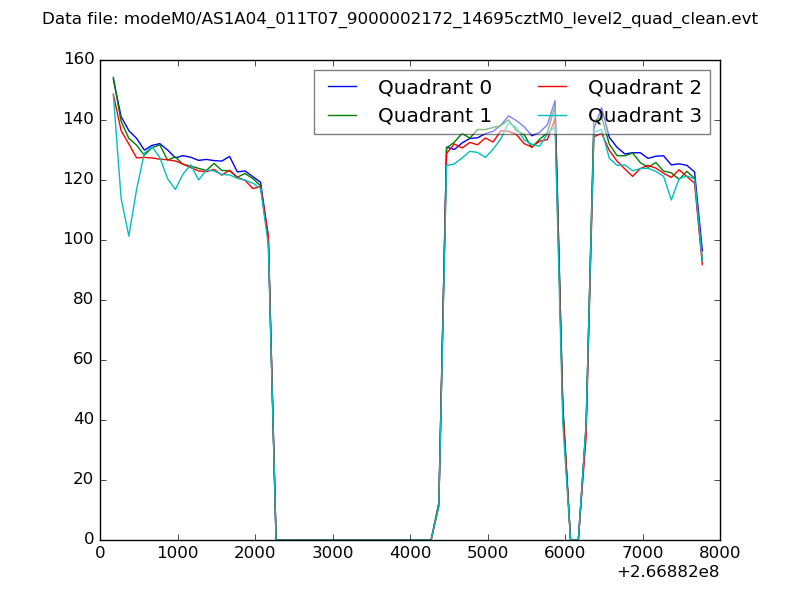 |
|
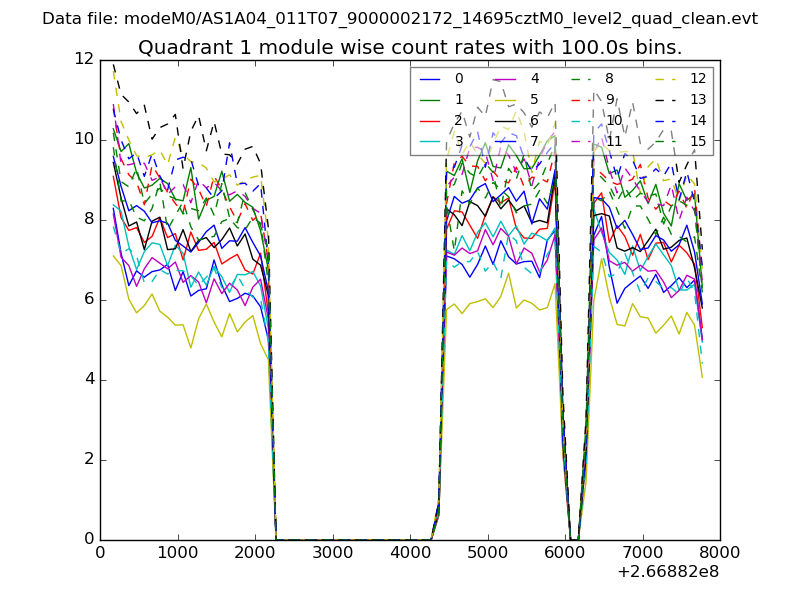
| Module-wise count rates for Quadrant A Data is divided into 100 sec bins |
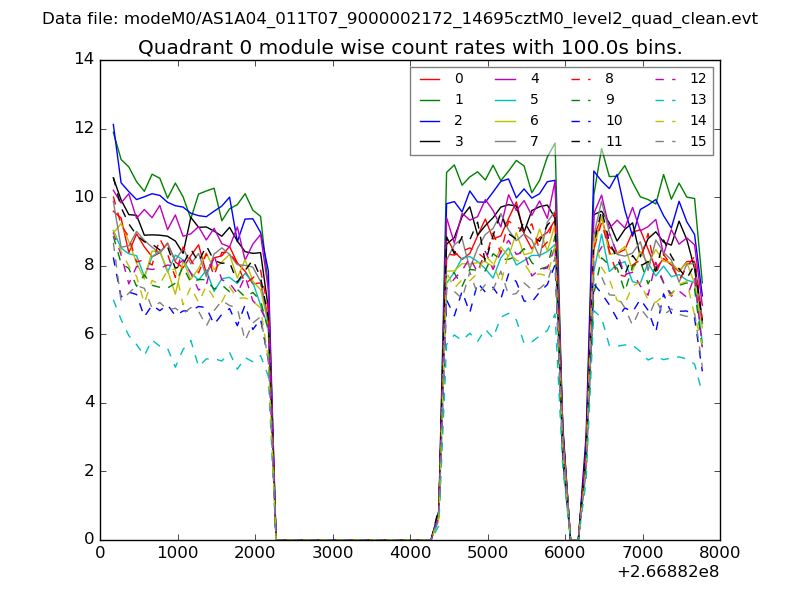 |
 |
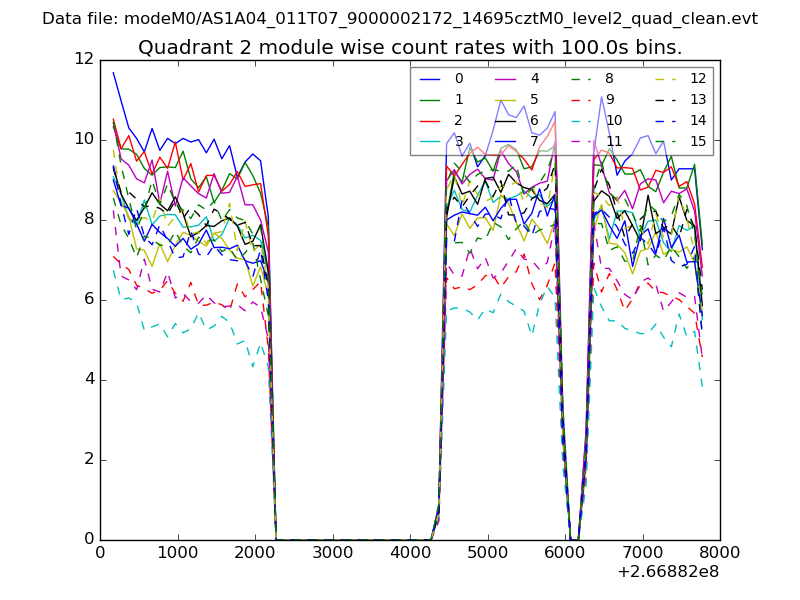
| Module-wise count rates for Quadrant B Data is divided into 100 sec bins |
 |
 |
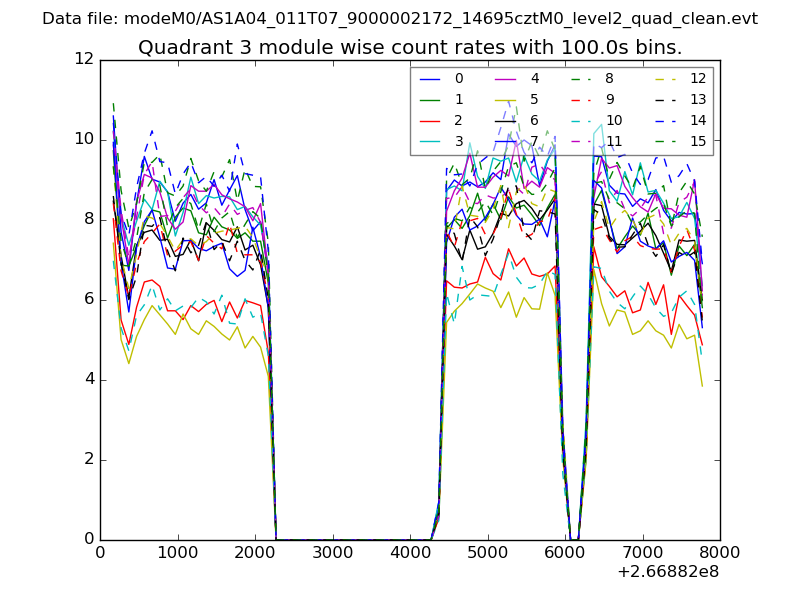
| Module-wise count rates for Quadrant C Data is divided into 100 sec bins |
 |
 |
| Module-wise count rates for Quadrant D Data is divided into 100 sec bins |
 |
 |
| Parameter | Plot |
|---|---|
| CZT HV Monitor | 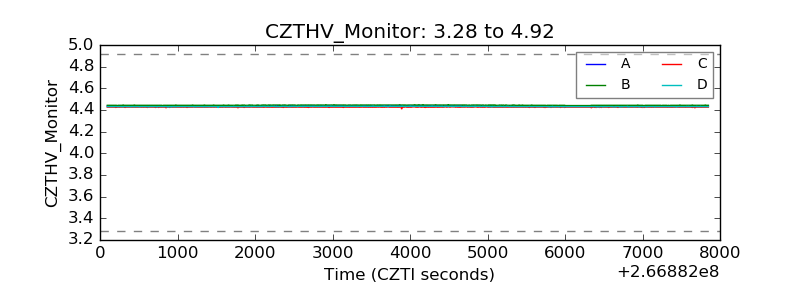 |
| D_VDD | 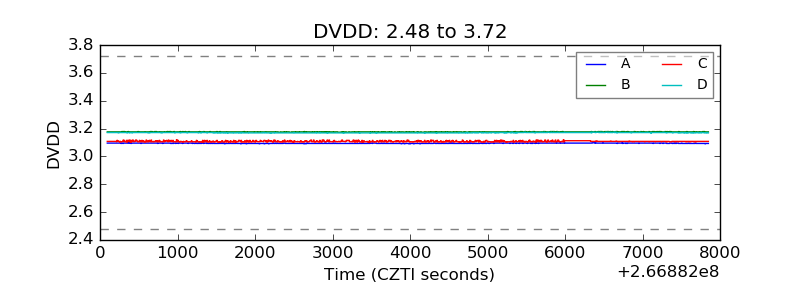 |
| Temperature 1 | 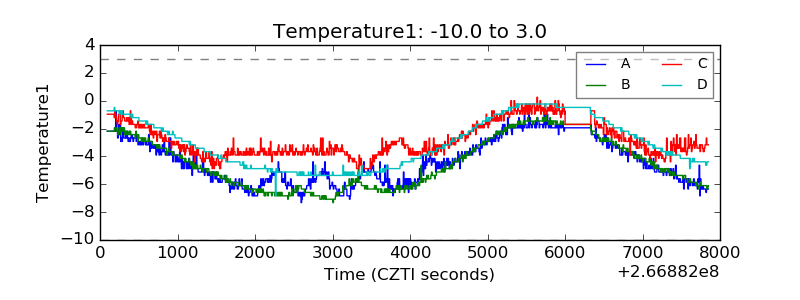 |
| Veto HV Monitor | 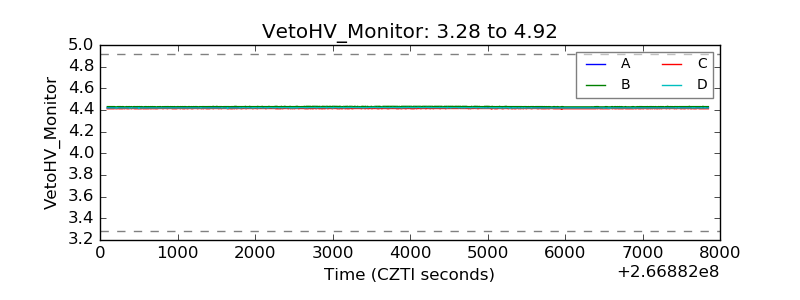 |
| Veto LLD | 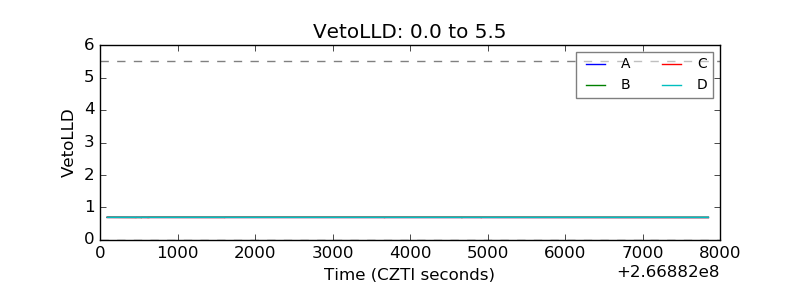 |
| Alpha Counter | 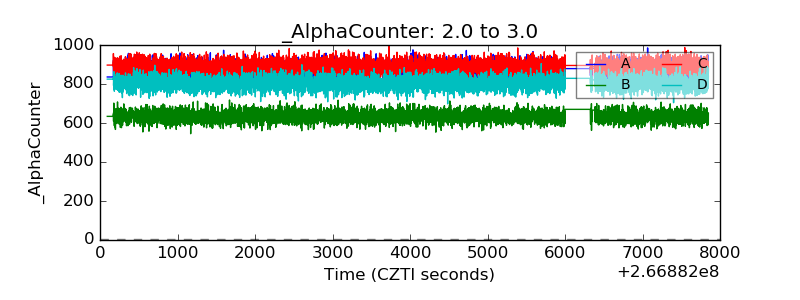 |
| _CPM_Rate | 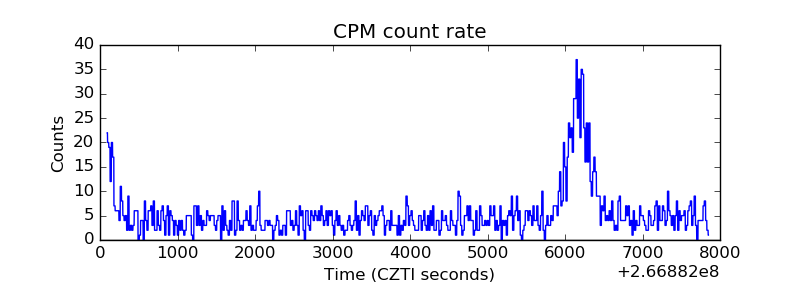 |
| CZT Counter |  |
| +2.5 Volts monitor |  |
| +5 Volts monitor | 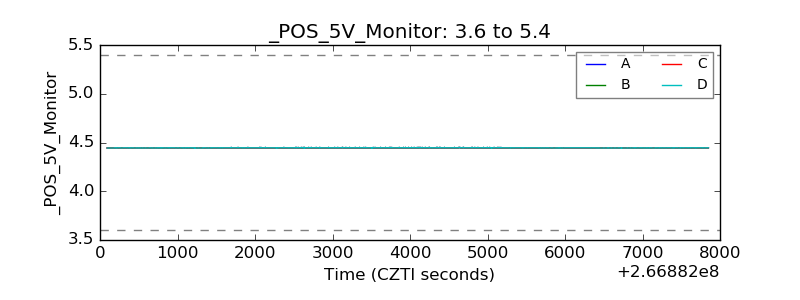 |
| _ROLL_ROT | 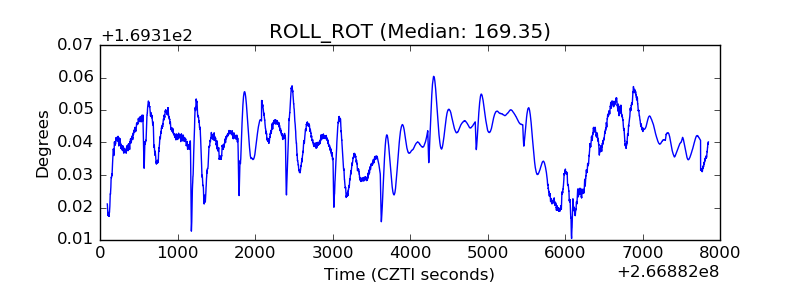 |
| _Roll_DEC | 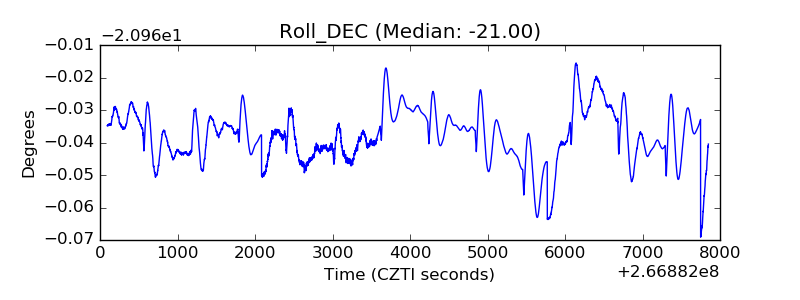 |
| _Roll_RA | 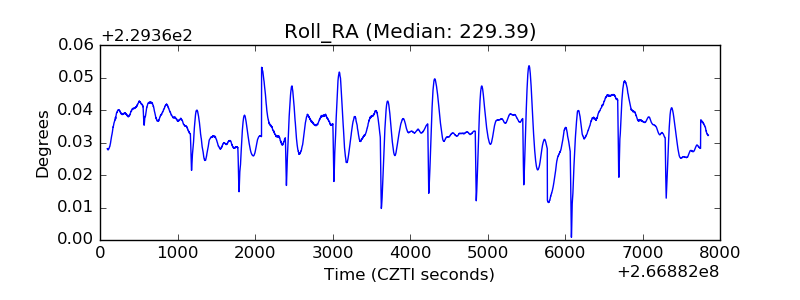 |
| Veto Counter | 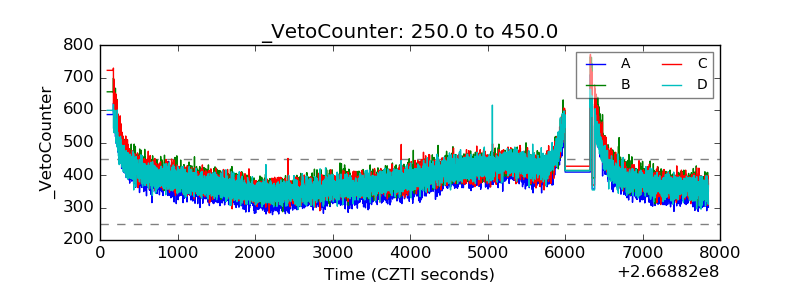 |