| Param | Original file | Final file |
|---|---|---|
| Filename | modeM0/AS1G08_057T09_9000002174cztM0_level2.fits | modeM0/AS1G08_057T09_9000002174cztM0_level2_quad_clean.evt |
| Size (bytes) | 711,780,480 | 669,458,880 |
| Size | 678.8 MB | 638.4 MB |
| Events in quadrant A | 4,374,102 | 4,034,367 |
| Events in quadrant B | 4,143,290 | 3,901,953 |
| Events in quadrant C | 4,243,476 | 3,738,183 |
| Events in quadrant D | 3,788,676 | 3,592,833 |
| Mode SS | |||
|---|---|---|---|
| Quadrant | BADHDUFLAG | Total packets | Discarded packets |
| A | 0 | 1488 | 0 |
| B | 0 | 1488 | 0 |
| C | 0 | 1488 | 0 |
| D | 0 | 1488 | 0 |
| Mode M0 | |||
|---|---|---|---|
| Quadrant | BADHDUFLAG | Total packets | Discarded packets |
| A | 0 | 153640 | 0 |
| B | 0 | 156120 | 0 |
| C | 0 | 195415 | 0 |
| D | 0 | 152810 | 0 |
| Mode M9 | |||
|---|---|---|---|
| Quadrant | BADHDUFLAG | Total packets | Discarded packets |
| A | 0 | 118 | 0 |
| B | 0 | 118 | 0 |
| C | 0 | 118 | 0 |
| D | 0 | 118 | 0 |
| Quadrant | Total seconds | Saturated seconds | Saturation percentage |
|---|---|---|---|
| A | 73027 | 702 | 0.961288% |
| B | 73027 | 1183 | 1.619949% |
| C | 73027 | 803 | 1.099593% |
| D | 73027 | 545 | 0.746299% |
Noise dominated data is calculated using 1-second bins in cleaned event files. If a bin has >2000 counts, and if more than 50% of those come from <1% of pixels, then it is considered to be noise-dominated and hence unusable.
| Quadrant | # 1 sec bins | Bins with >0 counts | Bins with >2000 counts | High rate bins dominated by noise | Noise dominated (total time) | Noise dominated (detector-on time) | Marked lightcurve |
|---|---|---|---|---|---|---|---|
| A | 84772 | 73019 | 0 | 0 | 0.00% | 0.00% |  |
| B | 84772 | 73010 | 0 | 0 | 0.00% | 0.00% |  |
| C | 84772 | 73019 | 0 | 0 | 0.00% | 0.00% |  |
| D | 84772 | 73018 | 0 | 0 | 0.00% | 0.00% | 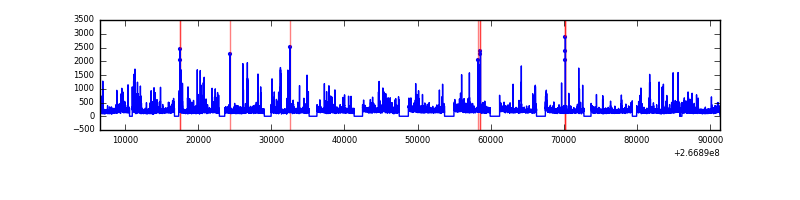 |
Top three noisy pixels from each quadrant. If the there are fewer than three noisy pixels in the level2.evt file, extra rows are filled as -1
| Pixel properties | Quadrant properties | ||||||
|---|---|---|---|---|---|---|---|
| Quadrant | DetID | PixID | Counts | Sigma | Mean | Median | Sigma |
| A | 0 | 29 | 4168 | 11.01 | 1139 | 1070 | 281.5 |
| A | 7 | 110 | 3556 | 8.83 | 1139 | 1070 | 281.5 |
| A | 9 | 19 | 3278 | 7.84 | 1139 | 1070 | 281.5 |
| B | 2 | 9 | 3532 | 11.47 | 1095 | 1043 | 217.0 |
| B | 3 | 17 | 2782 | 8.01 | 1095 | 1043 | 217.0 |
| B | 3 | 80 | 2737 | 7.81 | 1095 | 1043 | 217.0 |
| C | 1 | 80 | 3194 | 7.4 | 1122 | 1048 | 289.8 |
| C | 1 | 81 | 3113 | 7.12 | 1122 | 1048 | 289.8 |
| C | 12 | 241 | 2935 | 6.51 | 1122 | 1048 | 289.8 |
| D | 3 | 14 | 2800 | 6.2 | 1081 | 985 | 292.6 |
| D | 6 | 231 | 2752 | 6.04 | 1081 | 985 | 292.6 |
| D | 7 | 3 | 2750 | 6.03 | 1081 | 985 | 292.6 |
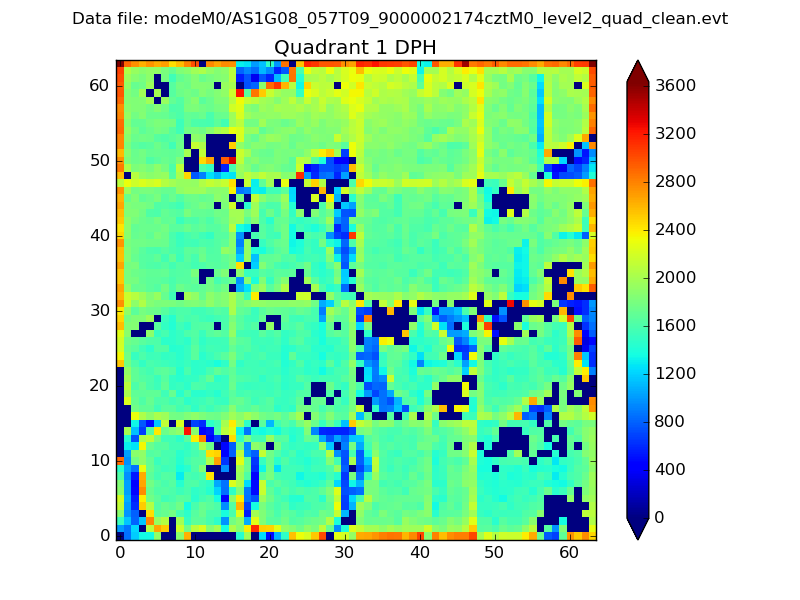
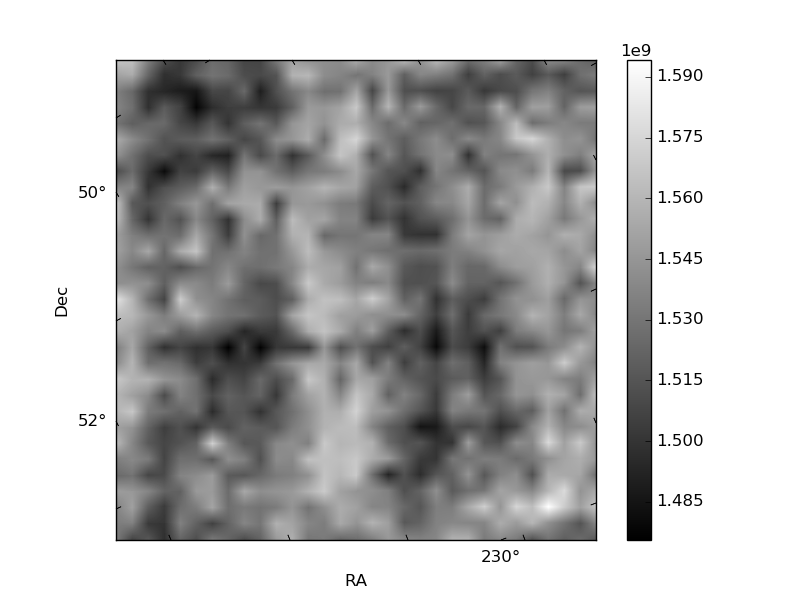
Histogram calculated using DETX and DETY for each event in the final _common_clean file
| Quadrant A |  |
 |
Quadrant B |
|---|---|---|---|
| Quadrant D | 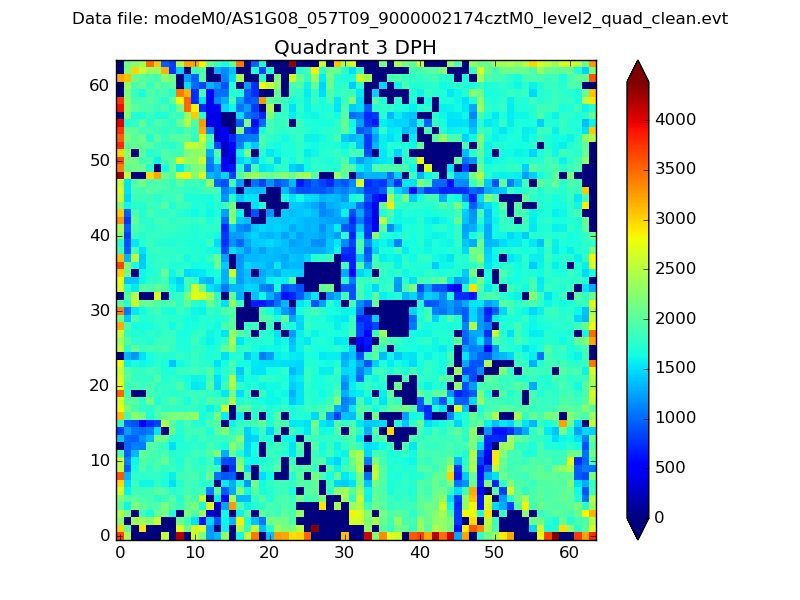 |
 |
Quadrant C |
| Plot type | Count rate plots | Images |
|---|---|---|
| Comparison with Poisson distribution Blue bars denote a histogram of data divided into 1 sec bins. Red curve is a Poisson curve with rate = median count rate of data. |
 |
 |
| Quadrant-wise count rates Data is divided into 100 sec bins |
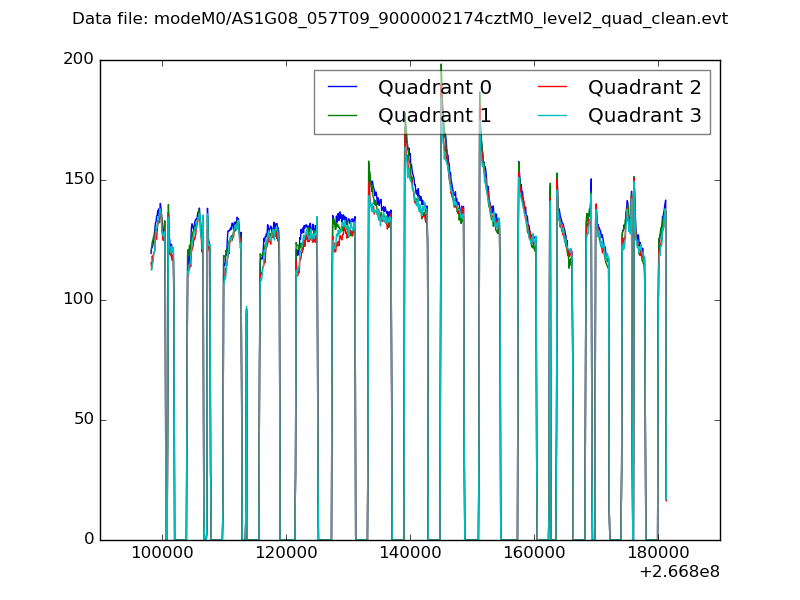 |
|
| Module-wise count rates for Quadrant A Data is divided into 100 sec bins |
 |
 |
| Module-wise count rates for Quadrant B Data is divided into 100 sec bins |
 |
 |
| Module-wise count rates for Quadrant C Data is divided into 100 sec bins |
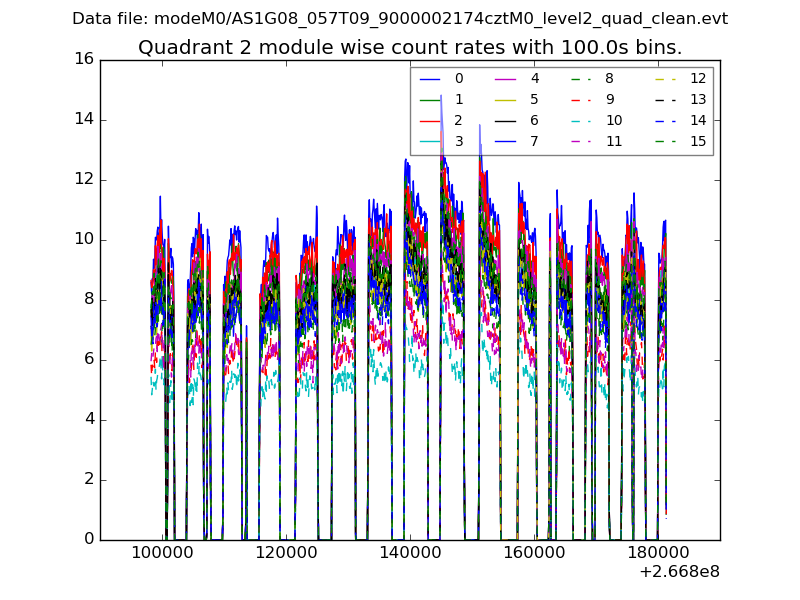 |
 |
| Module-wise count rates for Quadrant D Data is divided into 100 sec bins |
 |
 |
| Parameter | Plot |
|---|---|
| CZT HV Monitor |  |
| D_VDD |  |
| Temperature 1 |  |
| Veto HV Monitor |  |
| Veto LLD |  |
| Alpha Counter |  |
| _CPM_Rate |  |
| CZT Counter |  |
| +2.5 Volts monitor |  |
| +5 Volts monitor |  |
| _ROLL_ROT | 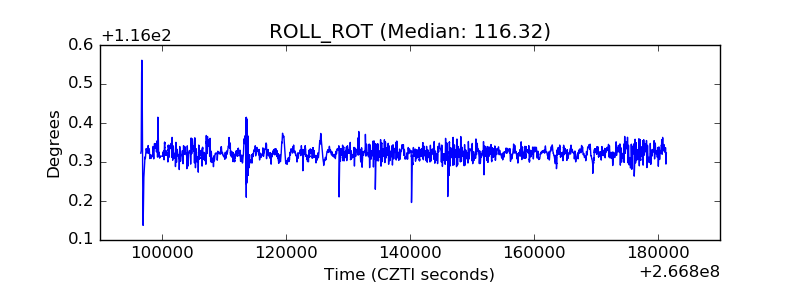 |
| _Roll_DEC |  |
| _Roll_RA | 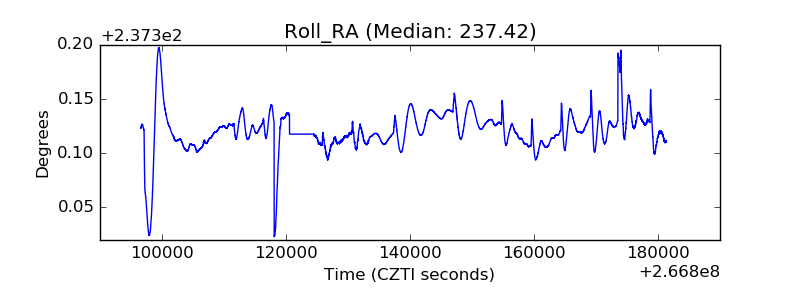 |
| Veto Counter |  |