| Param | Original file | Final file |
|---|---|---|
| Filename | modeM0/AS1G08_057T09_9000002174_14697cztM0_level2.evt | modeM0/AS1G08_057T09_9000002174_14697cztM0_level2_quad_clean.evt |
| Size (bytes) | 412,248,960 | 70,107,840 |
| Size | 393.2 MB | 66.9 MB |
| Events in quadrant A | 2,824,625 | 440,830 |
| Events in quadrant B | 2,665,268 | 434,105 |
| Events in quadrant C | 4,025,652 | 425,495 |
| Events in quadrant D | 2,588,567 | 430,342 |
| Mode SS | |||
|---|---|---|---|
| Quadrant | BADHDUFLAG | Total packets | Discarded packets |
| A | 0 | 116 | 0 |
| B | 0 | 116 | 0 |
| C | 0 | 116 | 0 |
| D | 0 | 116 | 0 |
| Mode M0 | |||
|---|---|---|---|
| Quadrant | BADHDUFLAG | Total packets | Discarded packets |
| A | 0 | 11875 | 2 |
| B | 0 | 11550 | 1 |
| C | 0 | 16218 | 1 |
| D | 0 | 11714 | 1 |
| Mode M9 | |||
|---|---|---|---|
| Quadrant | BADHDUFLAG | Total packets | Discarded packets |
| A | 0 | 3 | 0 |
| B | 0 | 3 | 0 |
| C | 0 | 3 | 0 |
| D | 0 | 3 | 0 |
| Quadrant | Total seconds | Saturated seconds | Saturation percentage |
|---|---|---|---|
| A | 5596 | 70 | 1.250893% |
| B | 5596 | 75 | 1.340243% |
| C | 5596 | 81 | 1.447462% |
| D | 5596 | 34 | 0.607577% |
Noise dominated data is calculated using 1-second bins in cleaned event files. If a bin has >2000 counts, and if more than 50% of those come from <1% of pixels, then it is considered to be noise-dominated and hence unusable.
| Quadrant | # 1 sec bins | Bins with >0 counts | Bins with >2000 counts | High rate bins dominated by noise | Noise dominated (total time) | Noise dominated (detector-on time) | Marked lightcurve |
|---|---|---|---|---|---|---|---|
| A | 5972 | 5597 | 3 | 3 | 0.05% | 0.05% | 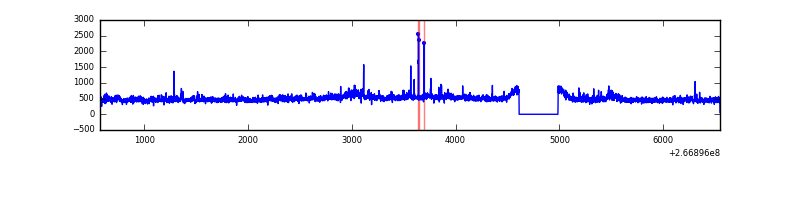 |
| B | 5972 | 5597 | 0 | 0 | 0.00% | 0.00% | 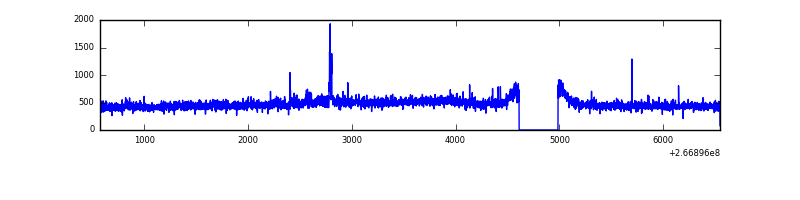 |
| C | 5972 | 5597 | 0 | 0 | 0.00% | 0.00% | 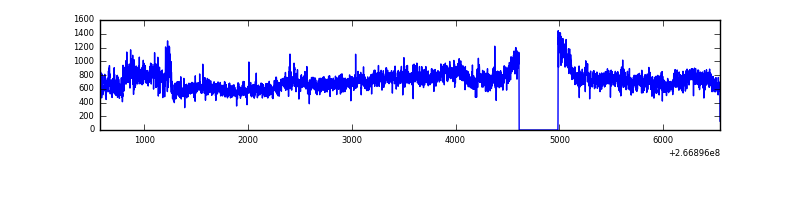 |
| D | 5972 | 5598 | 2 | 2 | 0.03% | 0.04% | 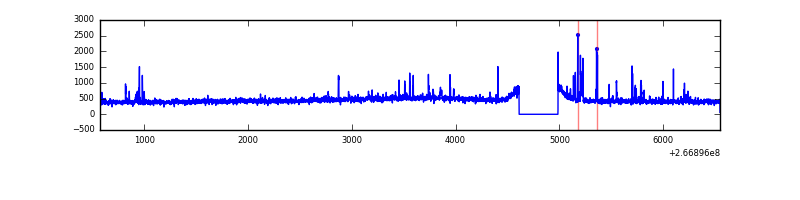 |
Top three noisy pixels from each quadrant. If the there are fewer than three noisy pixels in the level2.evt file, extra rows are filled as -1
| Pixel properties | Quadrant properties | ||||||
|---|---|---|---|---|---|---|---|
| Quadrant | DetID | PixID | Counts | Sigma | Mean | Median | Sigma |
| A | 12 | 189 | 130842 | 951.65 | 667 | 651 | 136.8 |
| A | 8 | 15 | 88425 | 641.6 | 667 | 651 | 136.8 |
| A | 9 | 143 | 30484 | 218.07 | 667 | 651 | 136.8 |
| B | 0 | 214 | 23925 | 181.13 | 662 | 645 | 128.5 |
| B | 0 | 205 | 20454 | 154.12 | 662 | 645 | 128.5 |
| B | 0 | 197 | 18903 | 142.05 | 662 | 645 | 128.5 |
| C | 3 | 233 | 1477971 | 9839.84 | 645 | 648 | 150.1 |
| C | 3 | 234 | 12697 | 80.25 | 645 | 648 | 150.1 |
| C | 8 | 128 | 7068 | 42.76 | 645 | 648 | 150.1 |
| D | 12 | 110 | 71485 | 452.94 | 647 | 630 | 156.4 |
| D | 2 | 234 | 21439 | 133.02 | 647 | 630 | 156.4 |
| D | 2 | 120 | 18887 | 116.71 | 647 | 630 | 156.4 |
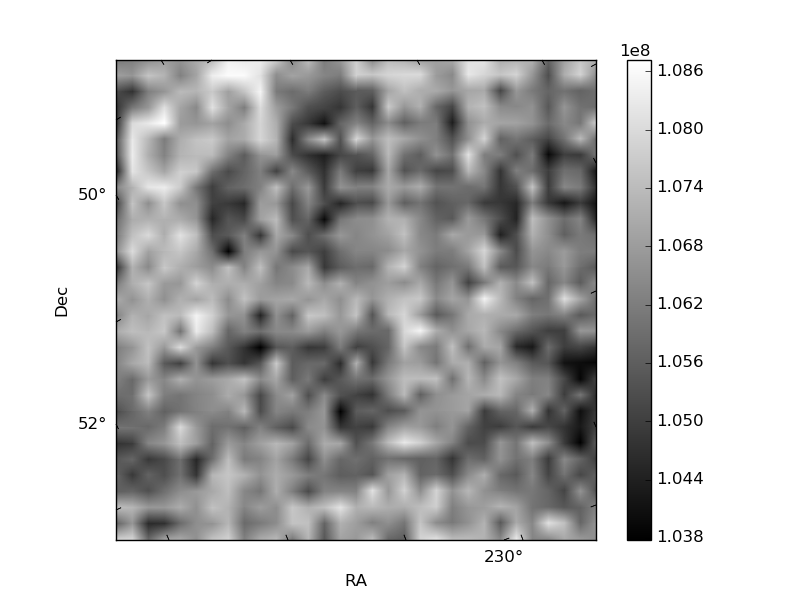
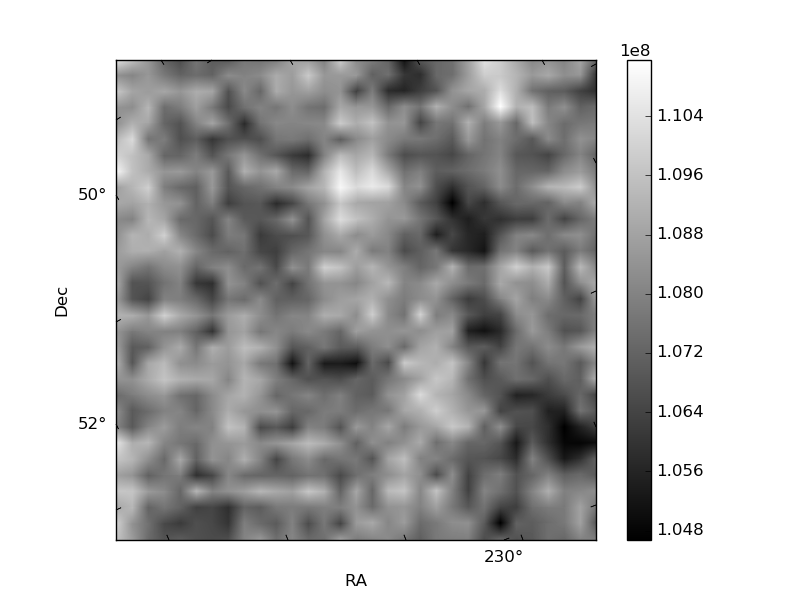
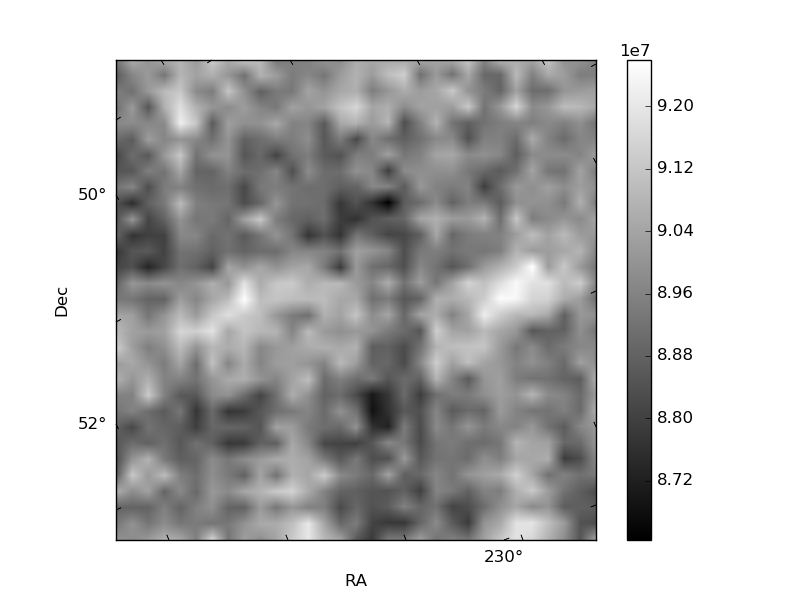
Histogram calculated using DETX and DETY for each event in the final _common_clean file
| Quadrant A | 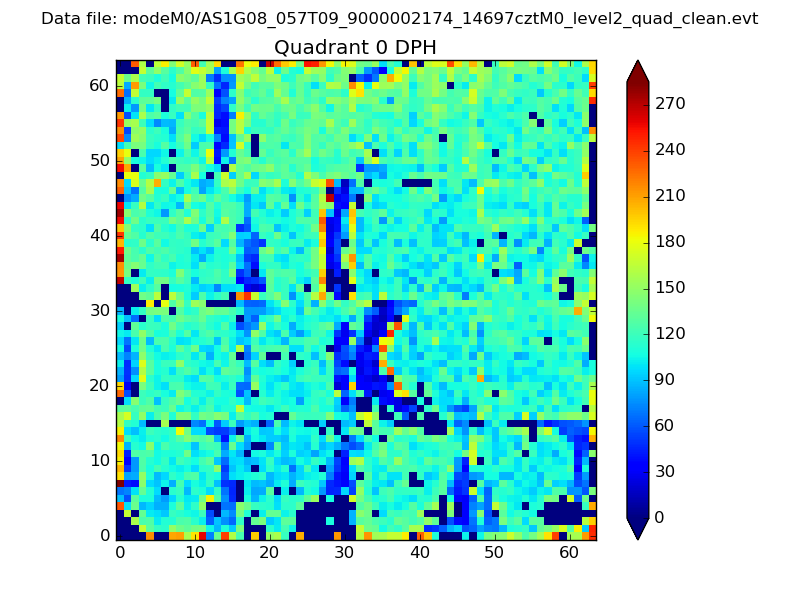 |
 |
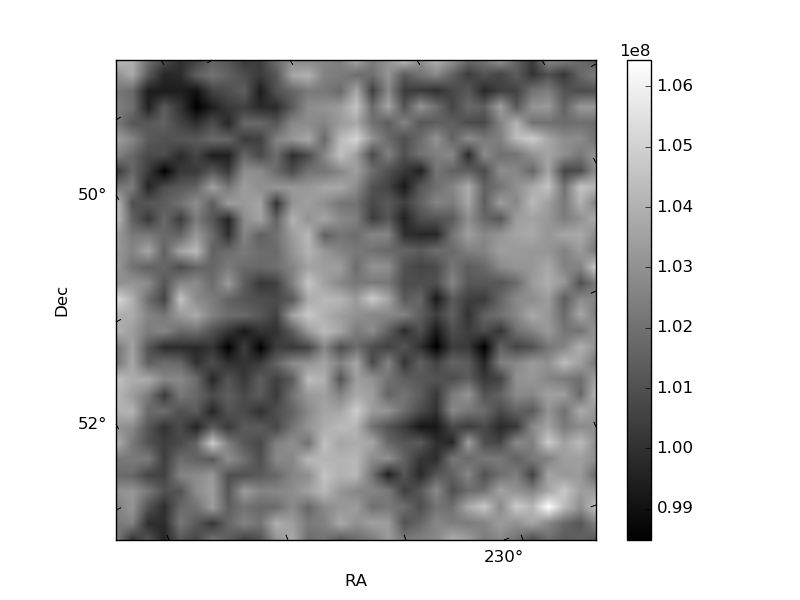
Quadrant B |
|---|---|---|---|
| Quadrant D | 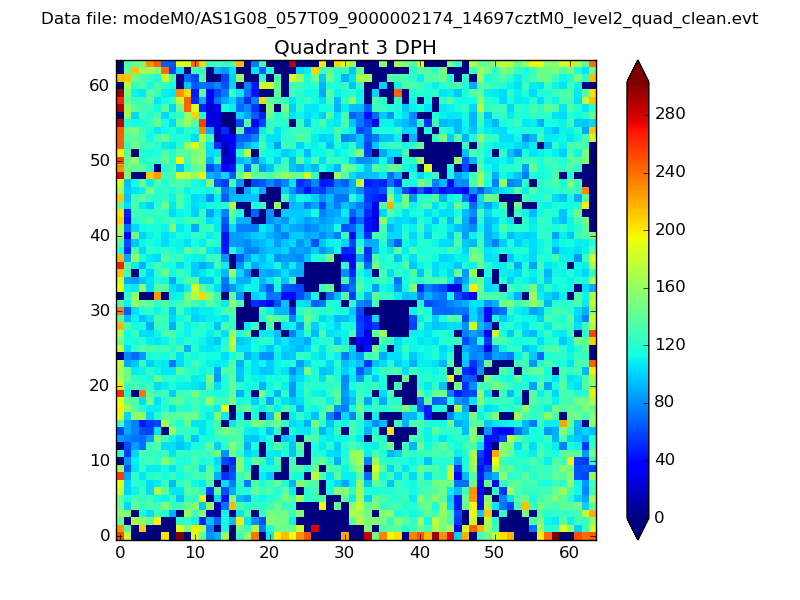 |
 |
Quadrant C |
| Plot type | Count rate plots | Images |
|---|---|---|
| Comparison with Poisson distribution Blue bars denote a histogram of data divided into 1 sec bins. Red curve is a Poisson curve with rate = median count rate of data. |
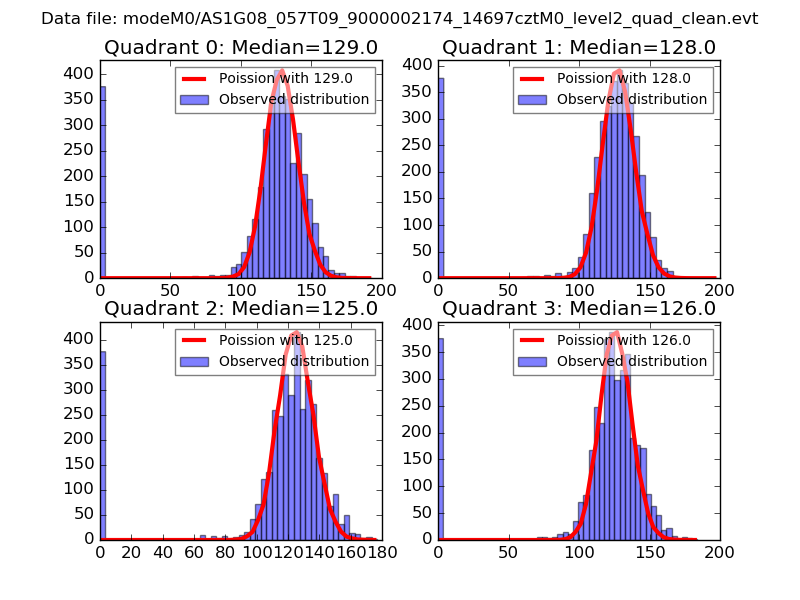 |
 |
| Quadrant-wise count rates Data is divided into 100 sec bins |
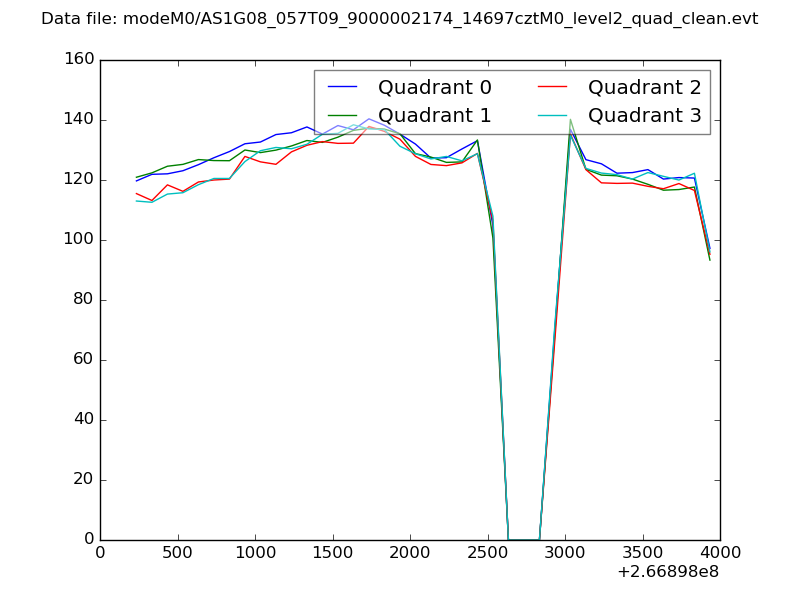 |
|
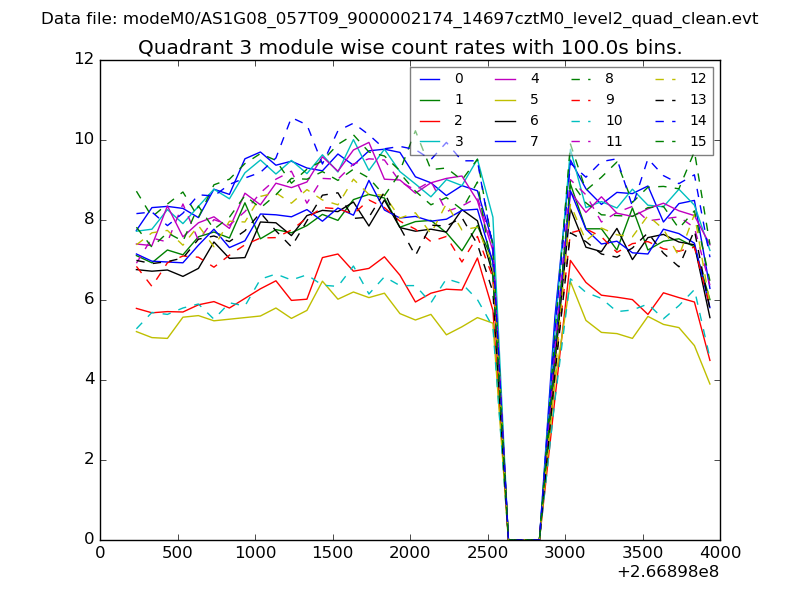
| Module-wise count rates for Quadrant A Data is divided into 100 sec bins |
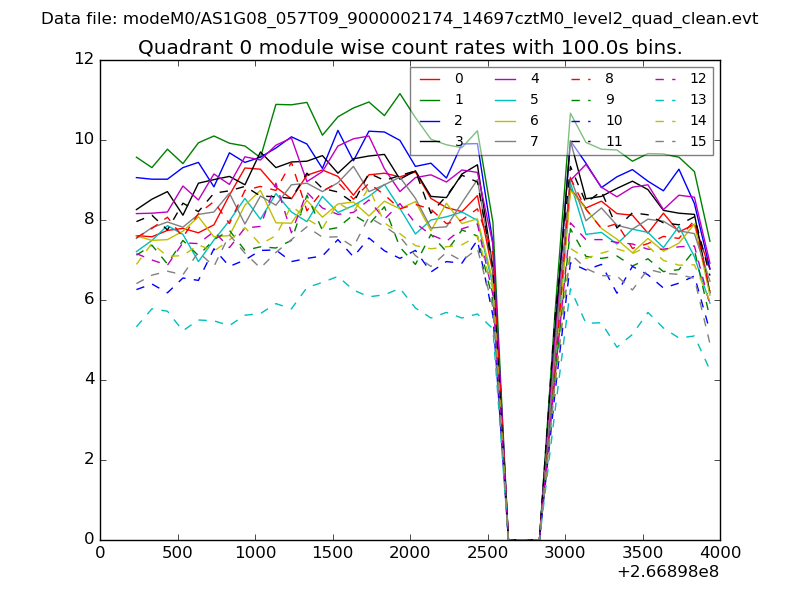 |
 |
| Module-wise count rates for Quadrant B Data is divided into 100 sec bins |
 |
 |
| Module-wise count rates for Quadrant C Data is divided into 100 sec bins |
 |
 |
| Module-wise count rates for Quadrant D Data is divided into 100 sec bins |
 |
 |
| Parameter | Plot |
|---|---|
| CZT HV Monitor |  |
| D_VDD | 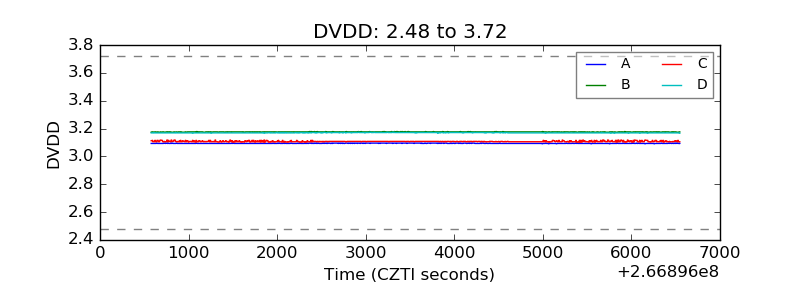 |
| Temperature 1 | 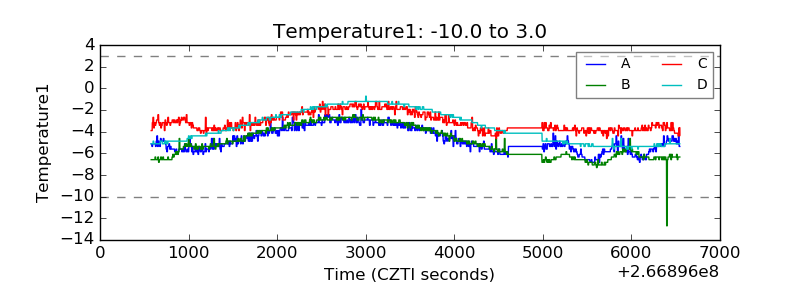 |
| Veto HV Monitor | 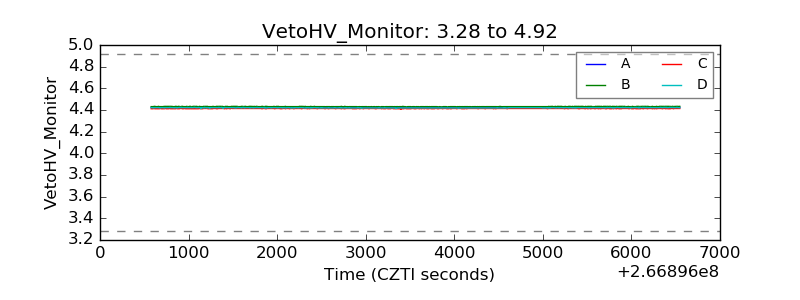 |
| Veto LLD | 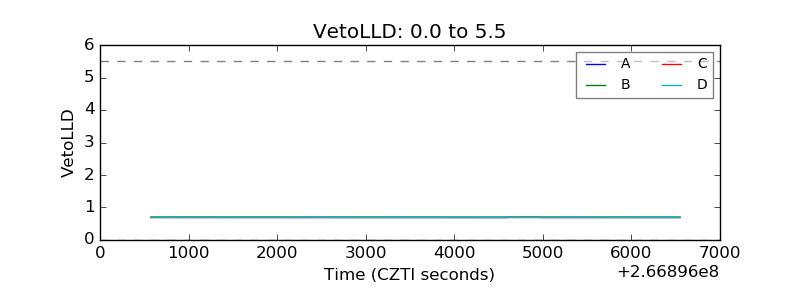 |
| Alpha Counter | 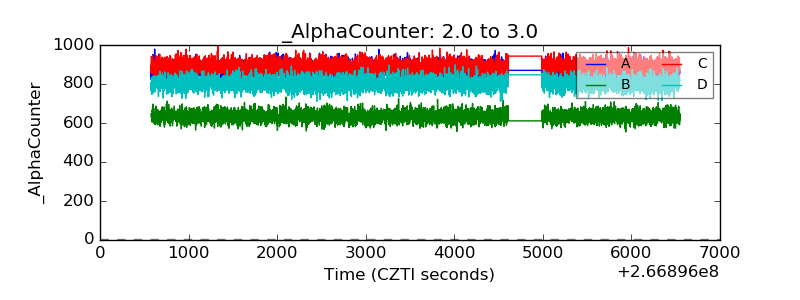 |
| _CPM_Rate | 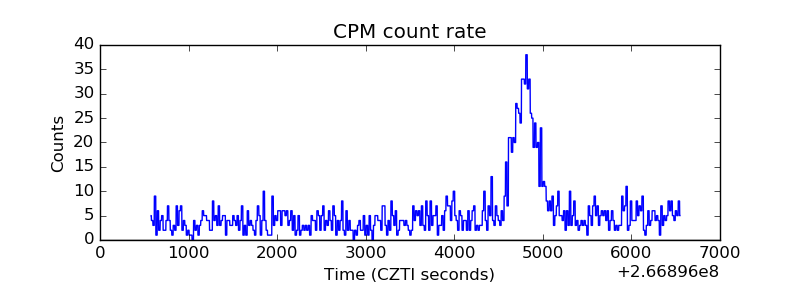 |
| CZT Counter | 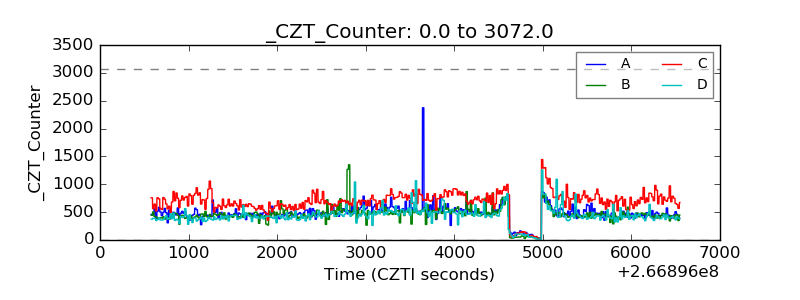 |
| +2.5 Volts monitor |  |
| +5 Volts monitor |  |
| _ROLL_ROT | 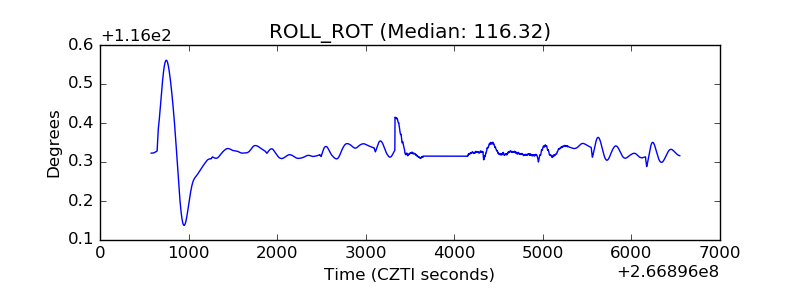 |
| _Roll_DEC | 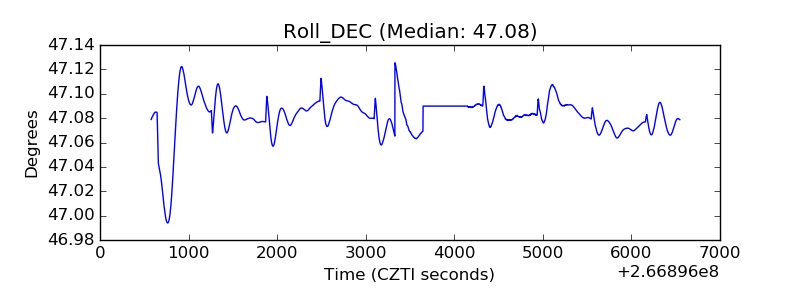 |
| _Roll_RA | 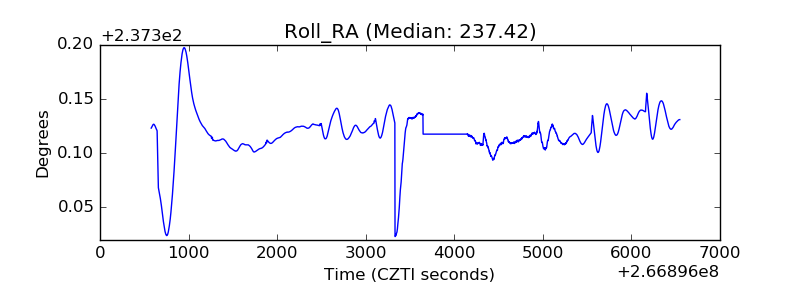 |
| Veto Counter | 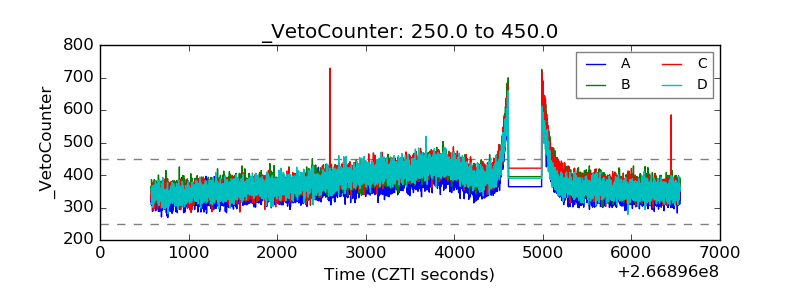 |